Debug or Be Doomed: How Errors Nearly Sparked World War III
 Chidozie C. Okafor
On September 26, 1983, in the dead of night, sirens went out at a Soviet nuclear early warning facility. Five intercontinental ballistic missiles were displayed on the computer screens, all aimed directly at the Soviet Union and launched from the United States. The officer on duty, Lieutenant Colonel Stanislav Petrov, had only minutes to determine whether to report this as an actual attack, which may have resulted in a disastrous nuclear reaction.
However, Petrov had a bad feeling about something. Why would the United States launch just five missiles in a first attack? It was nonsensical. He reported the warning as a system breakdown, following his gut.
His suspicion was right. Subsequent analysis showed that the satellite warning system had mistakenly identified missile launches as sunlight bouncing off cloud tops. A software flaw in the system caused it to fail to reject this false positive, almost bringing about the apocalyptic nuclear war.
This terrifying story serves as a stark reminder of a crucial lesson in software development: flaws can have far-reaching, even game-changing effects. While not every bug poses a threat to the entire world, even little mistakes can result in large financial losses, tarnished reputations, or jeopardized user safety.
We as developers should never undervalue the significance of careful debugging and testing. It is important to guarantee the dependability, security, and integrity of the systems we develop rather than only correcting mistakes. Keeping that in mind, let’s explore how to become experts at debugging with Visual Studio Code, one of the most potent tools available.
The Great Console.log Crusade
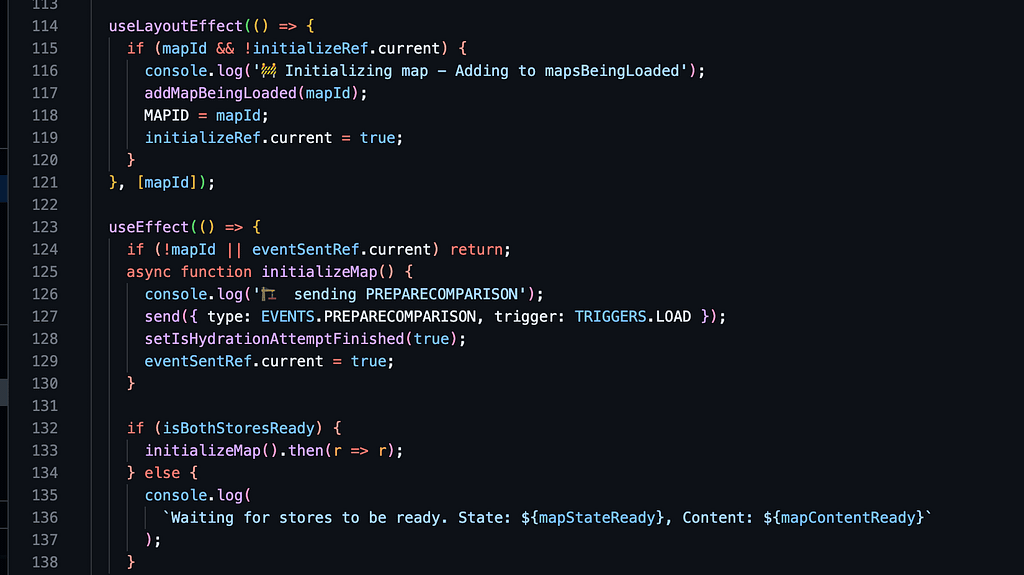
At ProPro Productions, we thought we were the kings and queens of debugging. Our weapon of choice? The almighty console.log(). It was quick, it was easy, and it felt like we were getting things done. Little did we know, we were marching into a battle we were destined to lose.
It started innocently enough. A bug here, a console.log("Debug1") there. Before long, our codebase looked like a warzone, littered with console.log("Here"), console.log("Now here"), and the ever-helpful console.log("WHY????"). We were soldiers in the Console.log Crusade, and we were proud.
But pride comes before the fall.
Our issues expanded along with our app. What used to render in milliseconds now crept along, panting for air. Our little application, which was only meant to show a few stacks and carry out some simple functions, was unexpectedly using up about 4GB of RAM. Who’s at fault? Allocating thousands of heaps.
We discovered that we were stuck adding log after log in an attempt to figure out why we had so many. We were the snake that was devouring our own tail.
In the postmortem of our console.log crusade, we realized a harsh truth: we lacked any true understanding of the behavior of our application. Our logs were a crutch, a delusion of security that prevented us from seeing the true problems with our programming.
It was time to make a shift. It was time to put down the console.log weapons and master the technique of actual debugging. At that point, we realized the value of appropriate debugging tools, especially those provided by Visual Studio Code.
While our console.log crisis didn’t risk global annihilation, history shows us that software bugs can have far more severe consequences Think back to the evening of September 26, 1983, when a Soviet nuclear early warning center’s alarms went off.
VSCode: The Debugging Hero We Needed
In the aftermath of our console.log disaster, we knew it is time to teach and enforce the team to use a debugger and vscode debugger is clearly powerful.
Had we harnessed the power of VSCode’s debugging tools earlier, our console.log crisis could have been averted. Here’s how VSCode could have transformed our debugging process:
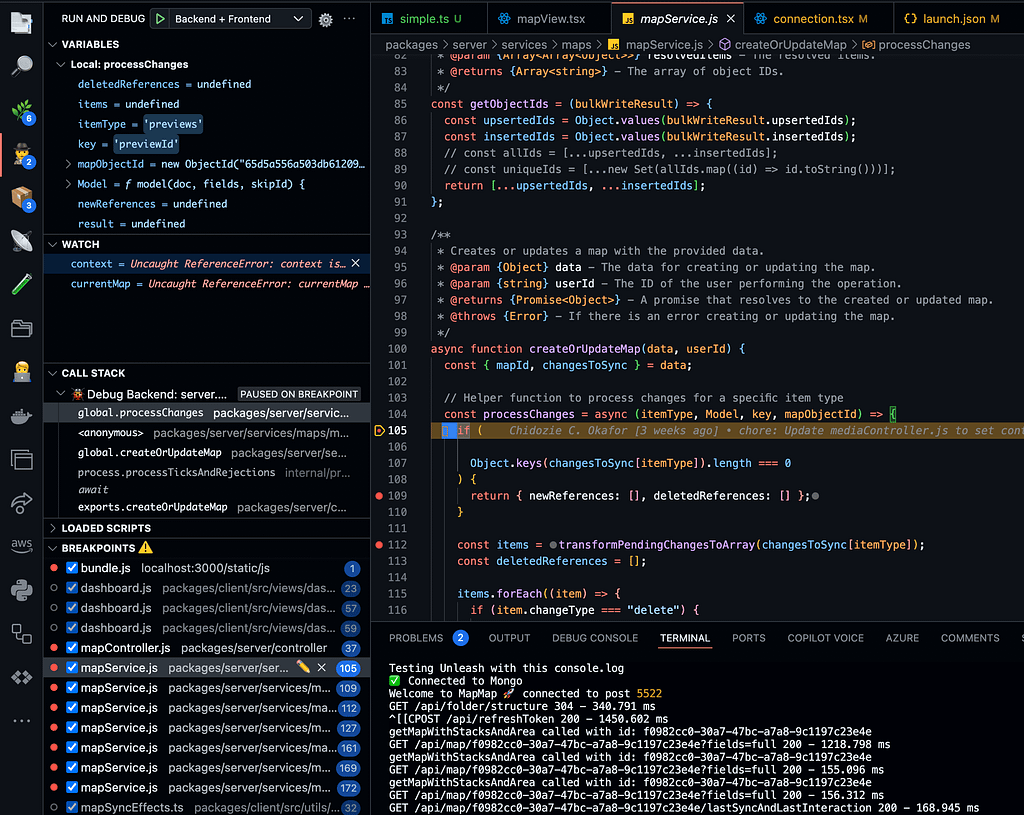
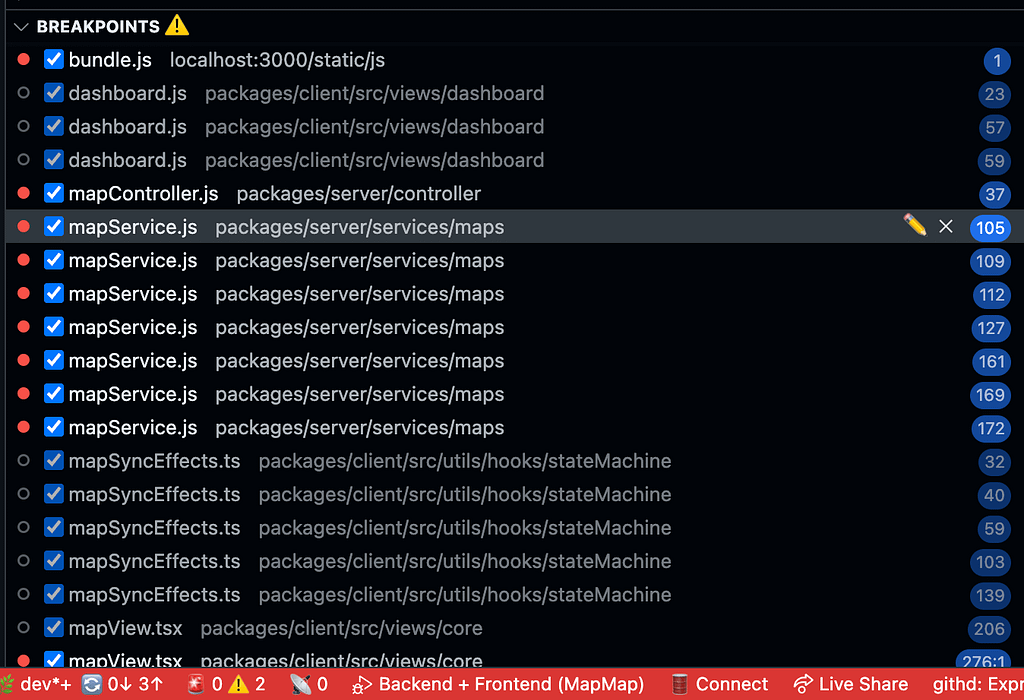
Breakpoints Instead of Console Spam: Rather than littering our code with console.log statements, we could have set strategic breakpoints. These would have allowed us to pause execution at critical points and examine the state of our application without cluttering the console or impacting performance.
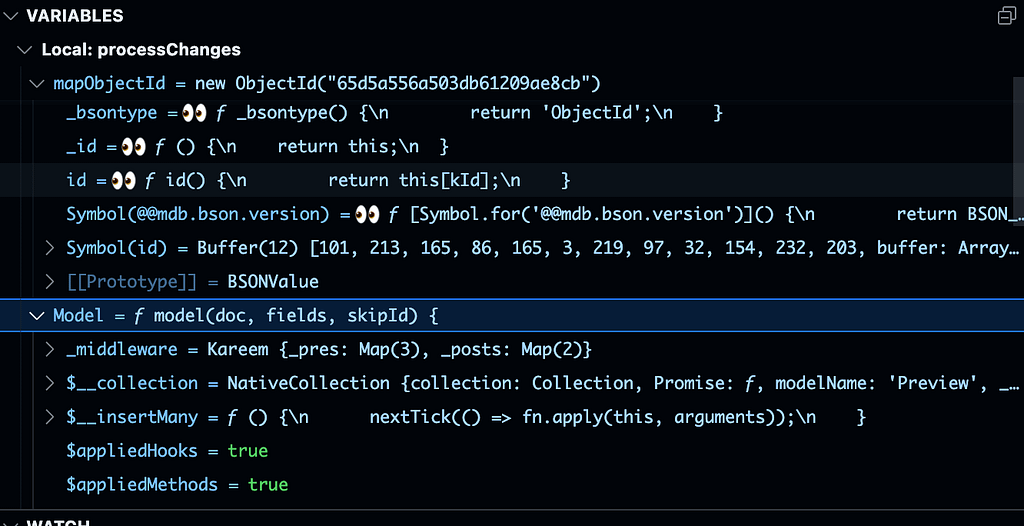
Variable Inspection: Instead of logging variables to the console, VSCode’s debug view would have let us inspect all local and global variables in real-time. We could have seen their values change as we stepped through the code, providing much clearer insights into our application’s behavior.
Call Stack Analysis: Our console.logs gave us a fragmented view of execution flow. VSCode’s call stack feature would have shown us the exact path of execution, making it easy to trace how we arrived at a particular point in our code.
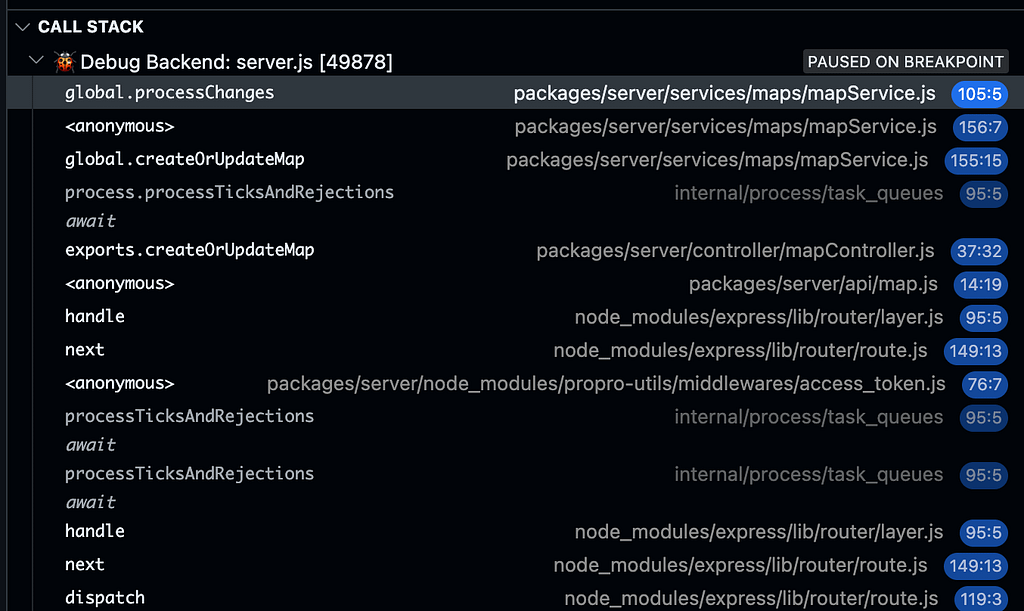
Conditional Breakpoints: For those tricky bugs that only appear under certain conditions, we could have used conditional breakpoints. These would have allowed us to pause execution only when specific criteria were met, eliminating the need for complex if-statements around our console.logs.


Watch Expressions: Instead of repeatedly logging the same expressions, we could have set up watch expressions in VSCode. These would have shown us the values of important expressions throughout our debugging session, updating in real-time as we stepped through the code.
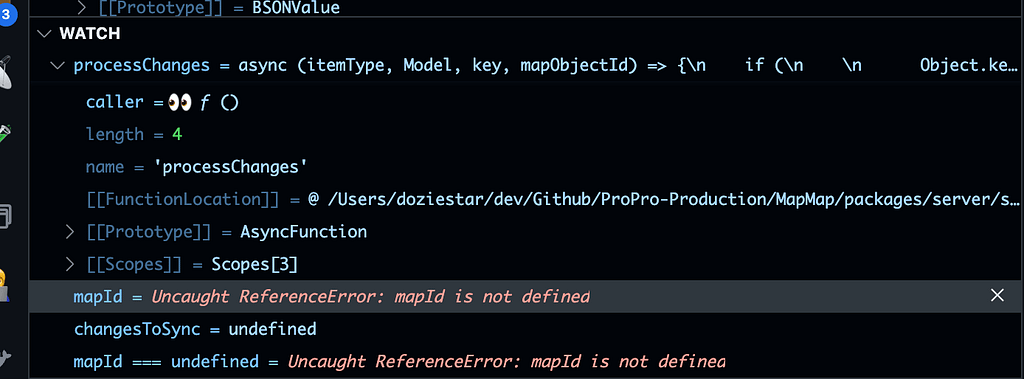
Debug Console: For those times when we really needed to log something, VSCode’s debug console would have provided a cleaner, more organized way to do so. We could have executed arbitrary code and logged values without modifying our source files.

Instead of using the harsh method of console.log debugging, we may have obtained profound understanding of our application’s behavior by utilizing these functionalities. We could have prevented the humiliation of a demo that was console-flooded, identified our performance problems sooner, and improved our understanding of our code flow.
Here are few articles on how to use a debugger in different IDEs.
Vscode: https://code.visualstudio.com/docs/editor/debugging
JetBrains: https://www.jetbrains.com/help/idea/debugging-code.html
Remember, in the wild world of coding:
- Console.log is like fast food: It’s quick, it’s easy, but too much will clog your arteries… err, codebase.
- Breakpoints are your new BFFs: They’re like loyal puppies, always there when you need them, never judging your variable naming choices.
- The call stack is your time machine: Where where you? How did you get here? No need for flux capacitors; the call stack has your back.
- Conditional breakpoints are like bouncers: They only let the VIP (Very Infuriating Problems) through, keeping the riffraff out of your debug party.
- Watch expressions are your personal crystal ball: Gaze into them and see the future (state) of your variables!
So the next time you’re tempted to sprinkle your code with more console.logs than a lumberjack convention, remember: real developers debug with style. They use VSCode, they use breakpoints, and they definitely don’t start accidental nuclear wars.
Now go forth and debug like the coding champion you are! May your breakpoints be ever in your favor, and may your bugs be squashed like the insignificant insects they are. Happy debugging, and remember — in the eternal words of the great debuggers before us:
“To err is human, to debug divine.”

Subscribe to my newsletter
Read articles from Chidozie C. Okafor directly inside your inbox. Subscribe to the newsletter, and don't miss out.
Written by

Chidozie C. Okafor
Chidozie C. Okafor
With a sparkling five years of experience, I've triumphed in both web and mobile development, feasting on a banquet of front-end and back-end technologies. Picture me as a tech aficionado, devouring new frameworks and skills at lightning speed – "Hello, World!" can hardly keep up! As an open-minded and ever-curious adventurer, I'm always eager for fresh experiences, striving to forge a fulfilling and thrilling career in software development. Through hands-on practice, I continuously refine my development techniques, transforming each challenge into a chance to learn and flourish. Dedication and drive fuel my every project, guaranteeing unparalleled success for the organization. With a perfect blend of professionalism and charisma, I create a captivating presence that's simply irresistible. So, let's join forces and embark on this exhilarating journey together! My toolbox is brimming with Python (Django and FastAPI), TypeScript (Node and Express), Golang, Kafka, GRPC, REST, GraphQL, and a plethora of cloud technologies. Delighted to contribute as both a backend developer and a DevOps engineer, I'm the versatile team player you've been searching for. A swift learner, I dedicate my time to mastering skills that streamline the job without compromising efficiency. As part of your team, you'll gain a well-rounded, imaginative powerhouse committed to meeting deadlines and exceeding expectations. Let's get started! 🌟