Discovering Grafana Loki
 Bruno
Bruno
Overview
Loki is a log aggregation system inspired by Prometheus. It is designed to be very cost effective and easy to operate.
It is a component of LGTM Stack which is composed of :
Grafana
Loki
Tempo (traces)
Mimir (TSDB)
This topic is focus to understand, evaluating and testing the very basics of the Grafana Loki.
It guides you through installing Grafana and Loki via the official Docker images for testing purpose.
Requirements
To follow this guide, we have to install Docker.
Please refer to this link to get the generic installation steps.
Install Grafana
Use this following command to install Grafana on Docker container.
Version 11.1.0 is the latest stable version when I write these lines.
$ docker network create lgtm
$ docker run -d \
--name=grafana \
--hostname=grafana \
--network=lgtm \
-p 3000:3000 \
grafana/grafana-oss:11.1.0
Grafana listens on port 3000 and the default credentials are admin:admin.
You can now access to Grafana GUI by entering http://127.0.0.1:3100 in your browser (Supposing you are on the same host you've installed Docker daemon).
Install Loki
As reminded by the official documentation, you can install Loki with Docker if you are evaluating, testing, or developing Loki. For production, Grafana recommends installing with Helm or Tanka.
Let's create a Loki configuration file.
$ cd && mkdir -p opentelemetry_demo/loki && cd opentelemetry_demo/loki
$ cat << EOF >> loki-config.yaml
auth_enabled: false

limits_config:
  allow_structured_metadata: true

server:
  http_listen_port: 3100
  grpc_listen_port: 9096

common:
  instance_addr: 127.0.0.1
  path_prefix: /tmp/loki
  storage:
    filesystem:
      chunks_directory: /tmp/loki/chunks
      rules_directory: /tmp/loki/rules
  replication_factor: 1
  ring:
    kvstore:
      store: inmemory

query_range:
  results_cache:
    cache:
      embedded_cache:
        enabled: true
        max_size_mb: 100

schema_config:
  configs:
    - from: 2020-10-24
      store: tsdb
      object_store: filesystem
      schema: v13
      index:
        prefix: index_
        period: 24h

ruler:
  alertmanager_url: http://localhost:9093

# By default, Loki will send anonymous, but uniquely-identifiable usage and configuration
# analytics to Grafana Labs. These statistics are sent to https://stats.grafana.org/
#
# Statistics help us better understand how Loki is used, and they show us performance
# levels for most users. This helps us prioritize features and documentation.
# For more information on what's sent, look at
# https://github.com/grafana/loki/blob/main/pkg/analytics/stats.go
# Refer to the buildReport method to see what goes into a report.
#
# If you would like to disable reporting, uncomment the following lines:
#analytics:
#  reporting_enabled: false
EOF
Now, you can launch the Loki container.
$ docker run -d \
--name loki \
--hostname=loki \
--network=lgtm \
-p 3100:3100 \
-v $(pwd):/mnt/config \
grafana/loki:3.0.0 \
-config.file=/mnt/config/loki-config.yaml
Now, we shoud have 2 running containers.
$ docker container ls
CONTAINER ID   IMAGE                        COMMAND                  CREATED          STATUS          PORTS                                       NAMES
1aabaf276d47   grafana/loki:3.0.0           "/usr/bin/loki -conf…"   4 minutes ago    Up 4 minutes    0.0.0.0:3100->3100/tcp, :::3100->3100/tcp   loki
66f1ae27487b   grafana/grafana-oss:10.0.0   "/run.sh"                17 minutes ago   Up 17 minutes   0.0.0.0:3000->3000/tcp, :::3000->3000/tcp   grafana
Docker driver client
For our demo, we want to fetch the Docker containers logs in Loki.
Grafana Loki officially supports a Docker plugin that will read logs from Docker containers and ship them to Loki.
$ docker plugin install grafana/loki-docker-driver:2.9.2 --alias loki --grant-all-permissions
We check installed plugin.
$ docker plugin ls
ID             NAME          DESCRIPTION           ENABLED
fe95f69f1fa3   loki:latest   Loki Logging Driver   true
Docker driver client configuration
The Docker daemon on each machine has a default logging driver and each container will use the default driver unless configured otherwise.
We want the Loki logging driver to be the default for all containers.
To do that, we change Docker’s daemon.json file (located in /etc/docker on Linux) and set the value of log-driver to loki.
{
  "debug": true,
  "log-driver": "loki",
  "log-opts": {
    "loki-url": "http://127.0.0.1:3100/loki/api/v1/push",
    "loki-batch-size": "400"
  }
}
Restart Docker daemon and its containers.
$ sudo systemctl restart docker.service
$ docker start grafana loki
$ docker container ls
Configure Grafana
Now, the next step is to link Grafana and Loki by adding a new datasource in Grafana.
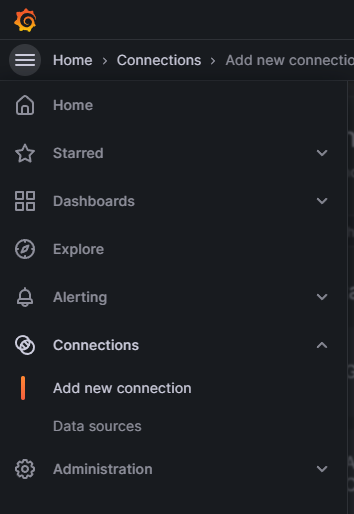
Log in to the Grafana GUI and select Connections > Add new connection on the to left sandwich menu.

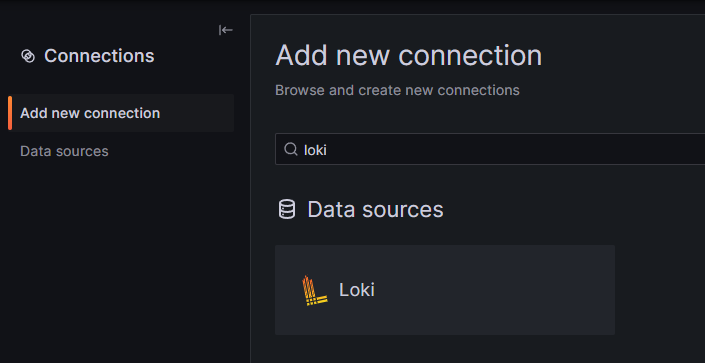
Search loki and select it.

Click on the top right button Create a Loki data source

Fill in these fields :
Keep the other fields by default.
And click on Save & test button.

Install NGINX demo container
To complete our evaluation, we lastly install Nginx in a Docker container.
$ docker run -d \
--name nginx \
--hostname=nginx \
--network=lgtm \
-p 8080:80 \
nginx
$ docker container ls
CONTAINER ID   IMAGE                        COMMAND                  CREATED             STATUS             PORTS                                       NAMES
1aabaf276d47   grafana/loki:3.0.0           "/usr/bin/loki -conf…"   About an hour ago   Up About an hour   0.0.0.0:3100->3100/tcp, :::3100->3100/tcp   loki
66f1ae27487b   grafana/grafana-oss:10.0.0   "/run.sh"                About an hour ago   Up About an hour   0.0.0.0:3000->3000/tcp, :::3000->3000/tcp   grafana
af126e05ad6b   nginx                        "/docker-entrypoint.…"   3 hours ago         Up 3 hours         0.0.0.0:8080->80/tcp, :::8080->80/tcp       nginx
And access to the default NGINX page to generate some logs
$ curl -sI http://localhost:8080
HTTP/1.1 200 OK
Server: nginx/1.27.0
Date: Thu, 18 Jul 2024 20:23:17 GMT
Content-Type: text/html
Content-Length: 615
Last-Modified: Tue, 28 May 2024 13:22:30 GMT
Connection: keep-alive
ETag: "6655da96-267"
Accept-Ranges: bytes
Where are my logs ?
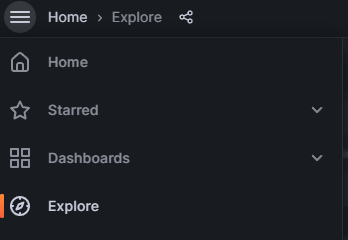
Go back to the Grafana GUI and click on Explore on sandwich menu.

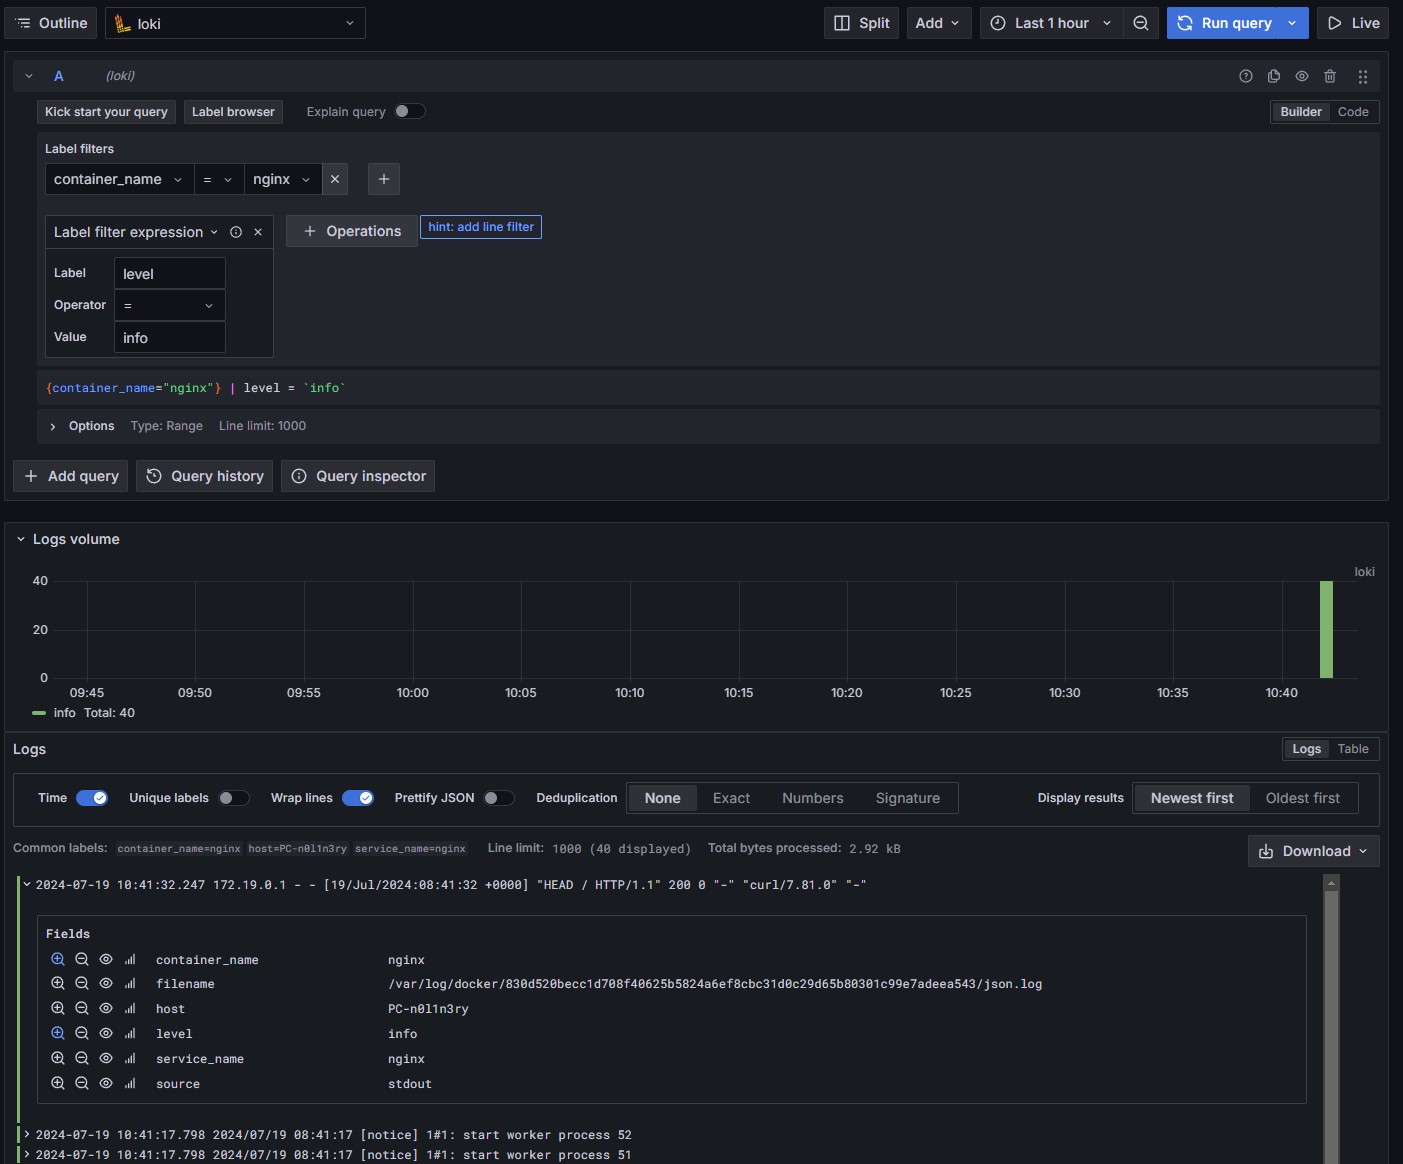
Please be careful that Loki is a selected datasource and run a query like this :

🏷️Loki does not index the contents of the logs, but rather a set of labels for each log stream.
All the Docker containers logs are now fetch by Loki and can be queried by Grafana using Prometheus syntax query 🎉
Subscribe to my newsletter
Read articles from Bruno directly inside your inbox. Subscribe to the newsletter, and don't miss out.
Written by

Bruno
Bruno
Depuis août 2024, j'accompagne divers projets sur l'optimisation des processus DevOps. Ces compétences, acquises par plusieurs années d'expérience dans le domaine de l'IT, me permettent de contribuer de manière significative à la réussite et l'évolution des infrastructures de mes clients. Mon but est d'apporter une expertise technique pour soutenir la mission et les valeurs de mes clients, en garantissant la scalabilité et l'efficacité de leurs services IT.