Day 74 - Connecting EC2 with Grafana 🎉
 Nilkanth Mistry
Introduction 📊
Monitoring the performance of your server infrastructure is crucial for ensuring optimal operation and identifying potential issues. In this tutorial, we'll explore how to set up Grafana and Prometheus to monitor CPU usage on Ubuntu instances. Grafana provides a powerful visualization interface, while Prometheus collects and stores metrics.
Prerequisites 📋
Before we begin, make sure you have:
Two Ubuntu instances running on your preferred cloud provider (e.g., AWS, Azure).
SSH access to both instances.
Basic knowledge of Ubuntu commands and Prometheus/Grafana.
Step-by-Step Guide 🛠️
Step 1: Launch Ubuntu Instances on AWS ☁️
Login to AWS Management Console:
Navigate to the AWS Management Console. 🌐
Select the region where you want to launch your instances. 🌍
Launch First Ubuntu EC2 Instance:
Go to the EC2 Dashboard. 📊
Click on Launch Instance. 🚀
Choose an Ubuntu AMI (e.g., Ubuntu Server 20.04 LTS). 🐧
Select the Instance Type (e.g.,
t2.microfor free tier). 💡Configure the instance details and add storage as needed. 📦
Add a tag for easier identification (e.g.,
Name: Grafana-Server). 🏷️Configure the security group to allow HTTP (port 80) and Grafana (port 3000). 🔐
Review and Launch the instance. 🎉
Launch Second Ubuntu EC2 Instance:
- Repeat the steps above, but add a tag like
Name: Prometheus-Serverand ensure the security group allows Prometheus (port 9090). 🔐
- Repeat the steps above, but add a tag like
Step 2: Install Grafana on the First Ubuntu Instance 🐧
Connect to your Grafana Instance:
Use SSH to connect to your Grafana instance:
ssh -i your-key.pem ubuntu@your-grafana-instance-public-ip
Install Grafana:
Update the system and install required packages:
  sudo apt-get update
  sudo apt-get install -y software-properties-common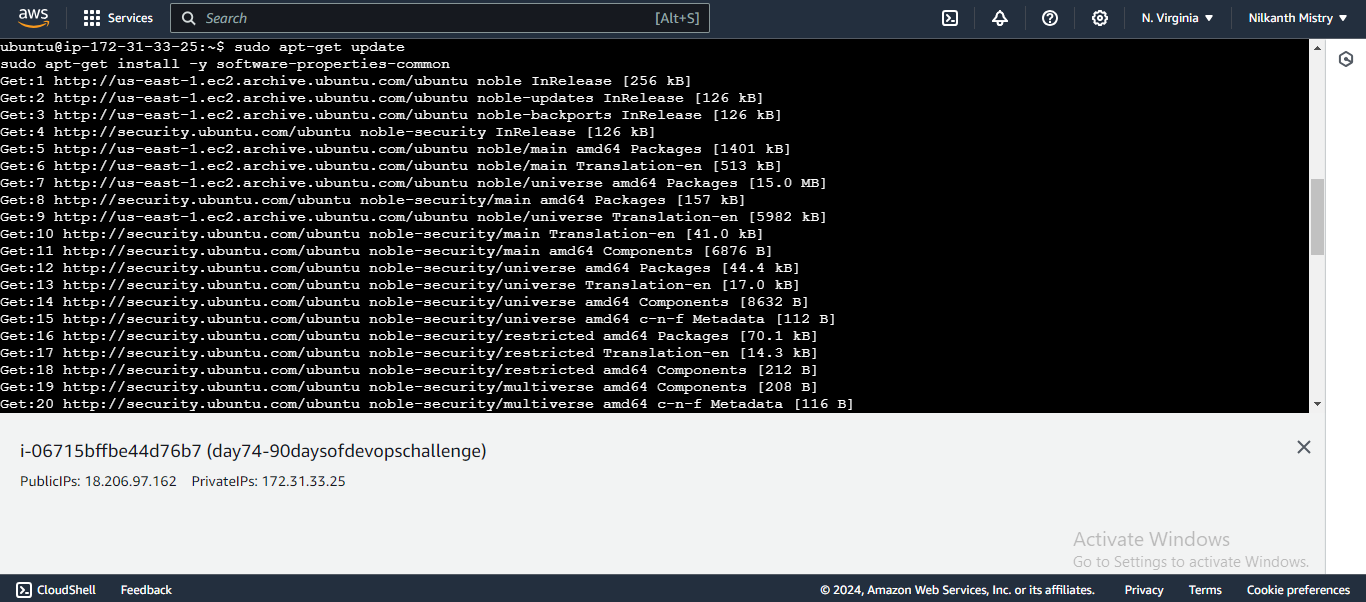
Add the Grafana APT repository and its GPG key:
  sudo add-apt-repository "deb https://packages.grafana.com/oss/deb stable main"
  wget -q -O - https://packages.grafana.com/gpg.key | sudo apt-key add -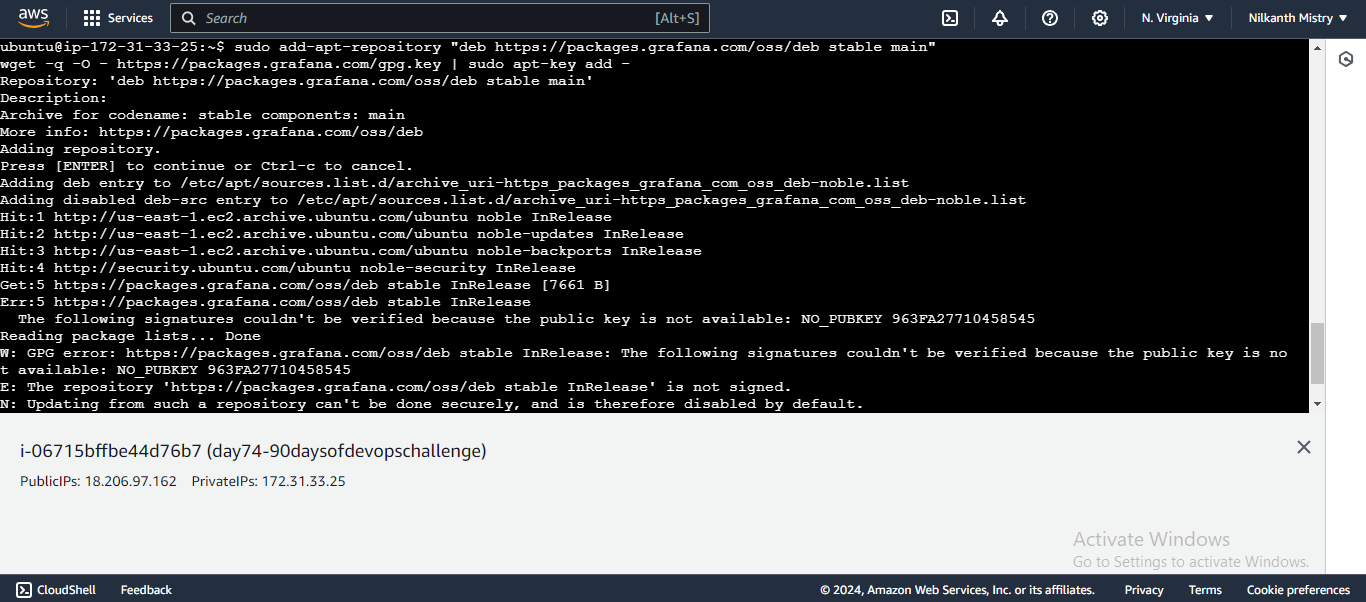
Install Grafana:
  sudo apt-get update
  sudo apt-get install -y grafana
  sudo systemctl enable grafana-server
  sudo systemctl start grafana-server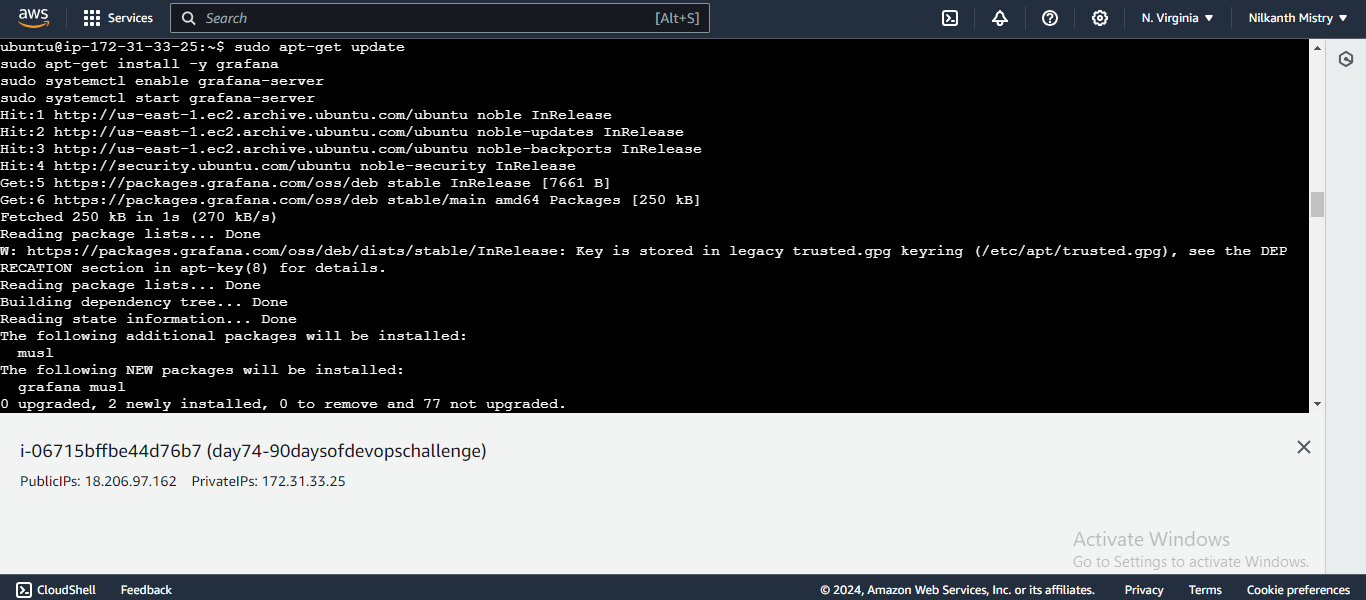
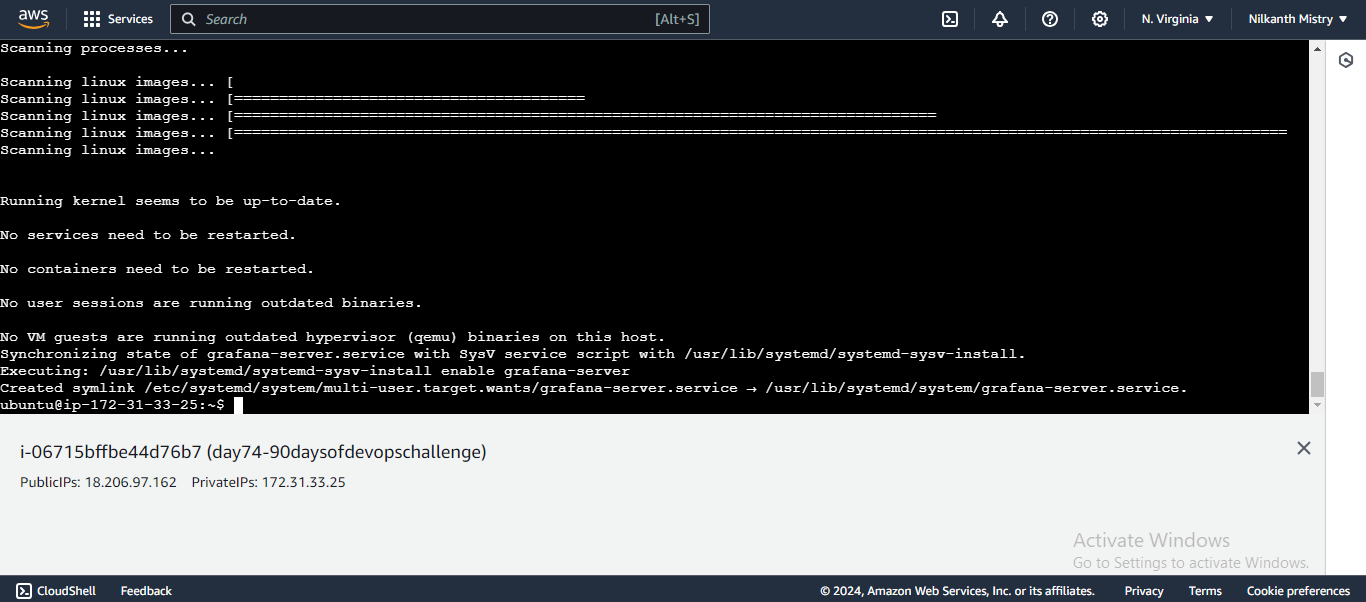
Access Grafana by navigating to
http://<your-grafana-instance-ip>:3000in your browser, using the default login credentials (admin/admin). 🌐🔑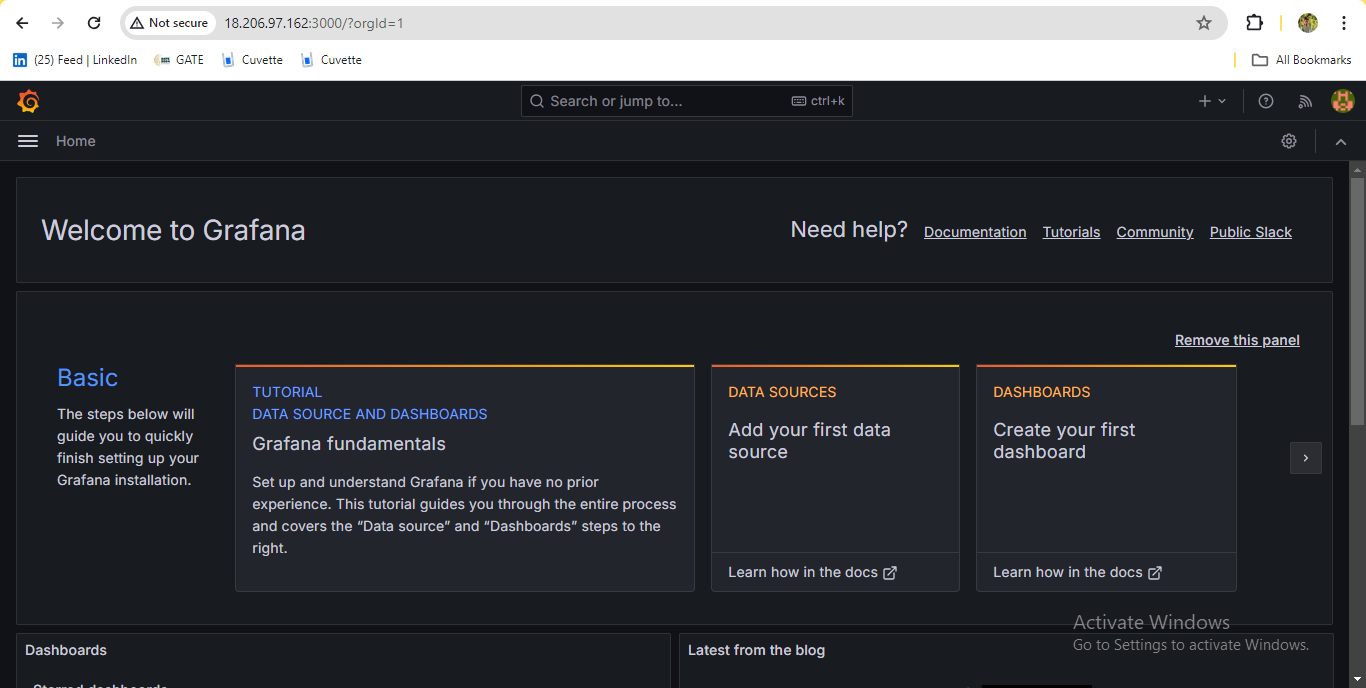
Step 3: Install Prometheus on the Second Ubuntu Instance 🐧
Connect to your Prometheus Instance:
Use SSH to connect to your Prometheus instance:
ssh -i your-key.pem ubuntu@your-prometheus-instance-public-ip
Install Prometheus:
Update the system and install Prometheus:
  sudo apt-get update
  sudo apt-get install -y prometheus
  sudo systemctl enable prometheus
  sudo systemctl start prometheus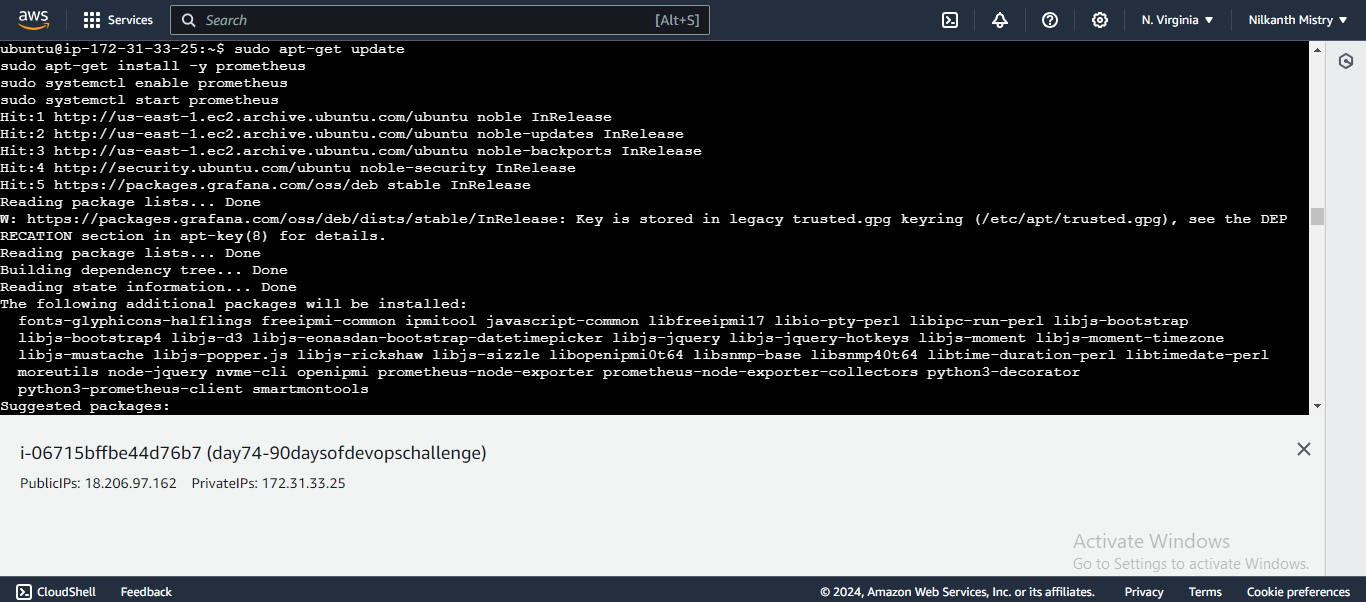
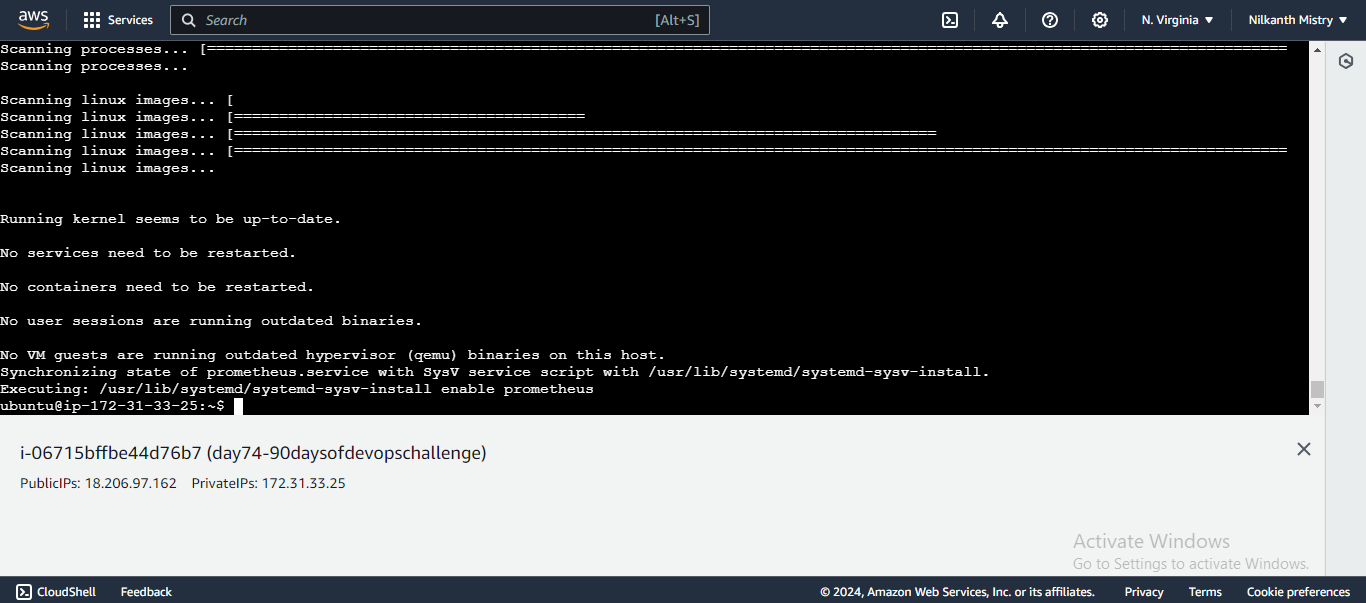
Step 4: Configure Prometheus as a Data Source in Grafana 📈
Log in to Grafana:
- Open your Grafana instance in a web browser. 🌐
Add Prometheus Data Source:
Navigate to Settings > Data Sources. ⚙️
Click on Add your first data source. ➕
Choose Prometheus and enter the IP address of the second Ubuntu instance (e.g.,
http://<your-prometheus-instance-ip>:9090). 🌐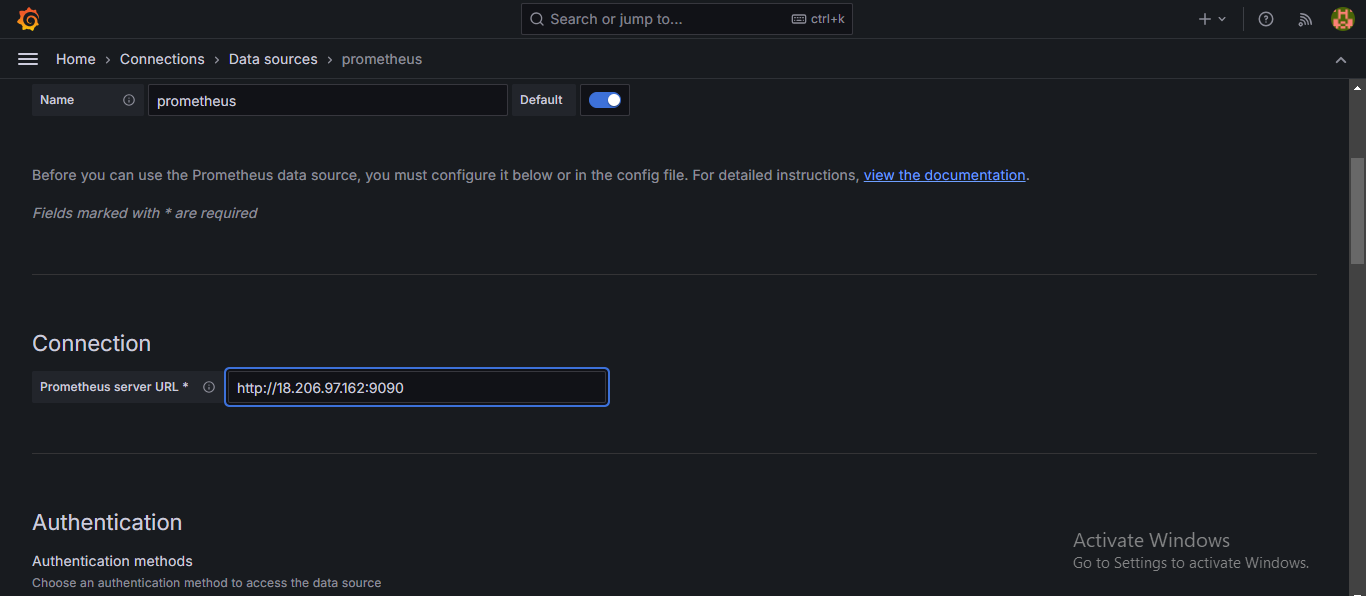
Click Save & Test to verify the connection. ✅
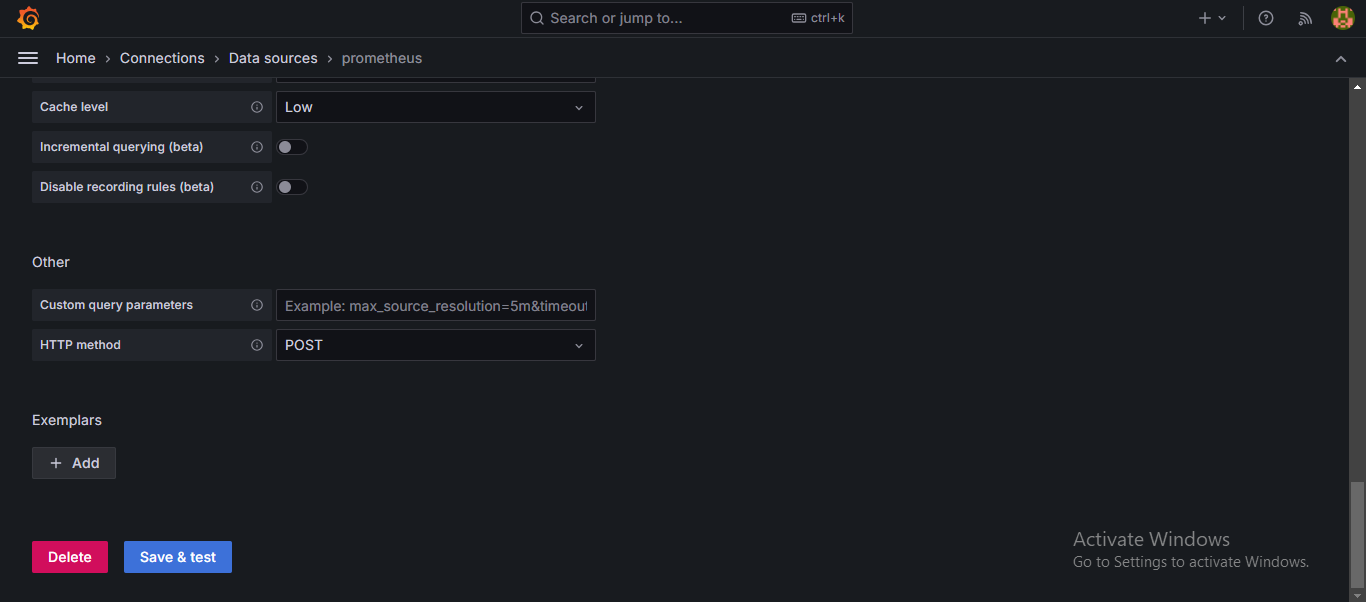
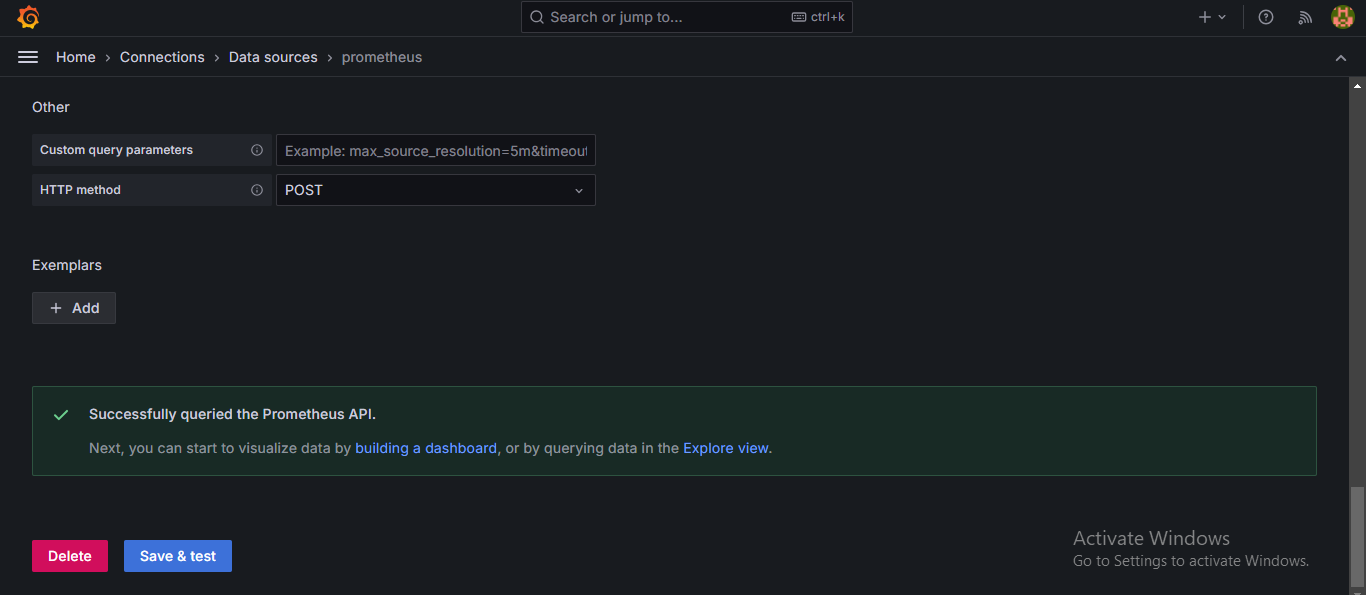
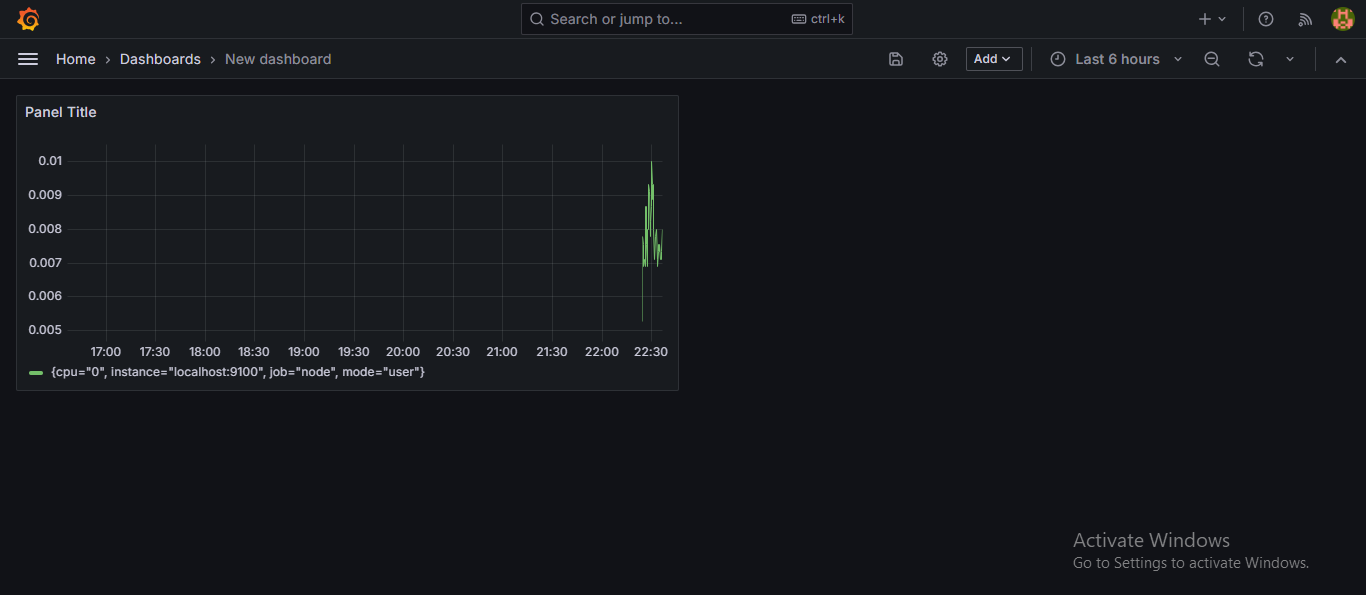
Step 5: Create CPU Usage Dashboard in Grafana 📊
Create a New Dashboard:
- In Grafana, go to the
+menu on the left sidebar and choose Dashboard. ➕
- In Grafana, go to the
Add a New Panel:
Click on Add new panel. ➕
Select the Prometheus data source. 🔍
Enter Query for CPU Usage:
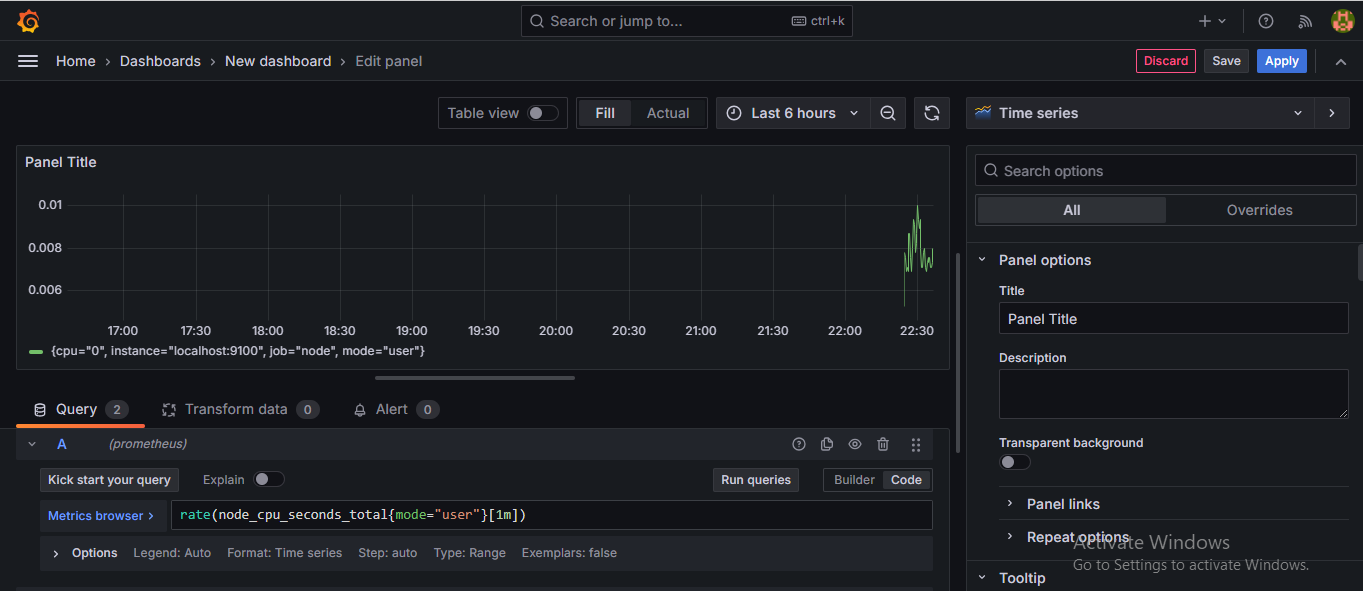
Use the following query to monitor user CPU usage:
rate(node_cpu_seconds_total{mode="user"}[1m])
Configure Visualization Settings:
Customize the visualization settings as needed. 🎨
Click Apply to save the panel. 💾
Step 6: Explore and Analyze Metrics 🔍
Explore the Grafana Dashboard:
Navigate through the Grafana dashboard to visualize and analyze CPU usage metrics from both Ubuntu instances. 📈
Customize panels and queries based on your monitoring requirements. 🛠
Conclusion 🎉
Setting up Grafana and Prometheus on Ubuntu allows you to efficiently monitor CPU usage and other system metrics. This tutorial provides a basic configuration, and you can expand on it to include additional metrics and visualizations according to your specific needs.
Thank you for reading! 🙏
By following these steps, you'll be able to monitor your Ubuntu instances using Grafana and Prometheus, ensuring optimal performance and quick issue detection. Don't forget to share your progress and tag us on LinkedIn! 📢
Happy Learning! 😊
Subscribe to my newsletter
Read articles from Nilkanth Mistry directly inside your inbox. Subscribe to the newsletter, and don't miss out.
Written by

Nilkanth Mistry
Nilkanth Mistry
Embark on a 90-day DevOps journey with me as we tackle challenges, unravel complexities, and conquer the world of seamless software delivery. Join my Hashnode blog series where we'll explore hands-on DevOps scenarios, troubleshooting real-world issues, and mastering the art of efficient deployment. Let's embrace the challenges and elevate our DevOps expertise together! #DevOpsChallenges #HandsOnLearning #ContinuousImprovement