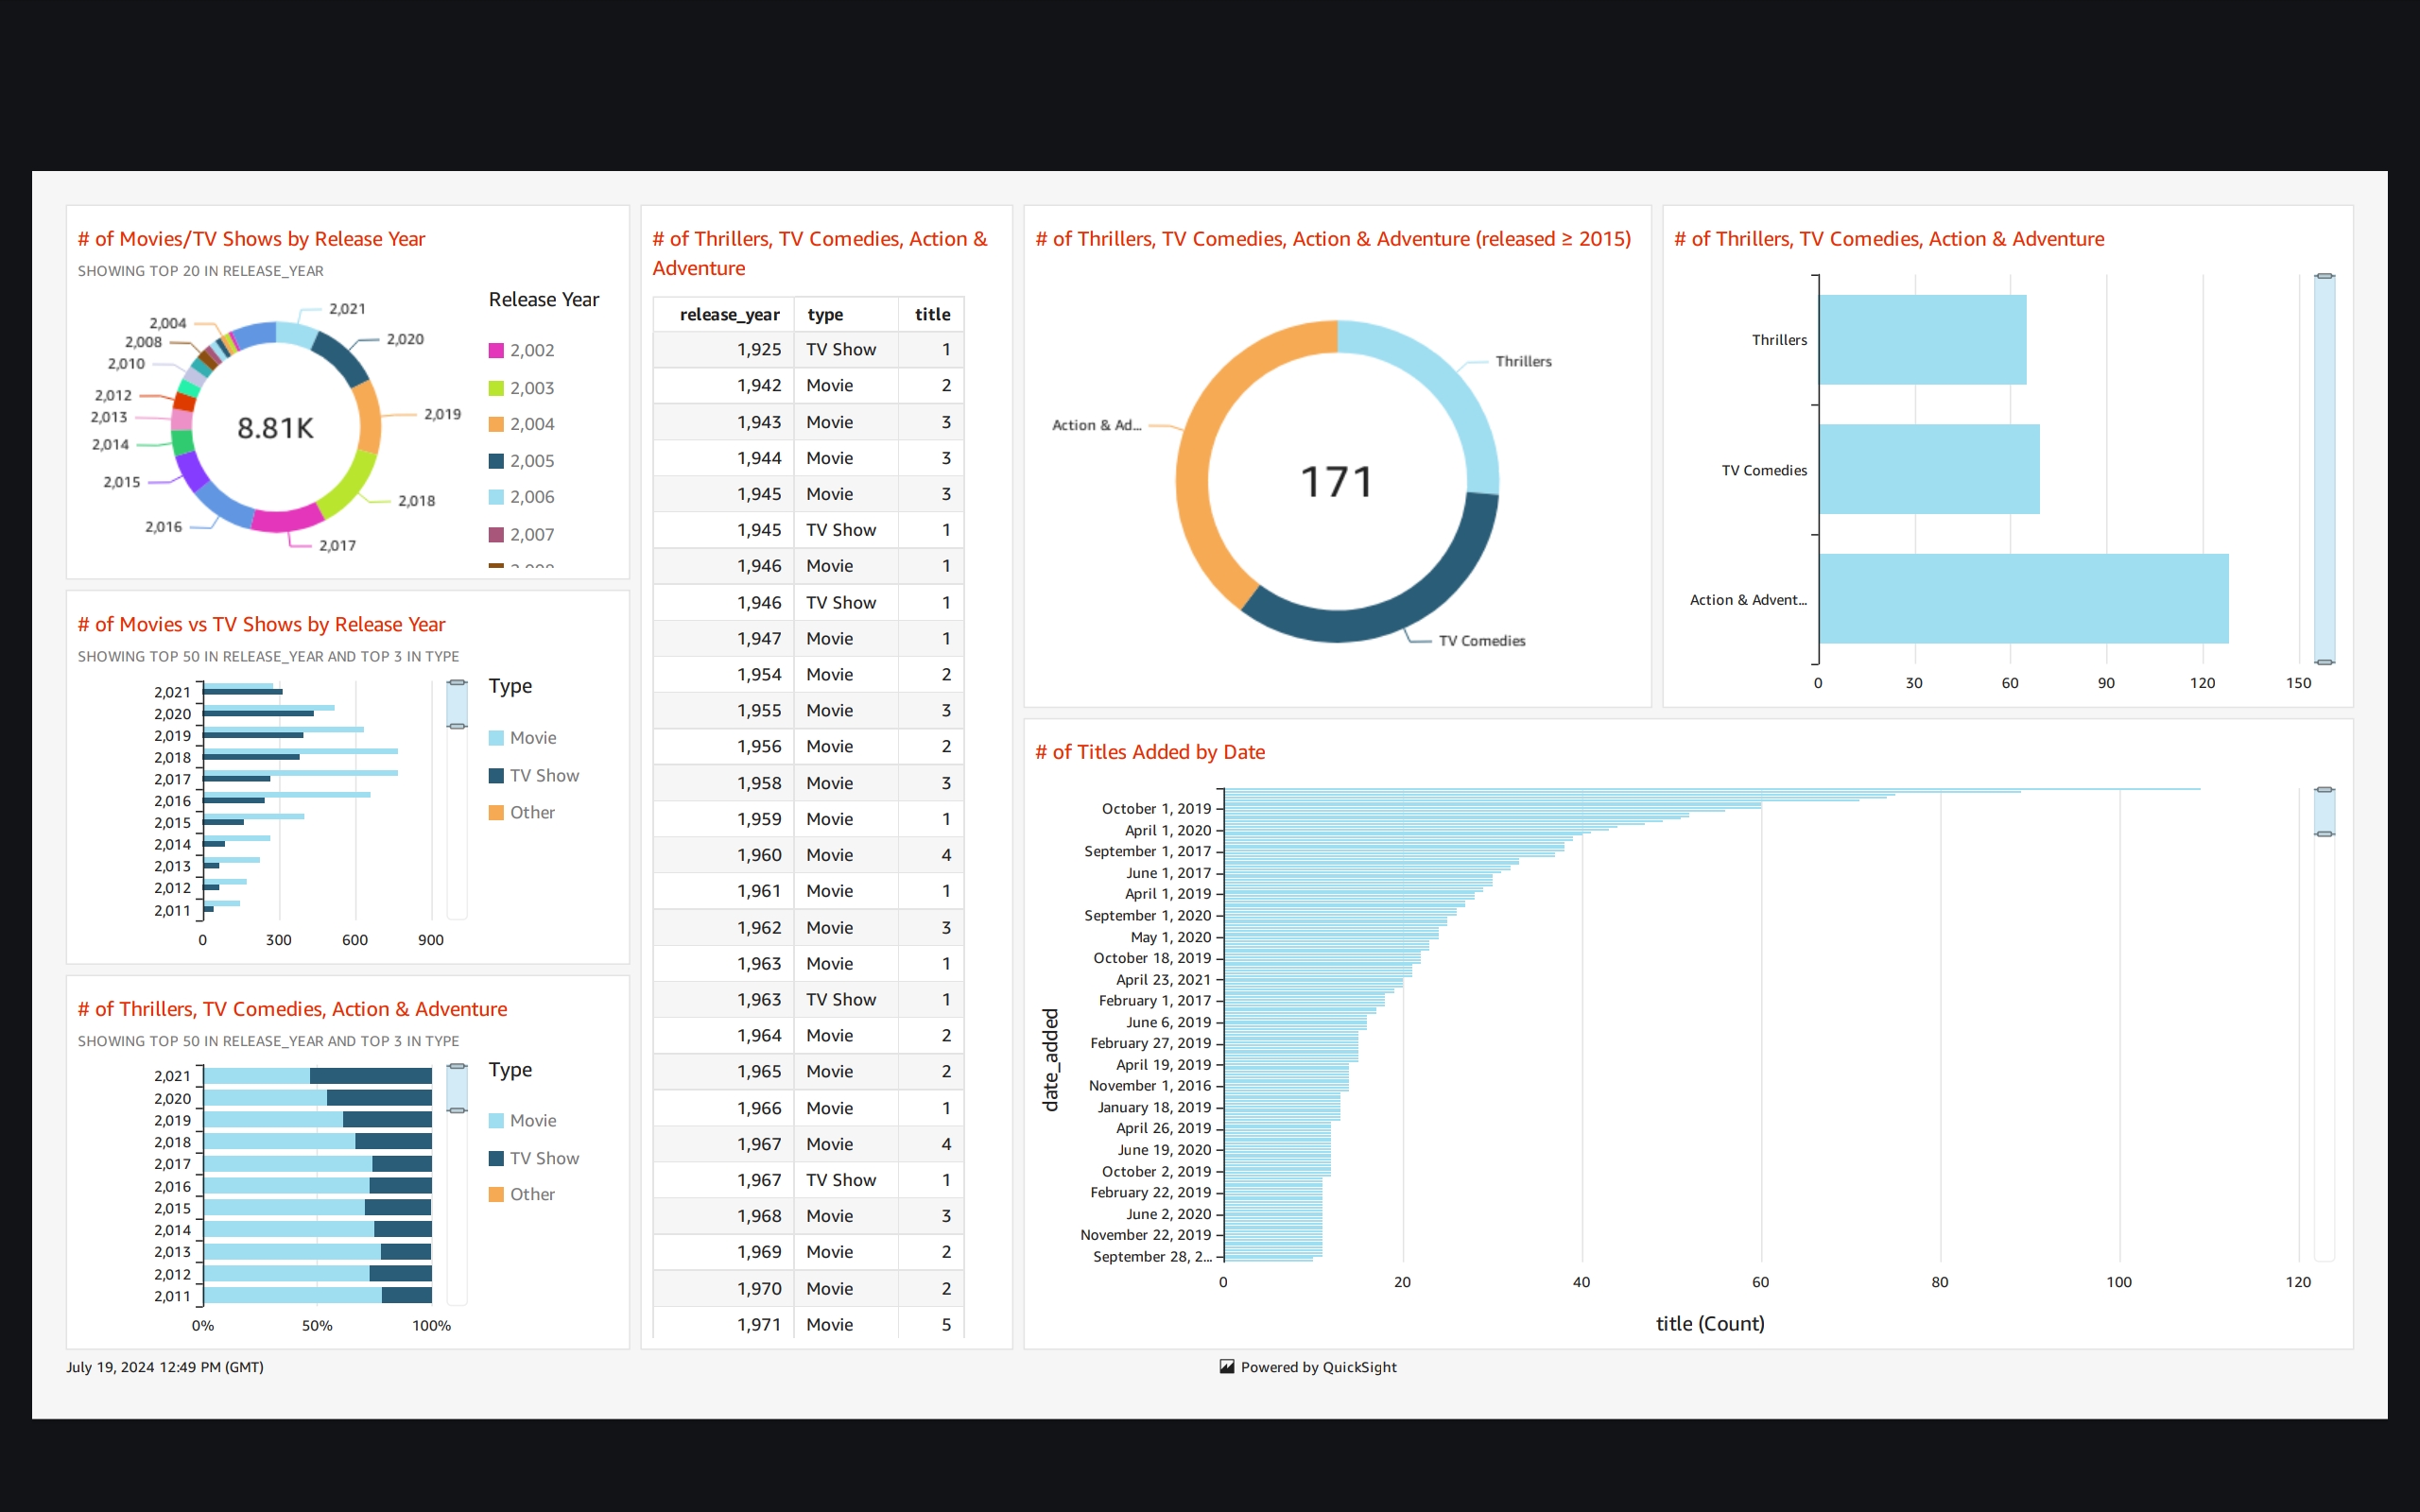
Project #2: Visualize Netflix Data using Amazon QuickSight
 Mohammed Zubair
Here's how I used Amazon QuickSight to visualize Netflix's catalogue trends 📊
🔍 Throughout this AWS project, I learned how to:
✅ Upload and store datasets in Amazon S3.
✅ Connect datasets to Amazon QuickSight for analysis.
✅ Create visualizations like donut charts, bar graphs, and tables.
✅ Answer complex data questions using QuickSight's functionalities.
🌟 The highlight of the project was putting all of these visualizations into one big dashboard - so satisfying to see them work together.
💼 This hands-on experience not only enhanced my AWS skills but also sharpened my data visualization and analysis capabilities, essential in today's data-driven world.
🙏 Special thanks to NextWork for providing this project guide and making it a fun experience!
📢 Interested in learning more about AWS and data analytics? Let's connect and chat!
#AWS #DataAnalytics #AmazonQuickSight #DashboardDesign #DataVisualisation
Subscribe to my newsletter
Read articles from Mohammed Zubair directly inside your inbox. Subscribe to the newsletter, and don't miss out.
Written by
