Debugging Techniques in JavaScript: Common Bugs and How to Resolve Them
 Gunjan Arora
Introduction
Debugging is an essential skill for every JavaScript developer. Encountering bugs is inevitable, but knowing how to effectively identify and resolve them can save time and reduce frustration. This blog explores common bugs and essential debugging techniques to help you become more proficient in troubleshooting your JavaScript code.
1. Console Logging

One of the simplest yet most effective debugging techniques is console logging. Using console.log(), you can print variable values and track the flow of code execution. This method allows you to quickly check the state of your variables and identify where things might be going wrong.
Example:
let x = 10;
console.log(x); // Output: 10
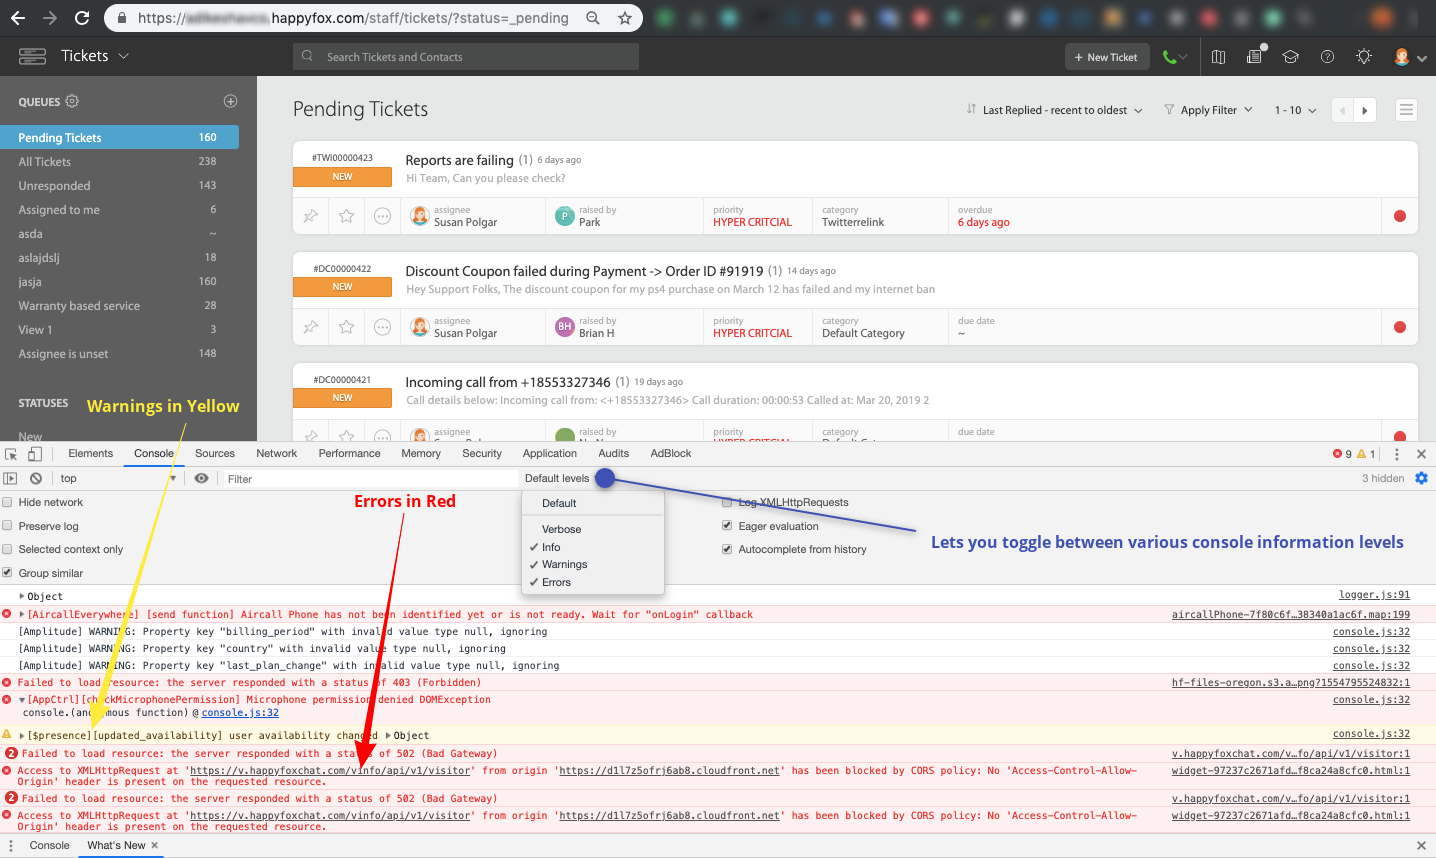
Accessing the Browser Console and Network Logs
Most browsers provide easy access to the console via developer tools, usually accessible through F12 or Ctrl+Shift+I. Beyond console.log(), methods like console.error(), console.warn(), and console.table() can provide more context and structure to your logged information.
2. Browser Developer Tools

Modern browsers come equipped with powerful developer tools, such as Chrome DevTools, that provide a suite of features for inspecting and debugging code. These tools allow you to view the DOM, monitor network requests, and analyze performance, making them invaluable for debugging.
Key Features:
Elements: Inspect and modify HTML and CSS.
Console: Execute JavaScript and view logs.
Sources: Debug JavaScript with breakpoints and watch variables.
Network: Monitor network activity and performance.
Performance: Analyze runtime performance and identify bottlenecks.
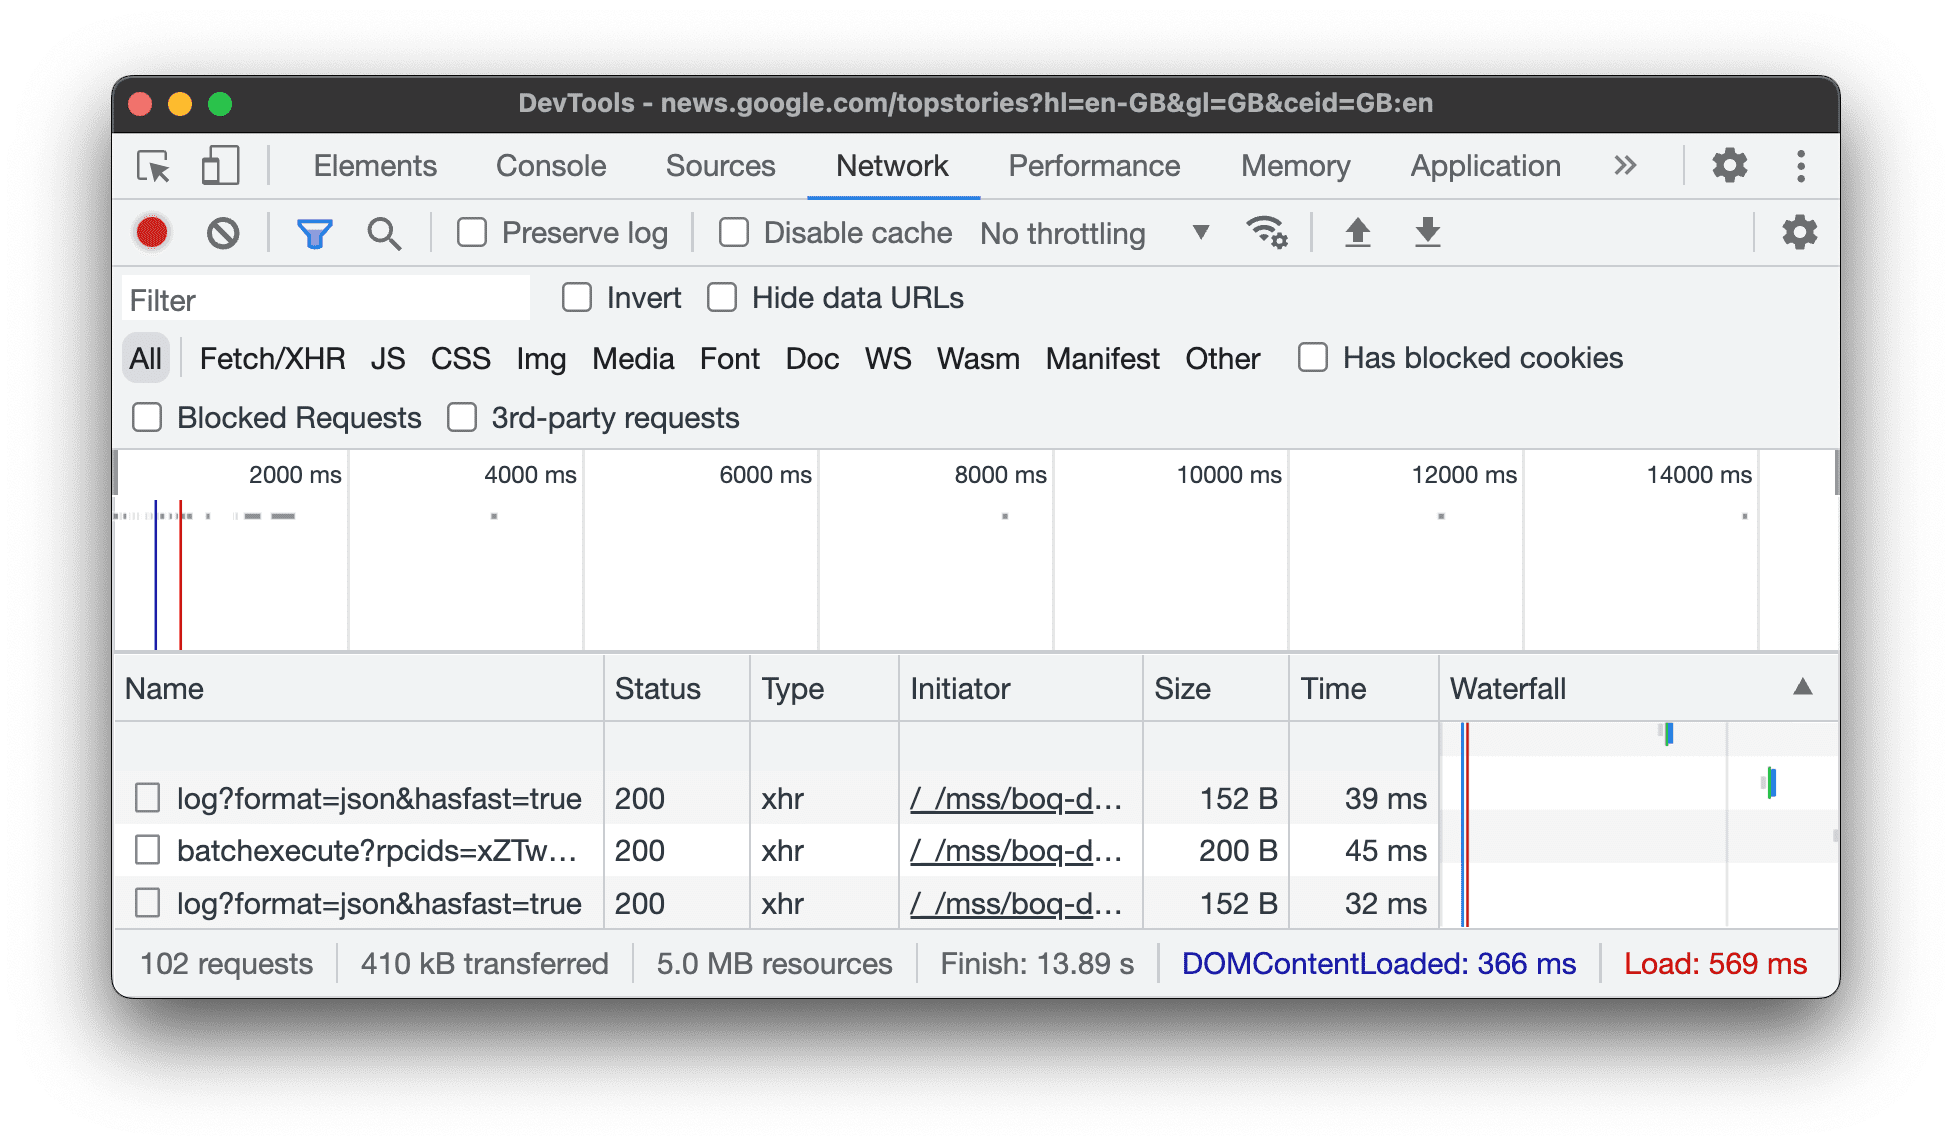
Network Features in Chrome DevTools
The Network panel in Chrome DevTools allows you to monitor all network requests made by your page. You can see details about each request, including status codes, request and response headers, and timing information. This can be crucial for diagnosing issues related to data fetching and API interactions.
3. Breakpoints

Breakpoints are a powerful feature in browser developer tools that allow you to pause code execution at specific points. By setting breakpoints, you can inspect the current state of variables, step through code line by line, and gain a deeper understanding of how your code is executing.
How to Set a Breakpoint:
Open the Sources panel in Chrome DevTools.
Navigate to the desired JavaScript file.
Click the line number where you want to set the breakpoint.
Setting a Breakpoint in Chrome DevTools
Once a breakpoint is set, you can control the execution flow using the buttons for stepping over, into, or out of functions, continuing execution, or pausing again when the next breakpoint is hit.
4. Error Handling
Proper error handling can prevent your application from crashing and provide meaningful feedback to users. Using try...catch blocks allows you to handle errors gracefully and take appropriate actions when exceptions occur.
Example:
try {
  let result = riskyOperation();
} catch (error) {
  console.error('An error occurred:', error);
}
Best Practices for Error Handling
Catch Specific Errors: Instead of a general
catch, handle specific error types to provide more precise recovery actions.Use Finally: The
finallyblock can be used to execute code that should run regardless of whether an error occurred or not, such as cleanup tasks.
5. Debugger Statement

The debugger statement is a powerful tool that can pause code execution and invoke debugging tools directly from your code. When the debugger statement is encountered, execution stops, allowing you to inspect variables and step through code.
Example:
let y = 20;
debugger;
console.log(y); // Execution will pause here
Using the Debugger Statement in Chrome DevTools
The debugger statement is particularly useful during development, allowing you to programmatically set breakpoints without needing to manually open the developer tools and find the relevant line of code.
6. Linting Tools

Linting tools, such as ESLint, help catch syntax errors and enforce coding standards before your code runs. By integrating a linter into your development workflow, you can identify potential issues early and ensure your code adheres to best practices.
Example Configuration (ESLint):
{
  "env": {
    "browser": true,
    "es2021": true
  },
  "extends": "eslint:recommended",
  "parserOptions": {
    "ecmaVersion": 12,
    "sourceType": "module"
  },
  "rules": {
    "no-unused-vars": "warn",
    "no-console": "off"
  }
}
Benefits of Using Linting Tools
Consistency: Ensure code follows a consistent style and standards.
Error Prevention: Catch common coding errors and potential bugs early.
Code Quality: Maintain high-quality, readable, and maintainable code.
7. Testing
Writing unit tests is a proactive way to catch bugs early in the development process. Using testing frameworks like Jest, you can write tests to verify that your code behaves as expected, making it easier to identify and fix bugs before they reach production.
Example Test (Jest):
const sum = (a, b) => a + b;

test('adds 1 + 2 to equal 3', () => {
  expect(sum(1, 2)).toBe(3);
});
Types of Testing
Unit Testing: Test individual functions or components in isolation.
Integration Testing: Test the interaction between different parts of your application.
End-to-End Testing: Simulate user interactions and test the application as a whole.
8. Common Bugs

Understanding common JavaScript bugs can help you recognize and resolve issues more quickly. Here are a few examples:
Undefined Variables
Ensure variables are declared and initialized before use.
Scope Issues
Understand variable scope and closures to avoid unexpected behavior.
Type Errors
Verify data types and use type-checking tools like TypeScript to catch type-related bugs.
Debugging Common Bugs
Use Descriptive Variable Names: This makes it easier to understand what the variable is supposed to represent.
Keep Functions Short: Smaller functions are easier to test and debug.
Write Clear Comments: Commenting your code helps you and others understand its purpose and logic.
9. Advanced Debugging Techniques
Conditional Breakpoints
Sometimes you want to pause execution only when certain conditions are met. Conditional breakpoints allow you to specify an expression that must be true for the breakpoint to be triggered.
How to Set Conditional Breakpoints:
Right-click on a breakpoint in Chrome DevTools.
Select "Edit breakpoint...".
Enter the condition and save.
Blackboxing Scripts
Blackboxing allows you to ignore specific scripts during debugging, such as third-party libraries, to focus on your own code.
How to Blackbox a Script:
Open the Sources panel in Chrome DevTools.
Right-click on the file you want to blackbox.
Select "Blackbox script".
Performance Profiling
Performance profiling helps identify performance bottlenecks in your code. Using the Performance panel in Chrome DevTools, you can record the execution of your application and analyze the results.
10. Debugging Asynchronous Code
Debugging asynchronous code, such as Promises and async/await, can be challenging. Understanding how to trace asynchronous operations and using tools like async call stacks in Chrome DevTools can help.
Example:
async function fetchData() {
  try {
    let response = await fetch('https://api.example.com/data');
    let data = await response.json();
    console.log(data);
  } catch (error) {
    console.error('Fetch error:', error);
  }
}

fetchData();
Tracing Asynchronous Code
Async Call Stacks: Enable async call stacks in Chrome DevTools to see the chain of asynchronous calls.
Promise Rejection Handling: Use
catchblocks andPromise.allSettledto handle rejected promises gracefully.
Conclusion
Mastering these debugging techniques will significantly improve your efficiency and code quality as a JavaScript developer. From simple console logging to leveraging sophisticated browser developer tools and implementing robust error handling, each technique plays a vital role in the debugging process. By proactively addressing common bugs and integrating linting and testing into your workflow, you can develop more reliable and maintainable JavaScript applications. Embrace these practices, and debugging will become a powerful tool rather than a source of frustration.
Subscribe to my newsletter
Read articles from Gunjan Arora directly inside your inbox. Subscribe to the newsletter, and don't miss out.
Written by

Gunjan Arora
Gunjan Arora
I’m a passionate web developer with a focus on frontend technologies. With expertise in React.js, HTML, CSS, and modern JavaScript frameworks, I build dynamic and user-centric web applications. I’m dedicated to following best practices in coding, performance optimization, and responsive design to create seamless and engaging user experiences. Always eager to learn and stay updated with industry trends, I share my knowledge through insightful articles and practical tips to help fellow developers excel in their craft. Let’s connect and explore the ever-evolving world of web development together!