Integrating Elasticsearch and Kibana with Your .NET Application
 Bilge Pamukcu
In this article, I'll show you how I connected a .NET app to Elasticsearch and Kibana using Docker Compose. Please follow the steps listed below to create the demo yourself.
Docker Configuration
Create a docker-compose.yml file.
We want our services to work on the same network. To do this, add a network to the Docker Compose file. In my case, I created a default bridge network and named it "elsk_net."

- Create a volume to ensure data persistence. I created the "elasticsearch_data" volume for the demo.

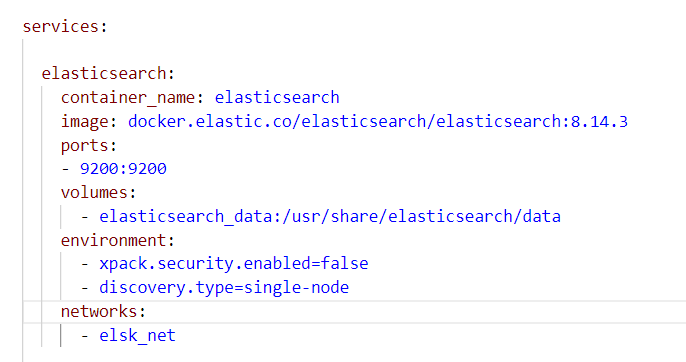
Now it's time to delve into creating our services. Add Elasticsearch instance configuration in the docker-compose file. In my case, I named the container "elasticsearch", specified the URL where the docker engine will pull the container image from, set the ports, used the previously defined volume, added the container into my bridge network. configured some environment variables.
I also configured some environment variables. Started with disabling the basic authentication by setting the environment variable "xpack.security.enabled" to false. I also set "discovery.type" variable to "single-node" to help Elasticsearch and Kibana instances smoothly in a single node.
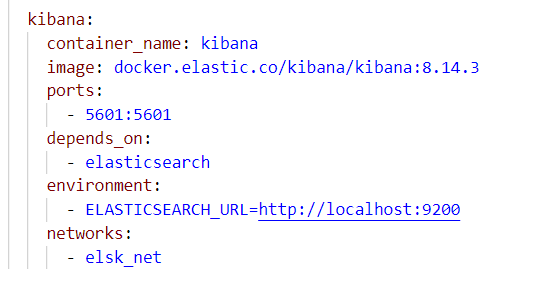
- It's time to add the Kibana instance which works as a visualizer for the Elasticsearch instance. Add the necessary configuration as shown below. The environment variable "ELASTICSEARCH_URL" is important here because Kibana requires accessing an Elasticsearch instance to run properly.
- The complete "docker-compose.yml" file looks as follows.
services:
  elasticsearch:
    container_name: elasticsearch
    image: docker.elastic.co/elasticsearch/elasticsearch:8.14.3
    ports:
    - 9200:9200
    volumes:
      - elasticsearch_data:/usr/share/elasticsearch/data
    environment:
      - xpack.security.enabled=false
      - discovery.type=single-node
    networks:
      - elsk_net

  kibana:
    container_name: kibana
    image: docker.elastic.co/kibana/kibana:8.14.3
    ports:
      - 5601:5601
    depends_on:
      - elasticsearch
    environment:
      - ELASTICSEARCH_URL=http://localhost:9200
    networks:
      - elsk_net

networks:
  elsk_net:
    driver: bridge

volumes:
  elasticsearch_data:
- Open the terminal and open the folder that contains the docker-compose.yml file in the terminal. Type and run the "
docker compose up" command to create Elasticsearch and Kibana instances.
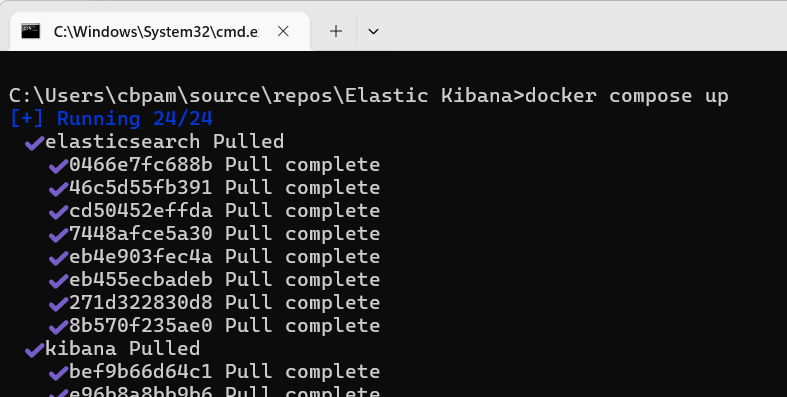
- This is what it looks like in Docker Desktop once the containers are up and running.

- To check the health of the Elasticsearch, open "http://localhost:<elasticsearch_port_number>" in your browser. It displays a JSON object that summarizes basic Elasticsearch features and configuration as shown in the below image.

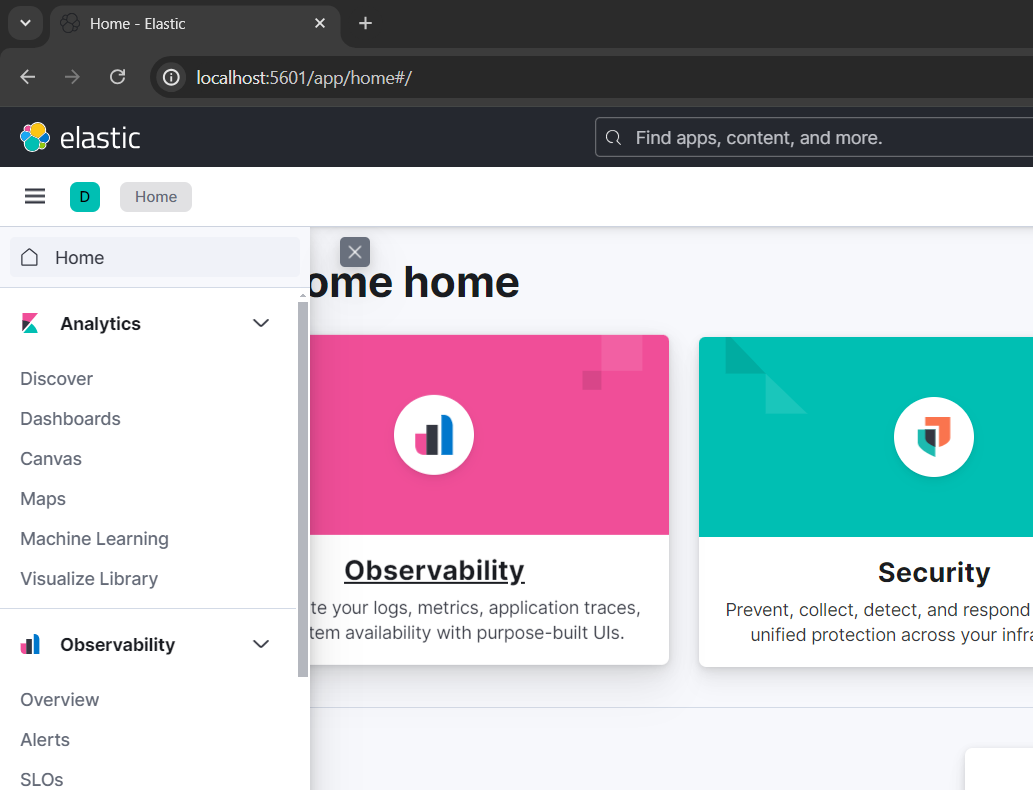
- To open the UI of the Kibana instance, browse "http://localhost.<kibana_port>" and ensure that it opens up a page that looks as follows.
Binding the .NET Application
- Open a terminal window and create a .NET Core Web API by running the "
dotnet new webapi --use-controllers" command.
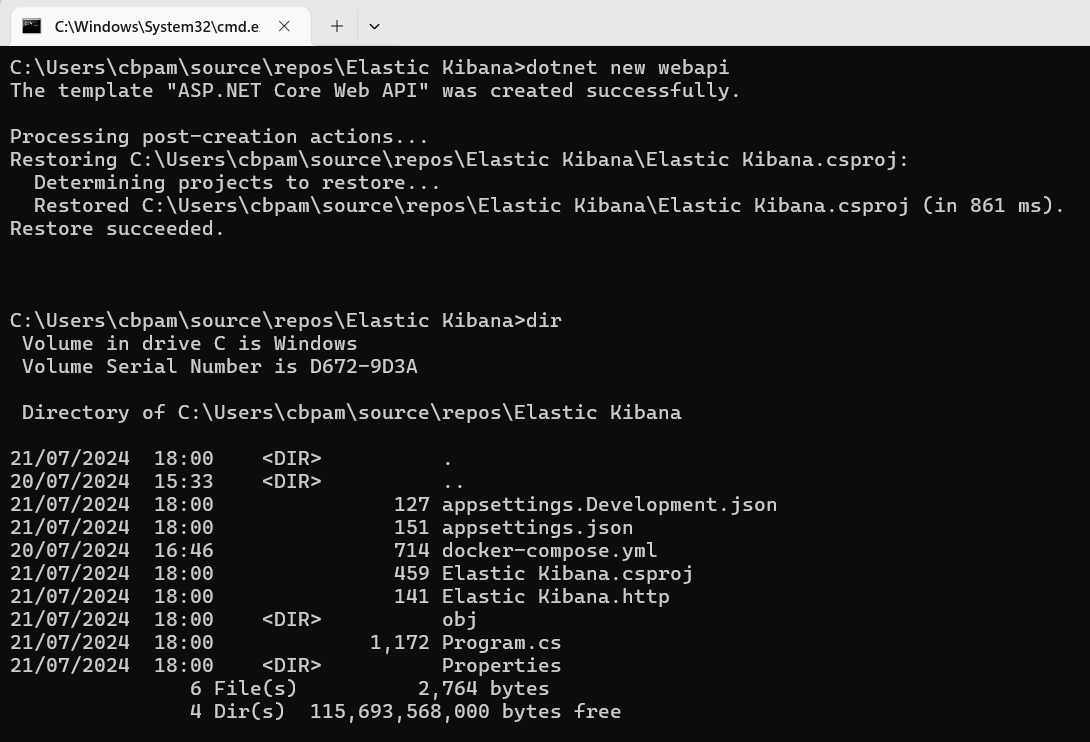
We'll use Serilog as the logging library. We'll set Serilog-specific logging configuration and use sinks to help us write event logs to various storage formats. To use Serilog, add the below listed NuGet packages that will allow us to display logs at different places and in various sinks.
dotnet add packageSerilog.AspNetCore: This package routes ASP.NET Core log messages through Serilog.dotnet add packageSerilog.Enrichers.Environment: This enriches the logs with information from the execution environment.dotnet add packageSerilog.Sinks.Console: A Serilog sink that writes log events to the Windows Console.dotnet add packageSerilog.Sinks.Debug: A Serilog sink that writes log events to the Visual Studio debug output window.dotnet add packageSerilog.Sinks.Elasticsearch: This sink delivers the data to Elasticsearch, a NoSQL search engine.dotnet add packageSerilog.Settings.Configuration: A Serilog settings provider that reads from the appsettings.json file.
This is how my project file looks after adding the packages.
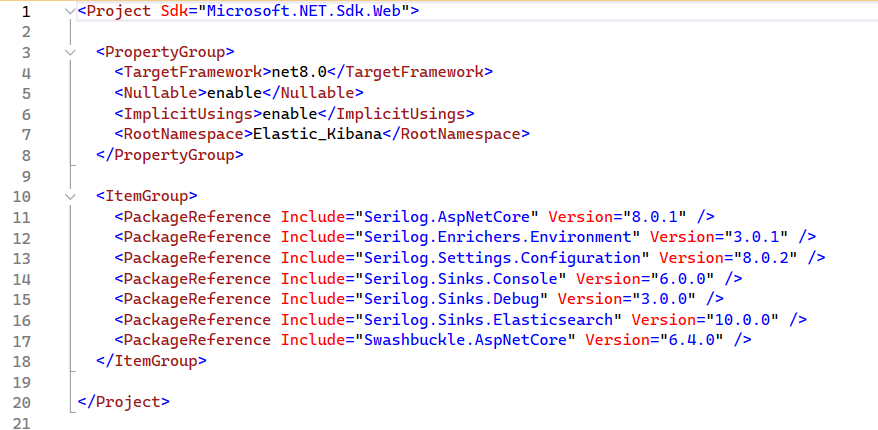
Add Serilog configuration in appsettings.json.
  "Serilog": {
    "MinimumLevel": {
      "Default": "Information",
      "Override": {
        "Microsoft": "Information",
        "System": "Error"
      }
    }
  }
- Open Program.cs file to configure Serilog. Add the code below that adds both the console and debug sinks and creates the logger.
Log.Logger = new LoggerConfiguration()
                .Enrich.FromLogContext()
                .WriteTo.Console()
                .WriteTo.Debug()
                .CreateLogger();
- In the Program.cs file, inject Serilog in services.
builder.Services.AddSerilog();
Open the default Weather Forecast controller (comes with the Asp.Net Core template by default). Add a try-cache block. Inside the try block, add an Information log, throw an exception, and add an error log in the catch block. The intention is to see if Serilog writes the Information and Error log both in the Console window and the Debug window.
In my case, the controller code looks like the image below.
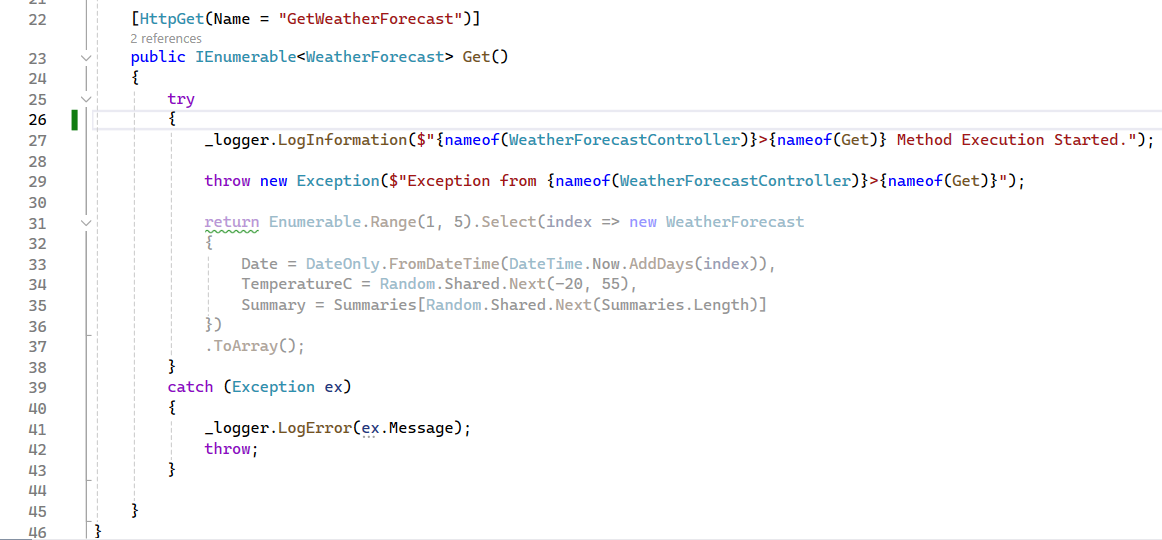
Run the application and hit the WeatherForecest get method.
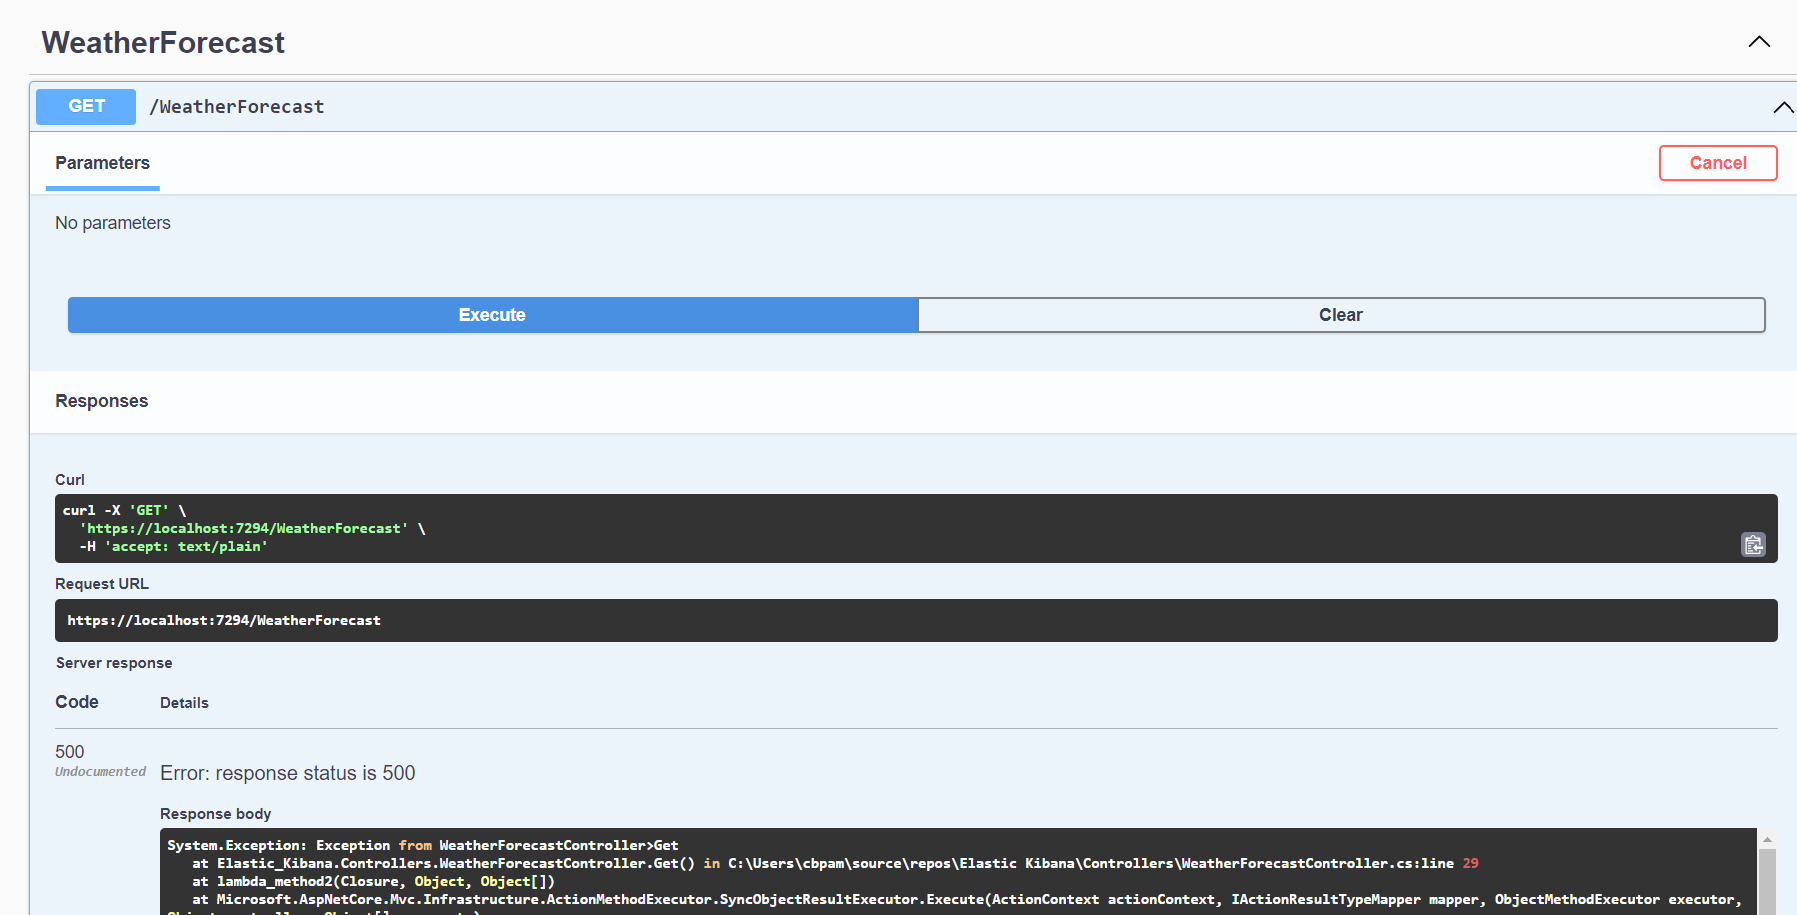
In my case, the Information log and Error log are displayed as expected in the corresponding windows.


We ensured that we could write logs with Serilog to specified sinks. The next step is to send logs to Elasticsearch. Open the appsettings.json file and add the WriteTo Elasticsearch configuration section and Using section to the Serilog configuration.
    "Serilog": {
      "Using": [ "Serilog.Sinks.Elasticsearch" ],
      "MinimumLevel": {
        "Default": "Information",
        "Override": {
          "Microsoft": "Information",
          "System": "Error"
        }
      },
      "WriteTo": [
        {
          "Name": "Elasticsearch",
          "Args": {
            "nodeUris": "http://localhost:9200"
          }
        }
      ]
    }
Navigate to the Program.cs file and add Elasticsearch sink to the configuration builder.

It's time to test if Serilog writes logs into Elasticsearch as it does to Console and Debug windows. Run the application and execute the controller method.
un
We can check if Elasticsearch receives the logs and shares them with the Kibana. Open the Kibana (http://localhost:5601/) instance in the browser. On the left menu, click Stack Management under the Management section. Click Index Management when the Management page opens.
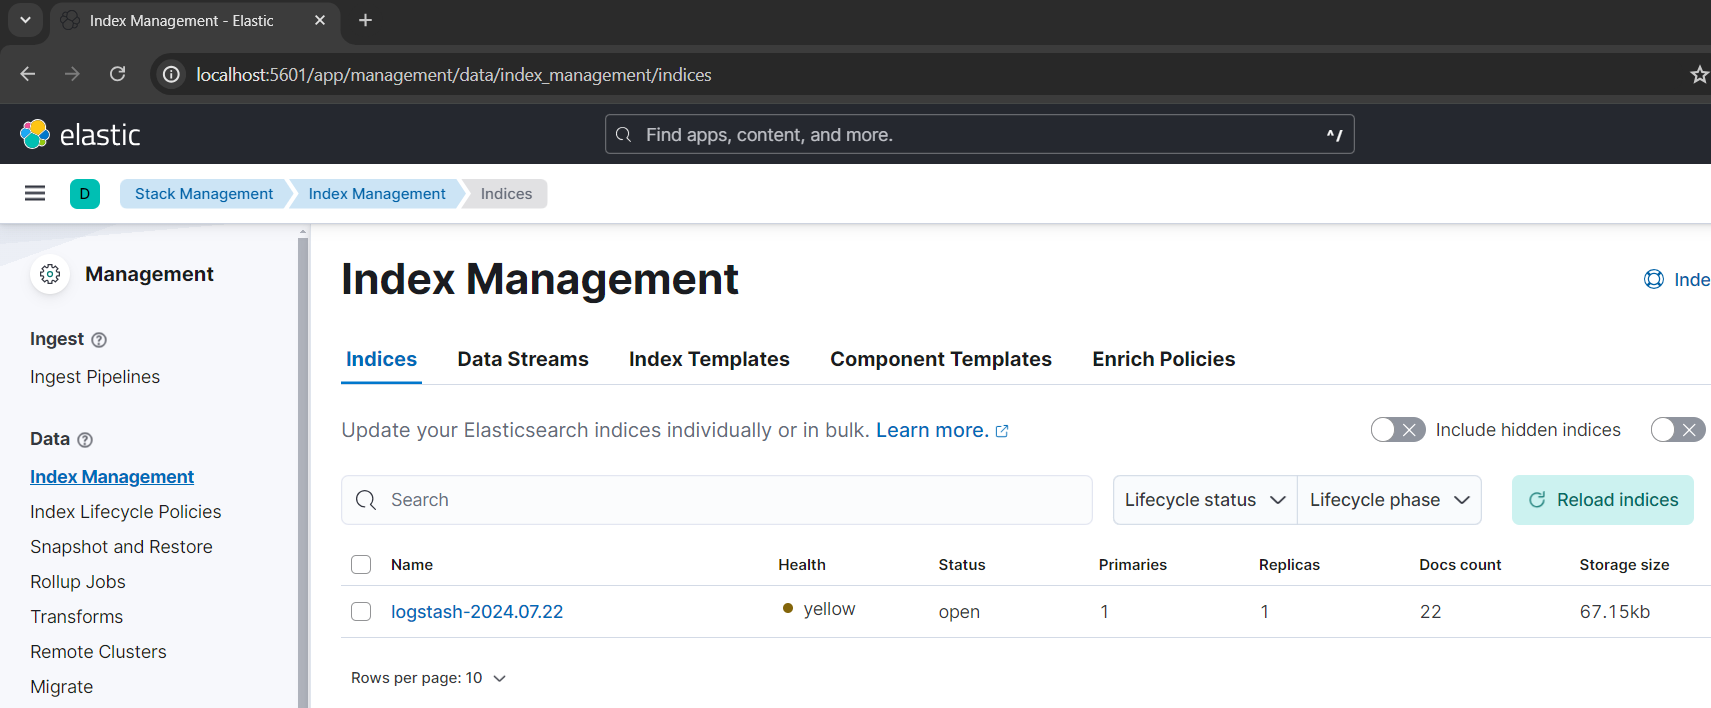
I saw a new index listed after running my application. Note that I kept things simple for the demo purposes but it's possible to elaborate more on the configuration and determine many values including the index name.
To see logs, go to the home page in Kibana UI. On the left menu, click the Discover option. This will open the Data Views page. Create a data view if you don't have any. I was able to get my logs listed in the data view page and I also executed a simple KQL query.

This concludes the article demonstrating how to integrate a .NET application with containerized local Elasticsearch and Kibana.
Thanks for reading!
References
https://www.elastic.co/guide/en/elasticsearch/reference/current/docker.html
https://www.elastic.co/guide/en/elasticsearch/reference/current/security-settings.html
https://www.elastic.co/guide/en/elasticsearch/reference/current/modules-discovery-settings.html
https://github.com/serilog-contrib/serilog-sinks-elasticsearch
Subscribe to my newsletter
Read articles from Bilge Pamukcu directly inside your inbox. Subscribe to the newsletter, and don't miss out.
Written by
