Automate Lighthouse Reports For Max App Performance
 Jeff Jakinovich
Table of contents
- What is a Lighthouse report?
- How to run a Lighthouse report from the command line
- Install the Lighthouse CI package.
- Create the NPM script.
- Create the file that gives Lighthouse the instructions for what to run.
- Make sure everything is working locally.
- Optional: make sure the Lighthouse reports don’t get added to your repo
- Customize the assertions you want in your report.
- Set benchmarks to check against future changes.
- Run the Lighthouse report in GitHub actions
- Wrap up

vImagine you build an incredible app that solves all your user’s problems. Your entrepreneur dreams are coming true. Then, one day, a line of code finds a way into your codebase that plummets page speeds. Users are waiting several seconds for each page. Users start to leave. And never come back. Your dreams are dead.
That sounds dramatic. But no one likes a poor-performing web page.
Good thing I have a solution for you.
I’m not a huge fan of setting up needless systems or automations on projects before you know whether the project has legs. But there is always one automation I add to every single repo:
Automated Lighthouse reports.
What is a Lighthouse report?
A Lighthouse report is an automated tool to help you improve your web pages. You give it a URL, and it gives you a report on key metrics that affect the quality of your web pages. The high-level report looks like this:

Each section also has more details with links to articles by Google to help you fix things that might be wrong.
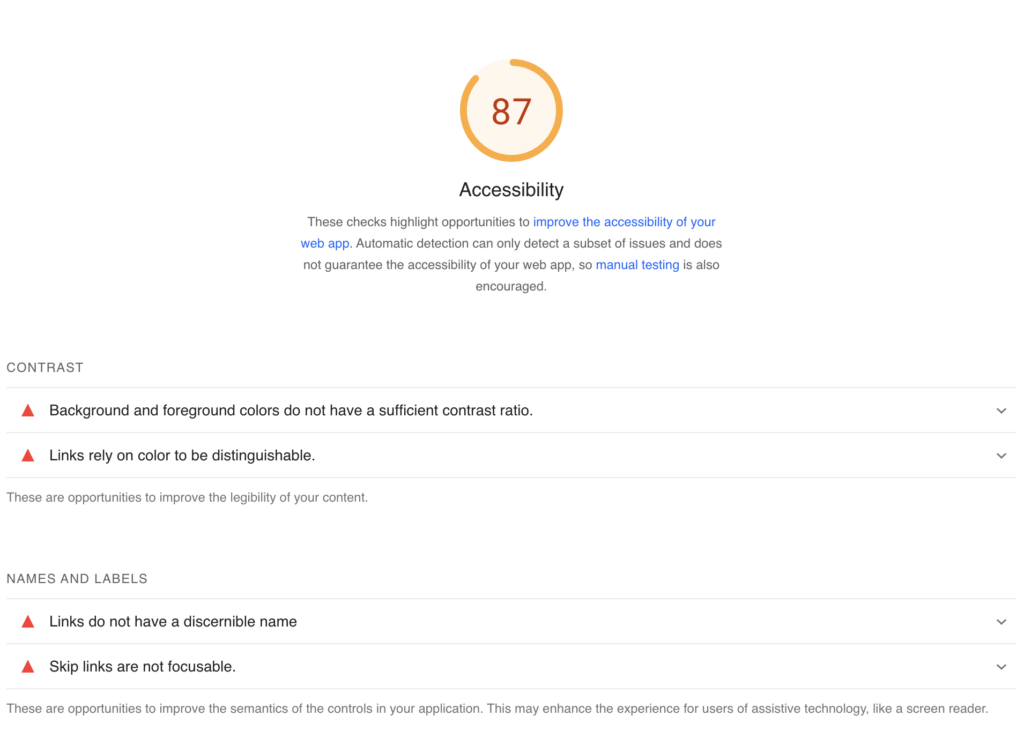
You can run this report as many times as you want. But it can get annoying to run the report too often. The good news is there is a way you can automate the reports and make sure no code gets added to your repo that hurts your scores.
How to run a Lighthouse report from the command line
Install the Lighthouse CI package.
In your project, install the NPM package that helps you run the Lighthouse reports from your terminal.
npm install @lhci/cli
Create the NPM script.
Now, create a script in your package.json to run the reports locally and in the GitHub action.
"scripts": {
  "ci:lighthouse": "lhci autorun"
  },
Create the file that gives Lighthouse the instructions for what to run.
This is where all the customizations happen. You can tell Lighthouse where you want the reports to live, what type of reports to run, assertions to avoid or pay attention to, and even set benchmarks.
I’ll show you how to add all the above later, but let’s get a basic version working first.
Create a lighthouserc.js file at the root of your project.
Copy the following contents into the file. One thing to note is that the Lighthouse report will always run on the local build. So, if you haven’t built anything yet, you will need to do that first. And if you made changes, you’ll want to build again before running the reports. We will automate all this later, but it is good to be aware.
I’m using Next.js, so in the “collect” section, I set it up so Lighthouse runs the production build of my app on localhost:3000, and it runs 3 times. Then I have Lighthouse dump the reports in a directory on my root.
Depending on your tech stack and preferences, feel free to change any of these settings.
module.exports = {
  ci: {
    collect: {
    // change to however you build and run a production version of your app locally
      startServerCommand: "npm run start",
      startServerReadyPattern: "ready on",
      url: ["<http://localhost:3000>"],
      numberOfRuns: 3,
      settings: {
        preset: "desktop",
      },
    },
    upload: {
      target: "temporary-public-storage", // change to where you want the reports to live
    },
  },
};
Make sure everything is working locally.
At this point, you should have enough set up to test everything locally. Make sure to build your project, then call your NPM script we created earlier.
npm run build && npm run ci: Lighthouse
Your terminal should look something like this:
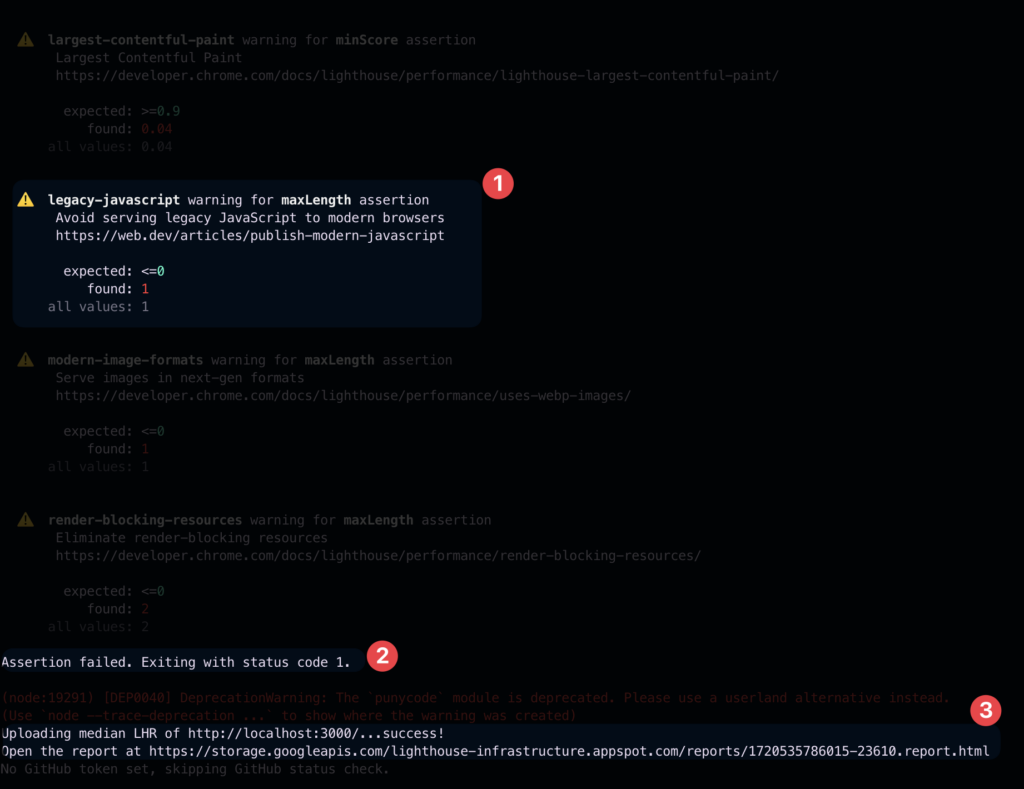
You should notice a few things:
You can see the names of any errors. You can click the link next to the name to read more about the errors so you can fix it.
If you have errors (you most likely will), your code should exit with a status code 1. When we customize our assertions next, we can make sure specific assertions don’t force our script to fail.
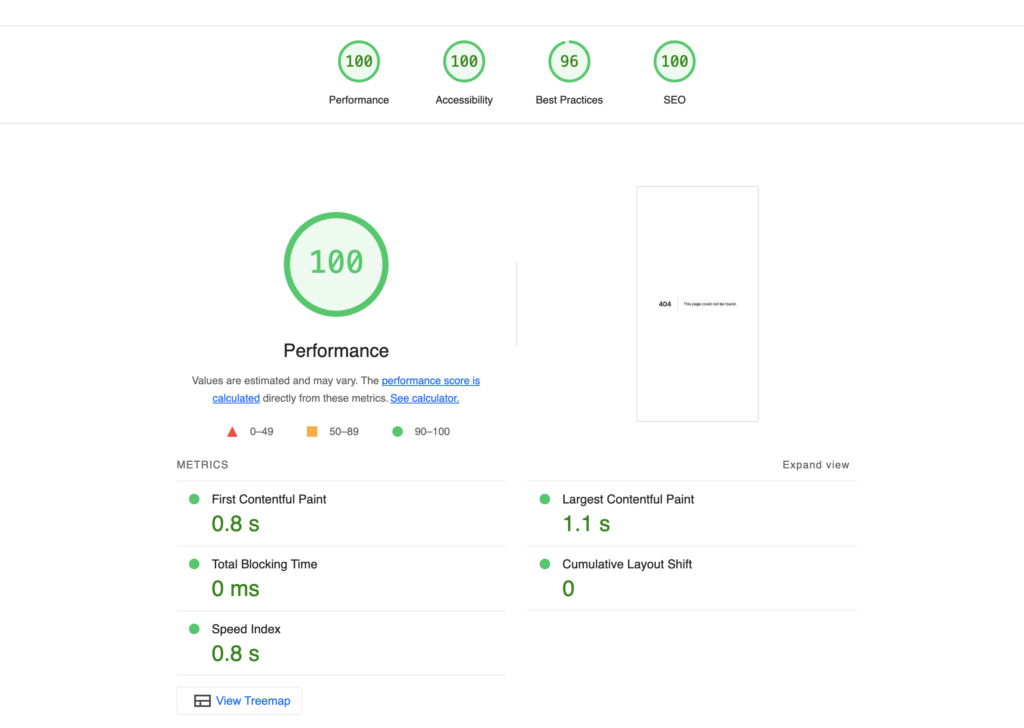
The final thing the report will tell you is where these reports live. You can take the HTML file and copy it into your URL, and you should be able to see the full report. All reports should live in a directory called
.lighthouseciif you used the same outputs command I used when setting up the Lighthouse instructions.
Optional: make sure the Lighthouse reports don’t get added to your repo
If you want to keep these reports in your repo for any reason, feel free to skip this. Usually, these reports are short-term checks, so I never want to add them to my repo. To make sure they don’t get added to your commit, go ahead and add the .lighthouseci directory to your .gitignore
...
.lighthouseci
Customize the assertions you want in your report.
Now that we have the reports working locally, there is one more thing we can customize: assertions.
When starting a project, I primarily use Lighthouse to ensure I’m not doing anything dumb. Especially things that would cause massive performance or UX issues for the users.
This means I don’t need to address everything Lighthouse finds wrong with my web pages. But I also want to remember them.
This is where I set any assertions that need more work or more learning to warn so they don't stop my progress in building the app. Then, when things are more stable, I can come back to address any deeper issues.
To do this, review all the errors you received when running the report locally. If any of them seem like something you’d want to address later, take the name of the error, add it to your lighthouserc.js, and set it to warn.
Take, for example, this error:

I should pay attention to the total-byte-weight but I'll need to investigate further. I'd rather move on for now so I can launch my project, but I also want to remember this error. So setting it to warn allows the report to succeed while still reminding me every run.
module.exports = {
  ci: {
    collect: {
      startServerCommand: "npm run start",
      startServerReadyPattern: "ready on",
      url: ["<http://localhost:3000>"],
      numberOfRuns: 3,
      settings: {
        preset: "desktop",
      },
    },
    upload: {
      target: "temporary-public-storage",
    },
    assert: {
      preset: "lighthouse:recommended",
      assertions: {
        // add your customizations for assertions here
        "total-byte-weight": "warn",
      },
    },
  },
};
Set benchmarks to check against future changes.
This is the last step needed to set up your Lighthouse reports, and then we will automate everything.
By adding benchmarks to our setup, you can set minimum scores that must always pass. Otherwise, the Lighthouse report will give us an error.
This is critical to ensuring new code doesn’t affect the quality of your web pages.
module.exports = {
  ci: {
    collect: {
      startServerCommand: "npm run start",
      startServerReadyPattern: "ready on",
      url: ["<http://localhost:3000>"],
      numberOfRuns: 3,
      settings: {
        preset: "desktop",
      },
    },
    upload: {
      target: "temporary-public-storage",
    },
    assert: {
      preset: "lighthouse:recommended",
      assertions: {
        // add your customizations for assertions here
        "total-byte-weight": "warn",
        "categories:performance": ["error", { minScore: 0.93 }],
        "categories:accessibility": ["error", { minScore: 0.93 }],
        "categories:best-practices": ["error", { minScore: 0.9 }],
        "categories:seo": ["error", { minScore: 0.9 }],
      },
    },
  },
};
Run the Lighthouse report in GitHub actions
I’m assuming you already know what GitHub actions are. So, let’s get right into setting them up.
First, make a .github directory in your root folder with a workflows directory inside. Then, add a lighthouse.yml file to the workflows directory. It should look something like this:

Inside the lighthouse.yml file, create an action that looks like this:
name: Lighthouse CI

on: [push]

jobs:
  lighthouseci:
    name: Run Lighthouse report
    runs-on: ubuntu-latest

    steps:
      - name: Checkout code
        uses: actions/checkout@v3

      - uses: actions/setup-node@v3
        with:
          node-version: 18

      - name: Install dependencies
        run: npm ci

      - name: Bundle and build
        run: npm run build

      - name: Run Lighthouse CI
        run: npm run ci:lighthouse
The main jobs of the action are to set up the Lighthouse report, build the code, and run the report every time you push code to the main branch.
The great thing about the benchmarks is they act as gatekeepers. If you change the trigger of the action to PRs, you can ensure any code meets the benchmarks before approval.
The output of the action should look like this:
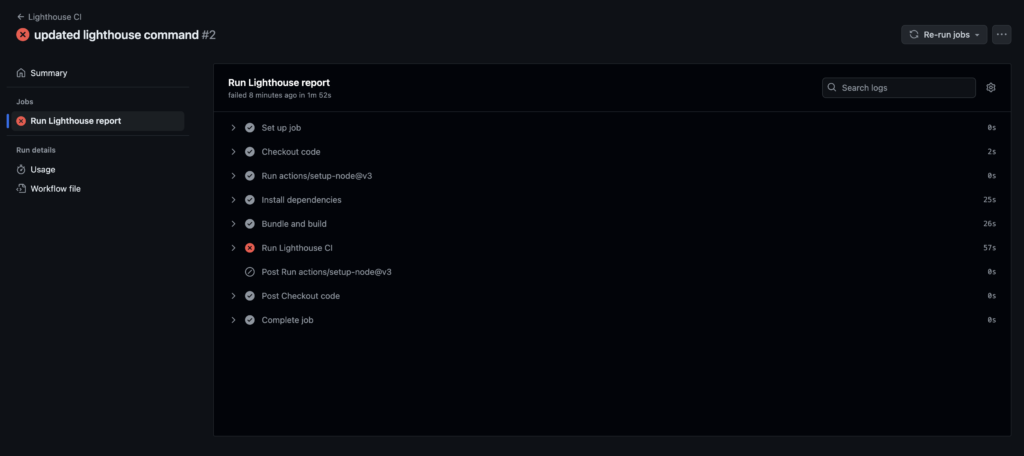
My Lighthouse report looks like it failed. That is because my benchmarks for the main categories aren’t high enough.
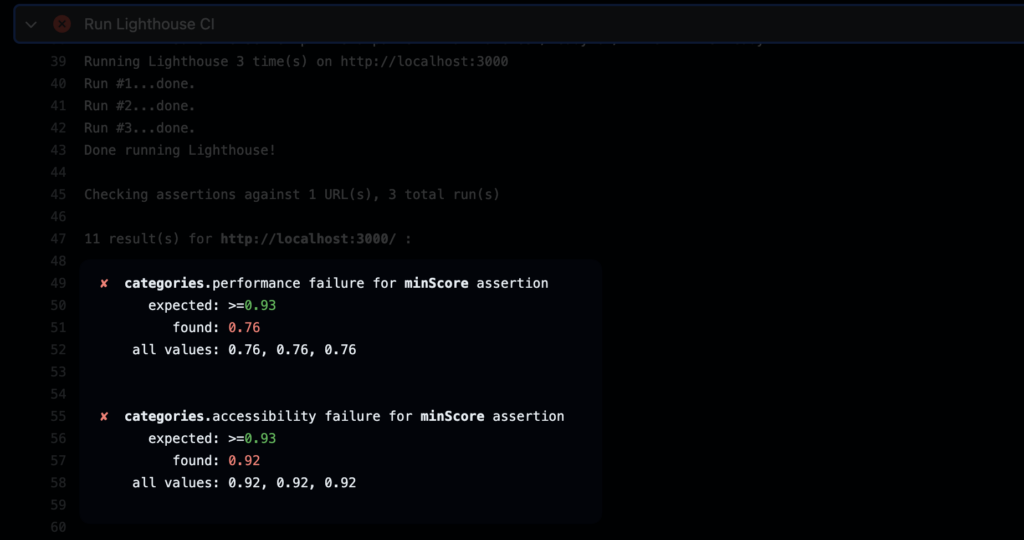
Since it was only triggered on pushing to my main branch, it doesn't stop any code from merging, but at least I know what the issues are, so I can address them at some point. If the trigger was on PR, then this PR wouldn't allow the code to merge into the branch.
Wrap up
Setting all this up once makes it super easy to repeat for every project you start. It offers tons of upsides with minimal downsides or time investments.
Happy coding! 🤙
Subscribe to my newsletter
Read articles from Jeff Jakinovich directly inside your inbox. Subscribe to the newsletter, and don't miss out.
Written by
