Day 78 - Grafana Cloud: A Comprehensive Monitoring Solution🌐
 Nilkanth Mistry
🚀 Welcome to Day 78 of the 90 Days of DevOps Challenge! 🚀
Today, we dive into Grafana Cloud, a robust and scalable monitoring platform that provides comprehensive monitoring capabilities for your infrastructure, applications, and cloud resources. With Grafana Cloud, you can consolidate all your monitoring needs into a single platform, gaining real-time visibility into the performance and health of your systems. The platform’s intuitive interface and powerful features make it an ideal choice for DevOps teams to effectively monitor their environments. 🌟
Task: Setting Up Alerts for EC2 Instances and AWS Billing Alerts
Step 1: Create an EC2 Instance 🖥️✨
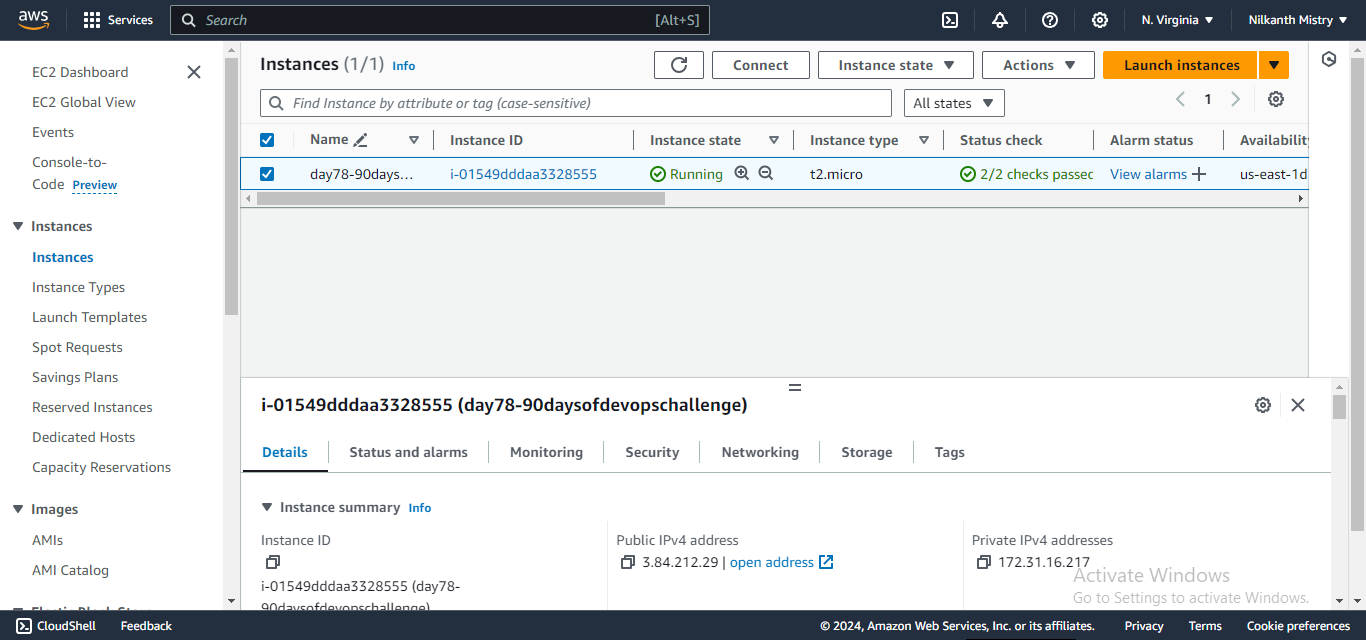
Start by creating an EC2 instance in your AWS environment. This instance will be monitored using Grafana.
Navigate to the AWS Management Console. 📋
Select "EC2" from the services menu. 🌐
Click "Launch Instance" and follow the steps to configure and start your instance. 🚀
Step 2: Set Up Grafana Cloud Console ☁️🔧
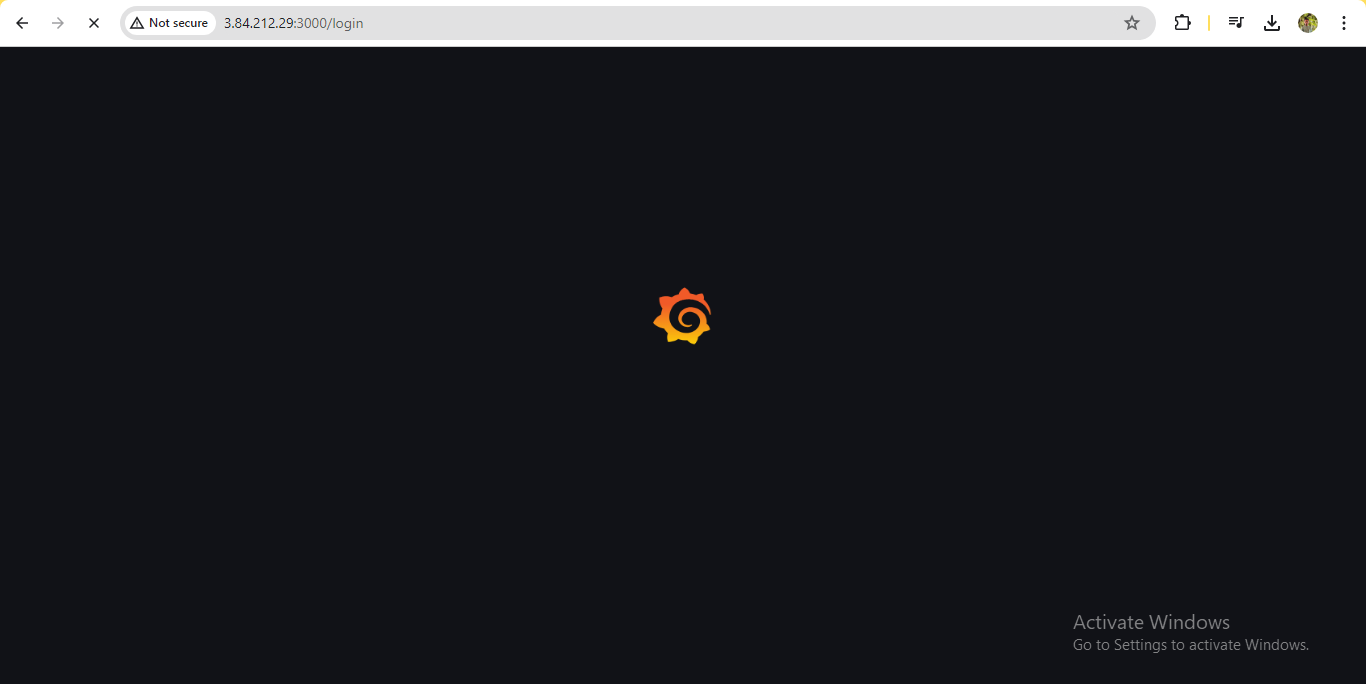
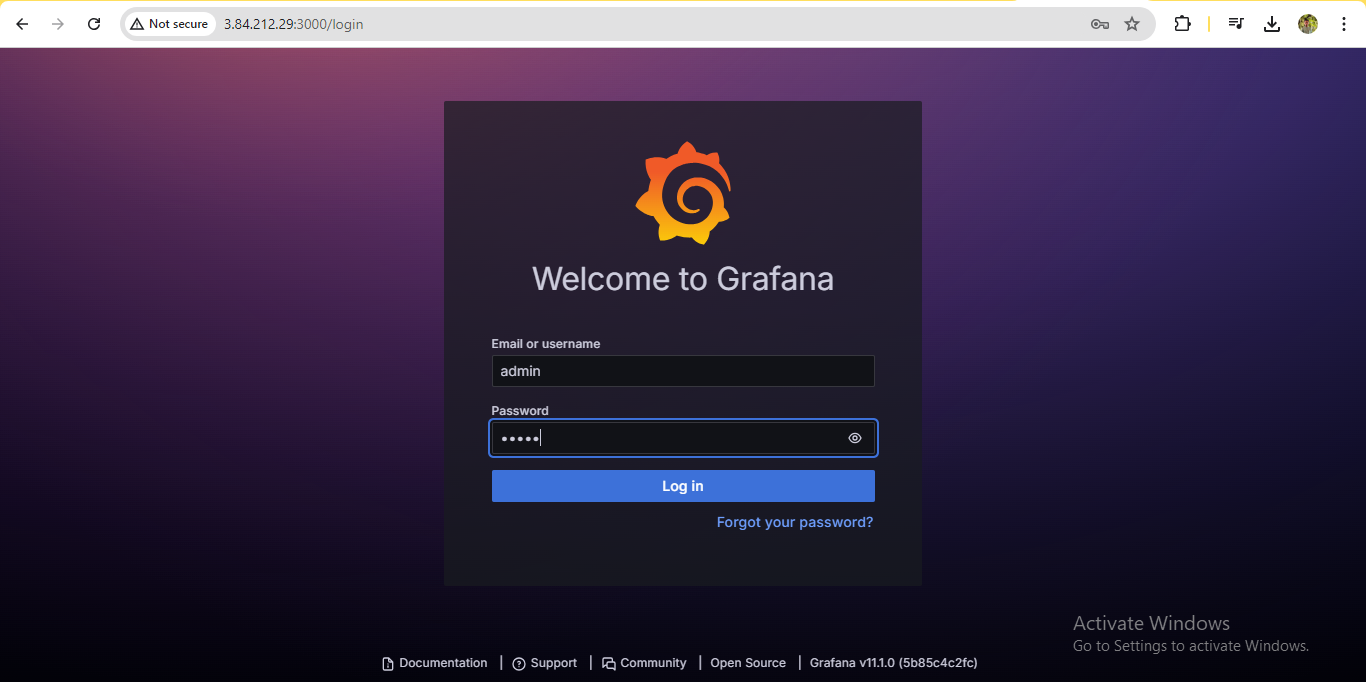
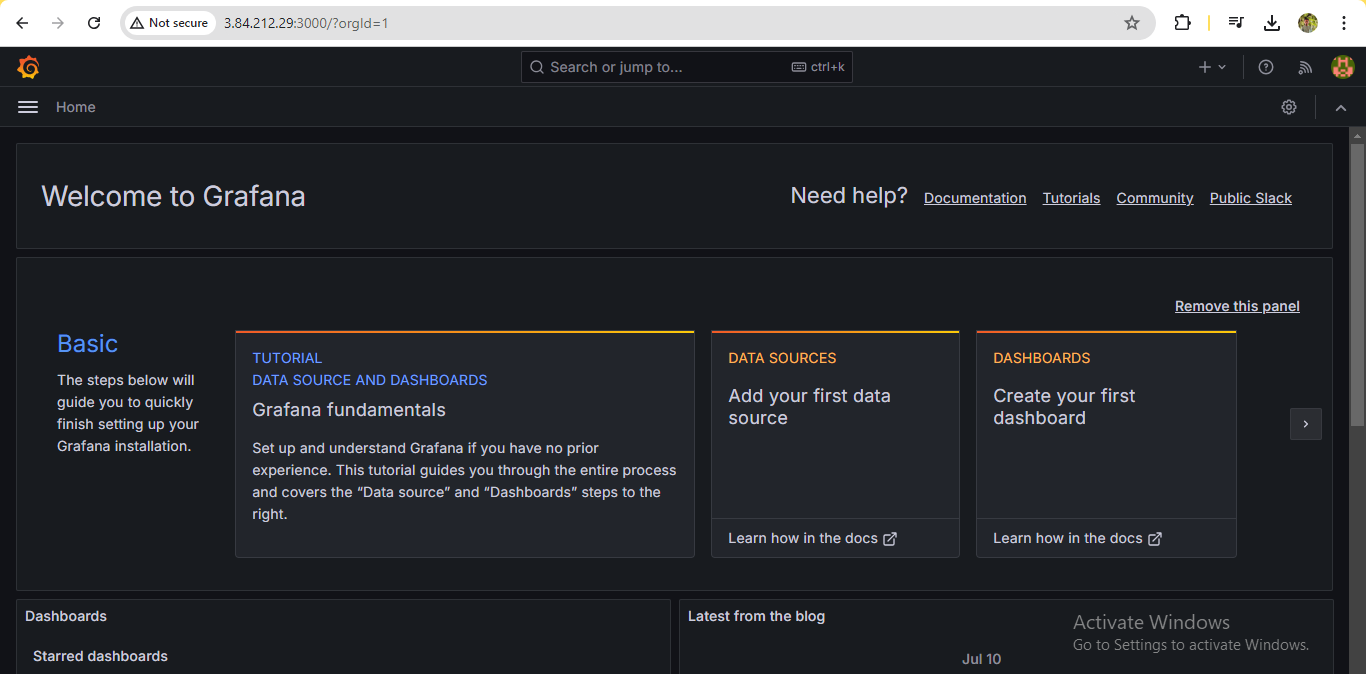
If you haven’t set up Grafana Cloud yet, follow the steps in my previous blog post on how to set up Grafana Cloud. Ensure your Grafana Cloud instance is running and accessible. ✅
install Grafana:
sudo apt-get update
sudo apt install -y software-properties-common
sudo add-apt-repository "deb https://packages.grafana.com/oss/deb stable main"
wget -q -O - https://packages.grafana.com/gpg.key | sudo apt-key add -
sudo apt update
sudo apt install -y grafana
sudo systemctl start grafana-server
sudo systemctl enable grafana-server
Step 3: Connect Data to AWS 🔗🔍
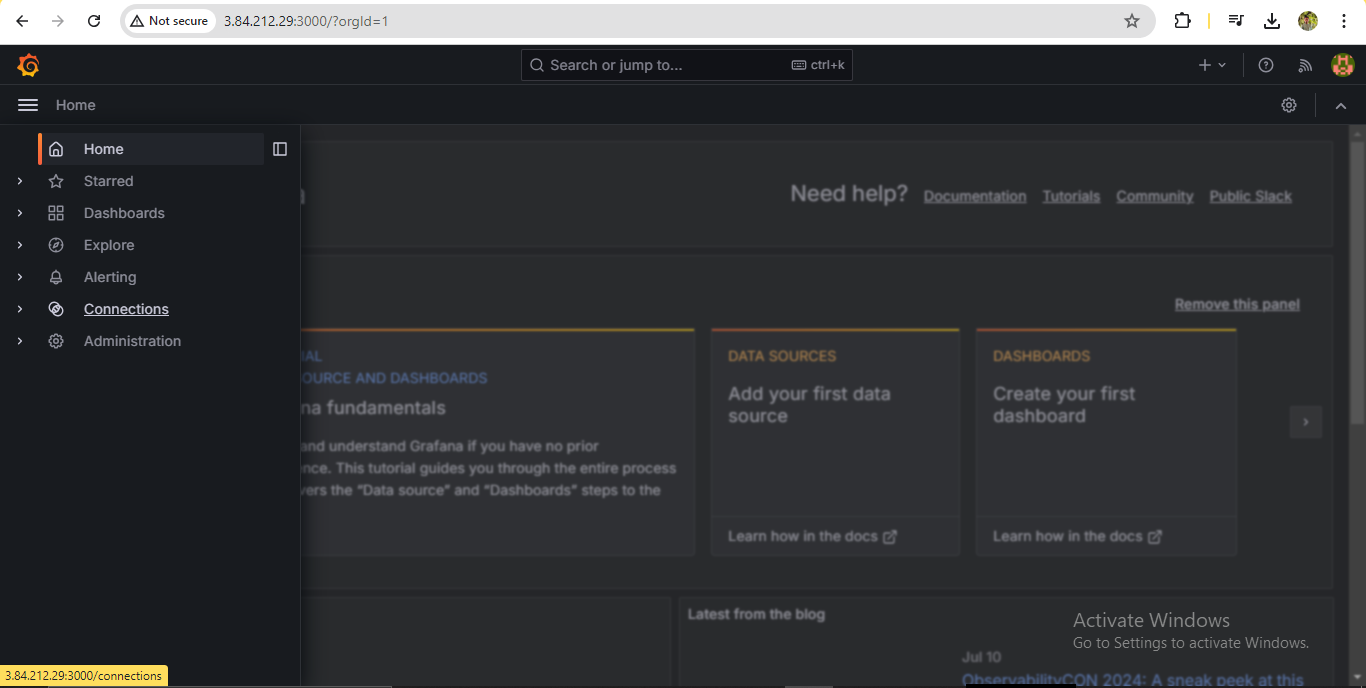
On the Grafana Cloud home page, navigate to the “Connections/Add new connection” section. 🔗
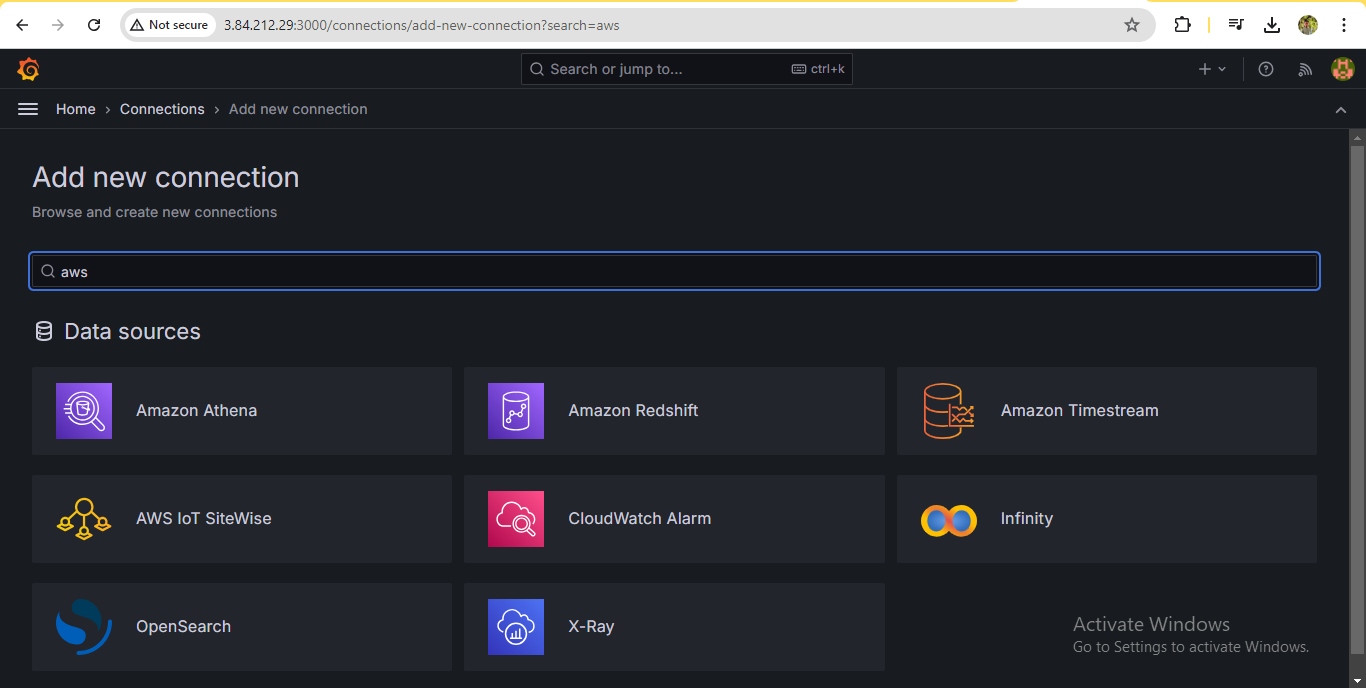
Click on “AWS” to access the setup for AWS account integration. 🔧
Step 4: Select CloudWatch Metrics 📊✨
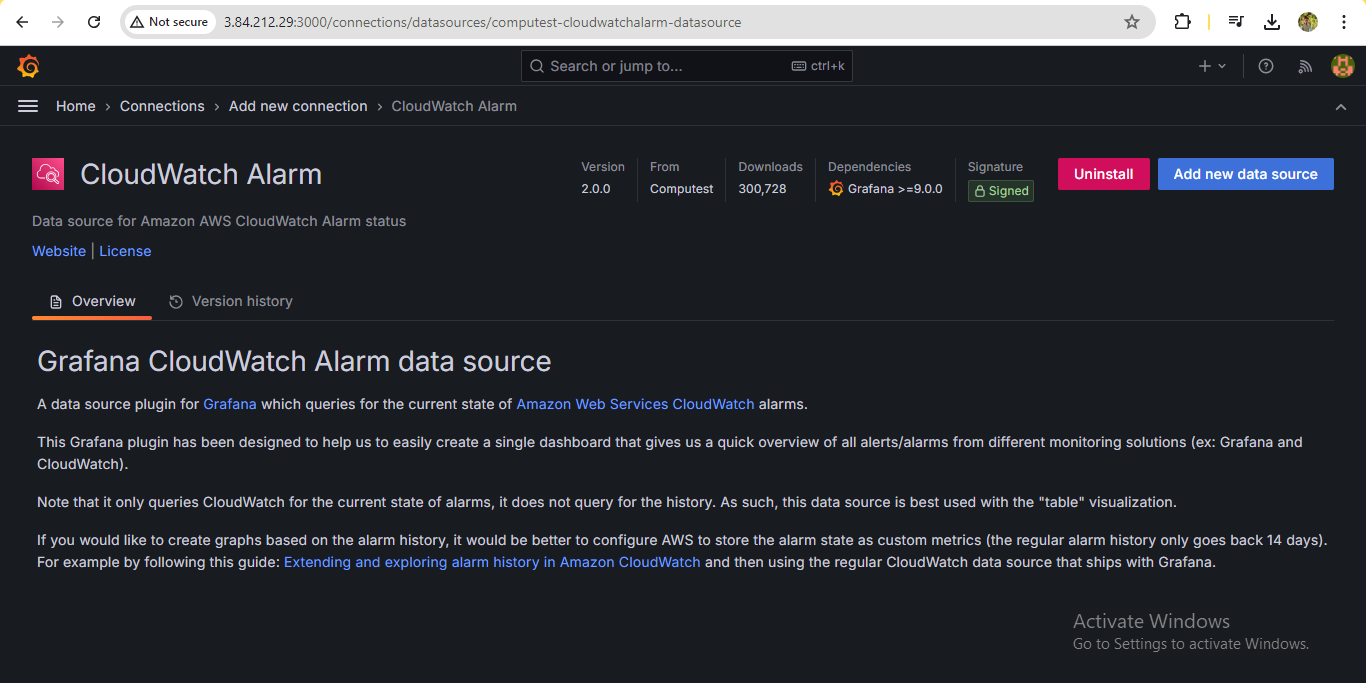
In the dashboard, select CloudWatch metrics for integration between AWS and Grafana Cloud. 🌐
Follow the prompts to complete the setup. 🛠️
Step 5: Create AWS IAM Role 🔐🔧
For CloudWatch integration, you need to create an AWS IAM Role. Follow these steps:
Go to the AWS Management Console. 📋
Select "IAM" from the services menu. 🌐
Click "Roles" and then "Create Role." 🚀
Follow the steps in the screenshot provided in your Grafana setup guide to set up the IAM Role via CloudFormation. 📷
Step 6: Access CloudWatch Metrics Dashboard 📈🌟
After successful integration, go to the home page and open the dashboard. 🏠
Select the CloudWatch Metrics dashboard to view visualized data with real-time tracking. 🕒🔍
Step 7: Set Up Alerts for CPU Utilization 🚨💻
Click on “Create Alert Rule” for CPU utilization above 75%. 📊
Select the metric
as_ec2_cpuutilization_maximum, then select the instance ID, and set the threshold value to 75%. 📈Run the query to check the output. 🔄
Click “Save Rule” to save the alert rule. 💾
Step 8: Configure Alerting Emails 📧🛠️
Click on “Manage Contact Points.” 📋
Edit the
grafana-default-emailcontact point. 📝Put your email address in the “Address” field and click “Test” for verification. ✔️
You will receive a test alert email to confirm the setup. 📬
Step 9: Set Up Notification Policies 📑📧
Click on “Manage Notification Policies.” 📋
Select the label and value for the notification (e.g., “alert” and “critical”). 🚨
Choose the contact point you previously created for alerting emails. ✉️
Step 10: Set Up Alerts for Billing 💸🔔
Select “Manage Alert Rule.” 📋
Choose the metric
aws_billing_estimated_charges_averageand sum them. 📊Set the threshold value to $5. 💵
Add a new notification policy for billing above $5. 📧
🎉 Congratulations! You’ve now set up monitoring and alerting for your EC2 instances and AWS billing in Grafana Cloud. With Grafana Cloud’s powerful monitoring capabilities, you can proactively respond to issues and ensure the optimal performance of your infrastructure. 🌐🚀
Subscribe to my newsletter
Read articles from Nilkanth Mistry directly inside your inbox. Subscribe to the newsletter, and don't miss out.
Written by

Nilkanth Mistry
Nilkanth Mistry
Embark on a 90-day DevOps journey with me as we tackle challenges, unravel complexities, and conquer the world of seamless software delivery. Join my Hashnode blog series where we'll explore hands-on DevOps scenarios, troubleshooting real-world issues, and mastering the art of efficient deployment. Let's embrace the challenges and elevate our DevOps expertise together! #DevOpsChallenges #HandsOnLearning #ContinuousImprovement