Day 79 - Prometheus 🔥
 Nilkanth Mistry
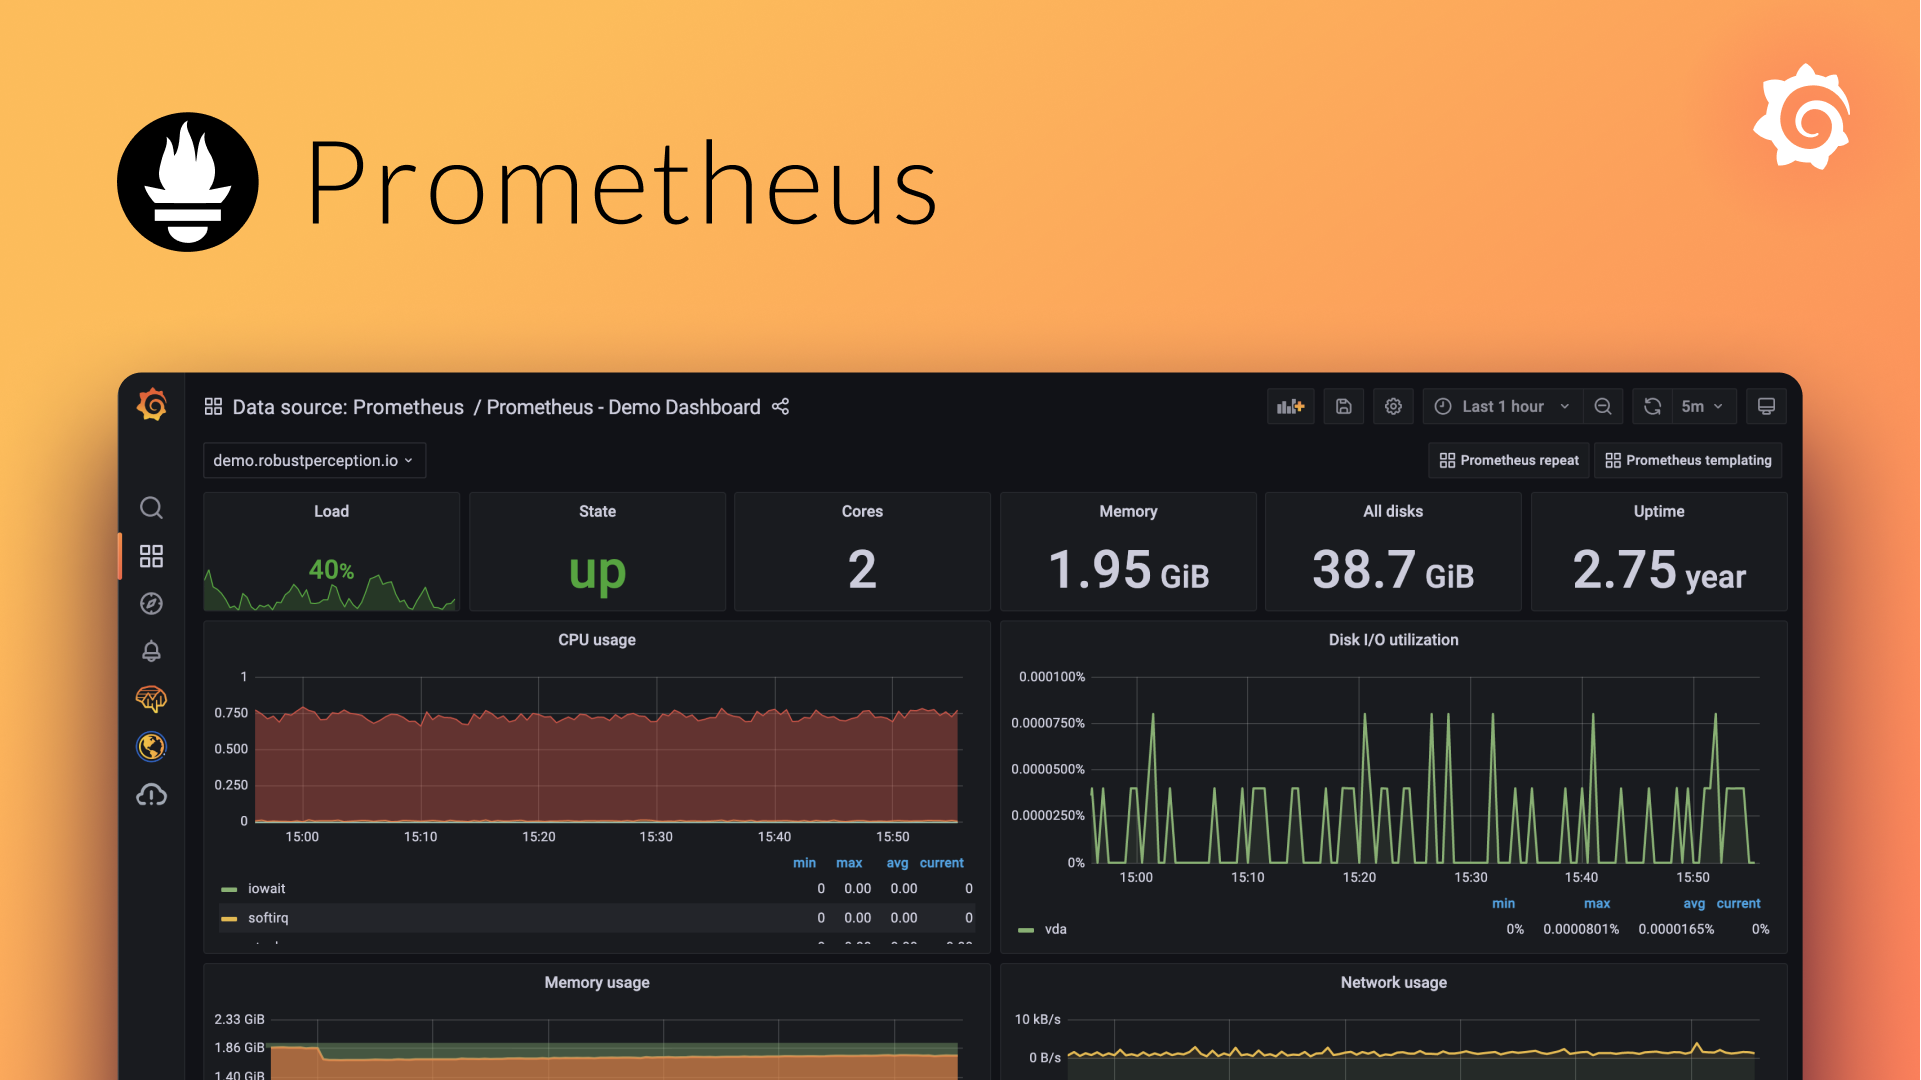
Welcome to Day 79 of the #90DaysOfDevOpsChallenge! Today, we will dive into Prometheus, an open-source system for monitoring services and generating alerts based on a time series data model. Prometheus collects data and metrics from various services and stores them with a unique identifier—the metric name—and a time stamp. Let's explore Prometheus in detail! 🚀
Tasks
1. What is the Architecture of Prometheus Monitoring? 🏛️
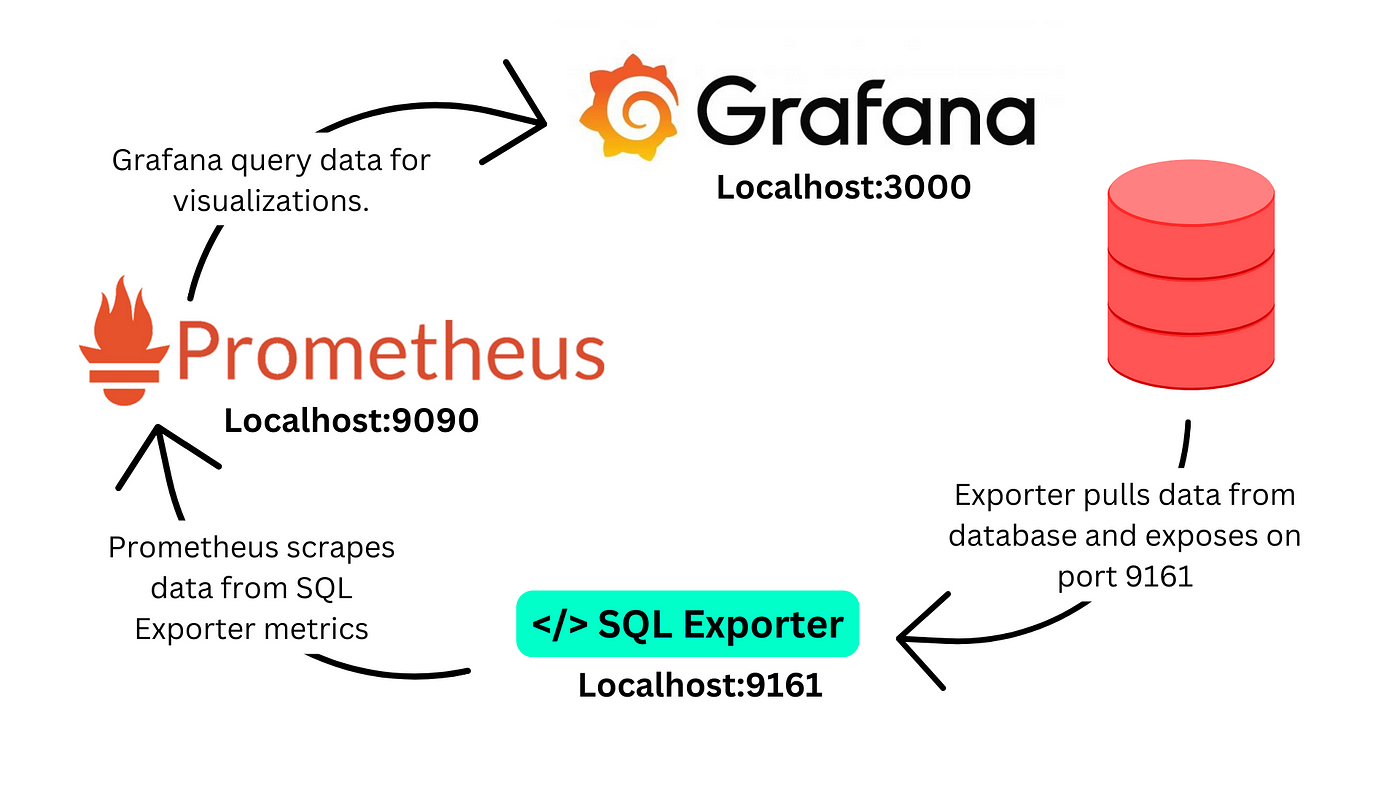
The architecture of Prometheus is designed to be highly reliable and efficient for monitoring and alerting:

Prometheus Server 🖥️: Scrapes and stores time series data.
Pushgateway 🚀: For short-lived jobs to push metrics.
Client Libraries 📚: For instrumenting application code.
Exporters 📦: For collecting metrics from services and third-party systems.
Alertmanager 🚨: Handles alerts and notifications.
Service Discovery 🔍: Automatically discovers services to monitor.
Prometheus Server 🖥️: The core component that scrapes and stores metrics.
Pushgateway 🚀: Used for jobs that are short-lived to push metrics to Prometheus.
Client Libraries 📚: Instrument application code to expose metrics.
Exporters 📦: Collect metrics from third-party systems or services.
Alertmanager 🚨: Manages alerts and routes them to the appropriate channels.
Service Discovery 🔍: Finds targets to monitor dynamically.
2. What are the Features of Prometheus? ✨
Prometheus offers a wide range of features that make it a robust monitoring tool:
Multi-dimensional data model 📊: Metrics identified by metric name and key/value pairs.
Flexible query language (PromQL) 🔎: Powerful for aggregating and slicing time series data.
Pull model 🏗️: Prometheus scrapes targets for metrics.
Pushing metrics 📥: Through the Pushgateway for short-lived jobs.
Targets discovery 🧭: Via static configuration or service discovery.
Alerting ⚠️: Integrated alerting with Alertmanager.
Graphing and dashboards 📈: Native support for graphing and integration with Grafana.
3. What are the Components of Prometheus? 🧩
Prometheus consists of several key components:
Prometheus Server 🖥️: Main server that scrapes and stores metrics.
Pushgateway 🚀: Allows ephemeral and batch jobs to push metrics.
Client Libraries 📚: Libraries for different programming languages to instrument your code.
Go 🐹
Java or Scala ☕
Python 🐍
Ruby 💎
Exporters 📦: Export metrics from third-party systems (e.g., Node Exporter for Linux system metrics, Blackbox Exporter for HTTP endpoints).
Alertmanager 🚨: Manages alerts, including deduplication, grouping, and routing.
PromQL 🔍: The query language used to query and retrieve time series data from Prometheus.
4. What database is used by Prometheus? 🗄️

Prometheus uses a custom, embedded time series database 📅 for storing its data. This database is highly optimized for the high-write, low-latency storage of time series data. The database is a key part of the Prometheus server and does not use any external databases.
5. What is the default data retention period in Prometheus? ⏳
The default data retention period in Prometheus is 15 days 🕒. This means that by default, Prometheus will store metrics data for 15 days before it is deleted. You can configure this period by setting the --storage.tsdb.retention.time flag when starting the Prometheus server.
Summary 🎉
Today, we explored the fundamentals of Prometheus, a powerful open-source monitoring system. We learned about its architecture, features, components, the database it uses, and the default data retention period. This understanding of Prometheus will help you efficiently monitor your applications and services, ensuring high availability and performance. Keep experimenting and expanding your knowledge! Happy monitoring! 🎊
Subscribe to my newsletter
Read articles from Nilkanth Mistry directly inside your inbox. Subscribe to the newsletter, and don't miss out.
Written by

Nilkanth Mistry
Nilkanth Mistry
Embark on a 90-day DevOps journey with me as we tackle challenges, unravel complexities, and conquer the world of seamless software delivery. Join my Hashnode blog series where we'll explore hands-on DevOps scenarios, troubleshooting real-world issues, and mastering the art of efficient deployment. Let's embrace the challenges and elevate our DevOps expertise together! #DevOpsChallenges #HandsOnLearning #ContinuousImprovement