Opentelemetry Bonus Tricks
 Bruno
BrunoTable of contents

Convert Kong logs to OTLP format
I faced issues when I worked on logs and the OpenTelemetry protocol.
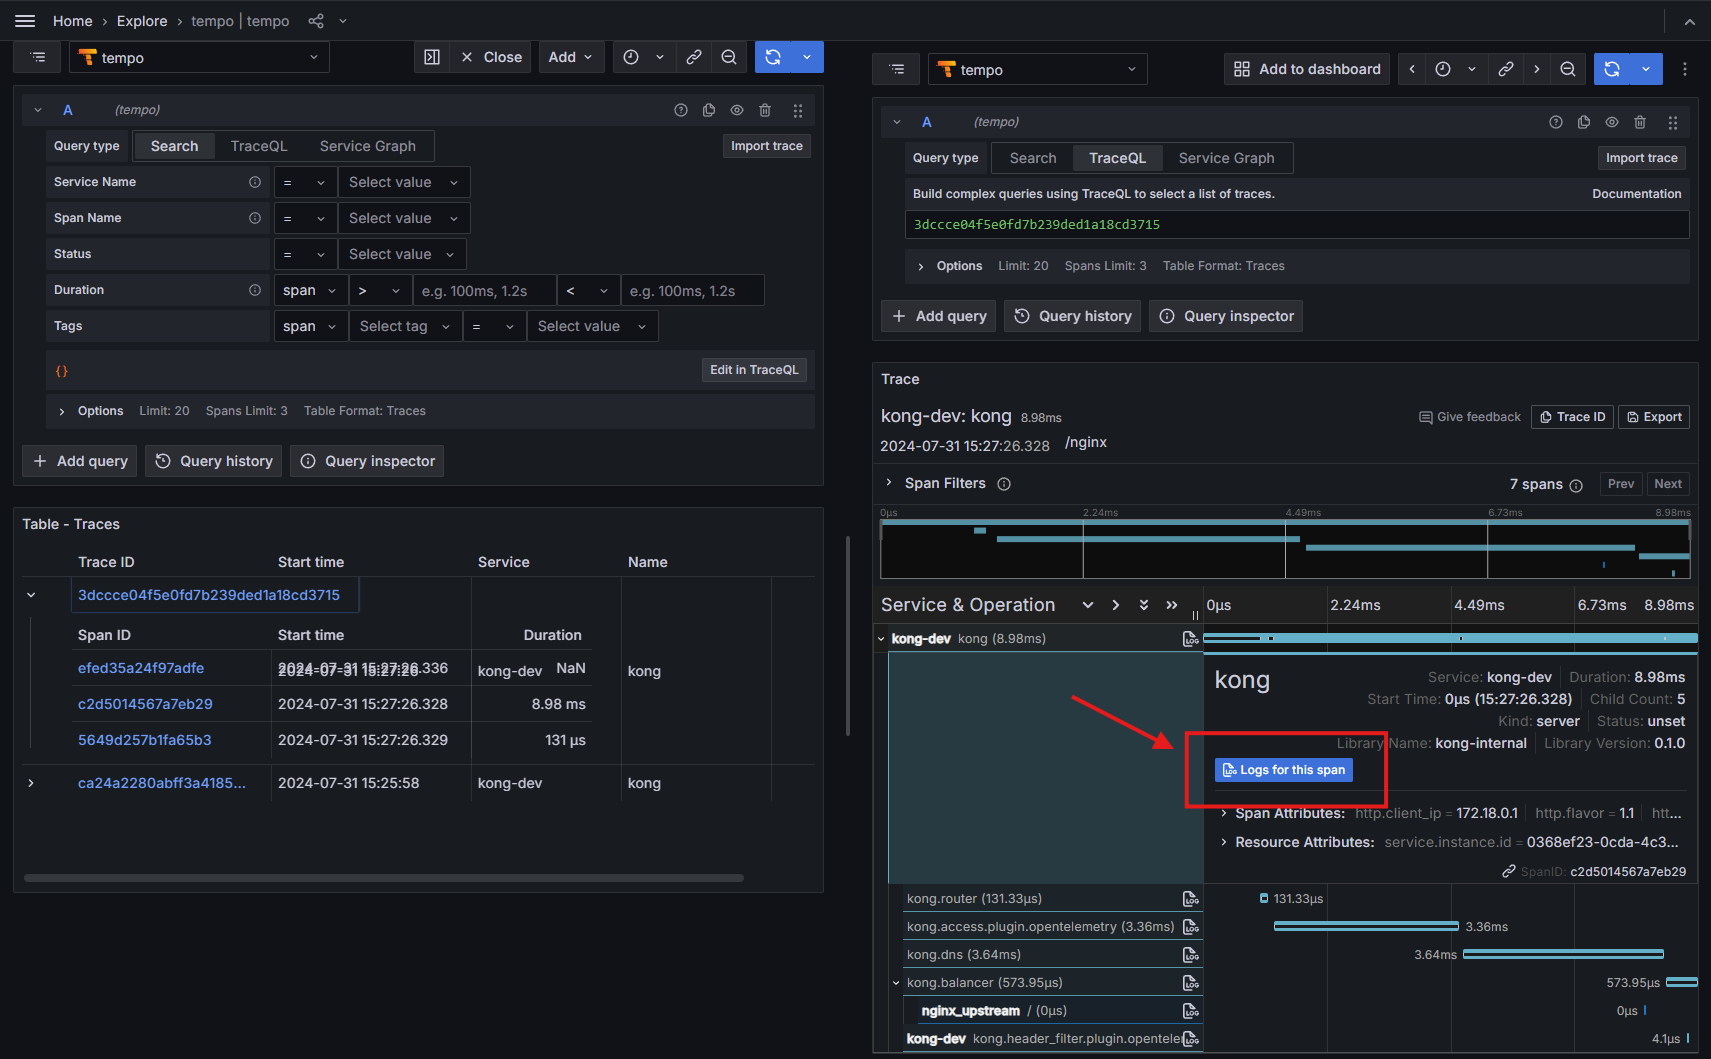
Kong doesn't provide logs in this format, and to enable Log for the span feature in Grafana, we need to collect logs in the OTLP format.
I used Fluentbit to perform these tasks.
$ cd && mkdir -p ~/opentelemetry_demo/fluentbit && cd ~/opentelemetry_demo/fluentbit
Let's create FluentBit config file
$ cat << EOF >> config.conf
[INPUT]
    name http
    listen 0.0.0.0
    port 8888

[FILTER]
    Name    lua
    Match   kong
    code    function inline_filter(tag, timestamp, record)record.trace_id = record.trace_id.w3c; return 1, timestamp, record end
    call    inline_filter

[OUTPUT]
    name stdout
    match  *

[OUTPUT]
    Name                 opentelemetry
    Match                kong
    Host                 otelco
    Port                 4318
    Metrics_uri          /v1/metrics
    Logs_uri             /v1/logs
    Traces_uri           /v1/traces
    Log_response_payload True
    Tls                  Off
    Tls.verify           Off
    logs_trace_id_message_key trace_id
    logs_span_id_message_key span_id
EOF
I couldn't collect or create a specific service_name on logs emits by Kong. So, this following did the trick but it's not really an happy path.
I added a processors -> resource -> attributes -> action: upsert on OTEL collector for logging stack.
If a service_name is missing, OpenTelemetry Collector will create a default one.
If anyone has a better solution, please make a comment.
$ cat << EOF >> ~/opentelemetry_demo/otelcol/config.yaml
receivers:
  otlp:
    protocols:
      grpc:
        endpoint: 0.0.0.0:4317
      http:
        endpoint: 0.0.0.0:4318
  prometheus:
    config:
      scrape_configs:
      - job_name: 'otel-collector'
        scrape_interval: 10s
        static_configs:
        - targets: ['0.0.0.0:8888']

processors:
  batch:
  resource:
    attributes:
      - action: upsert
        key: service.name
        value: kong-dev

exporters:
  otlp:
    endpoint: tempo:4317
    tls:
      insecure: true
  otlphttp:
    endpoint: http://loki:3100/otlp
  prometheusremotewrite:
    endpoint: http://mimir:8080/api/v1/push

extensions:
  health_check:
  pprof:
  zpages:

service:
  extensions: [health_check, pprof, zpages]
  pipelines:
    traces:
      receivers: [otlp]
      processors: [batch]
      exporters: [otlp]
    logs:
      receivers: [otlp]
      processors: [resource]
      exporters: [otlphttp]
    metrics:
      receivers: [prometheus]
      processors: [batch]
      exporters: [prometheusremotewrite]
EOF
Enable Kong HTTP-Log plugin
$ curl -X POST http://localhost:8001/plugins/ \
    --header "accept: application/json" \
    --header "Content-Type: application/json" \
    --data '
    {
  "name": "http-log",
  "config": {
    "http_endpoint": "http://fluentbit:8888/kong",
    "method": "POST",
    "timeout": 1000,
    "keepalive": 1000,
    "flush_timeout": 2,
    "retry_count": 15
  }
}
    '
Now, create the FluentBit container
$ docker run \
  --name=fluentbit \
  --hostname=fluentbit \
  --network=lgtm \
  -p 8888:8888 \
  -v $(pwd)/config.conf:/etc/fluentbit/config.conf \
  cr.fluentbit.io/fluent/fluent-bit \
  --config=/etc/fluentbit/config.conf
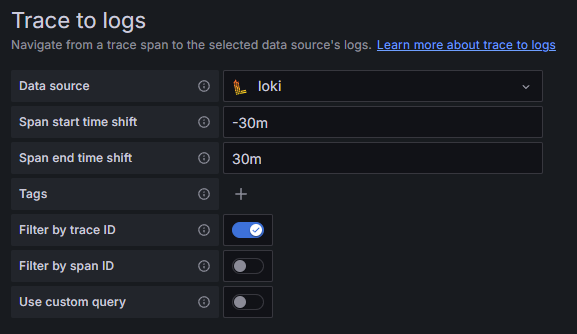
Finally, you need to configure the Tempo datasource in Grafana by setting Trace to logs this way :

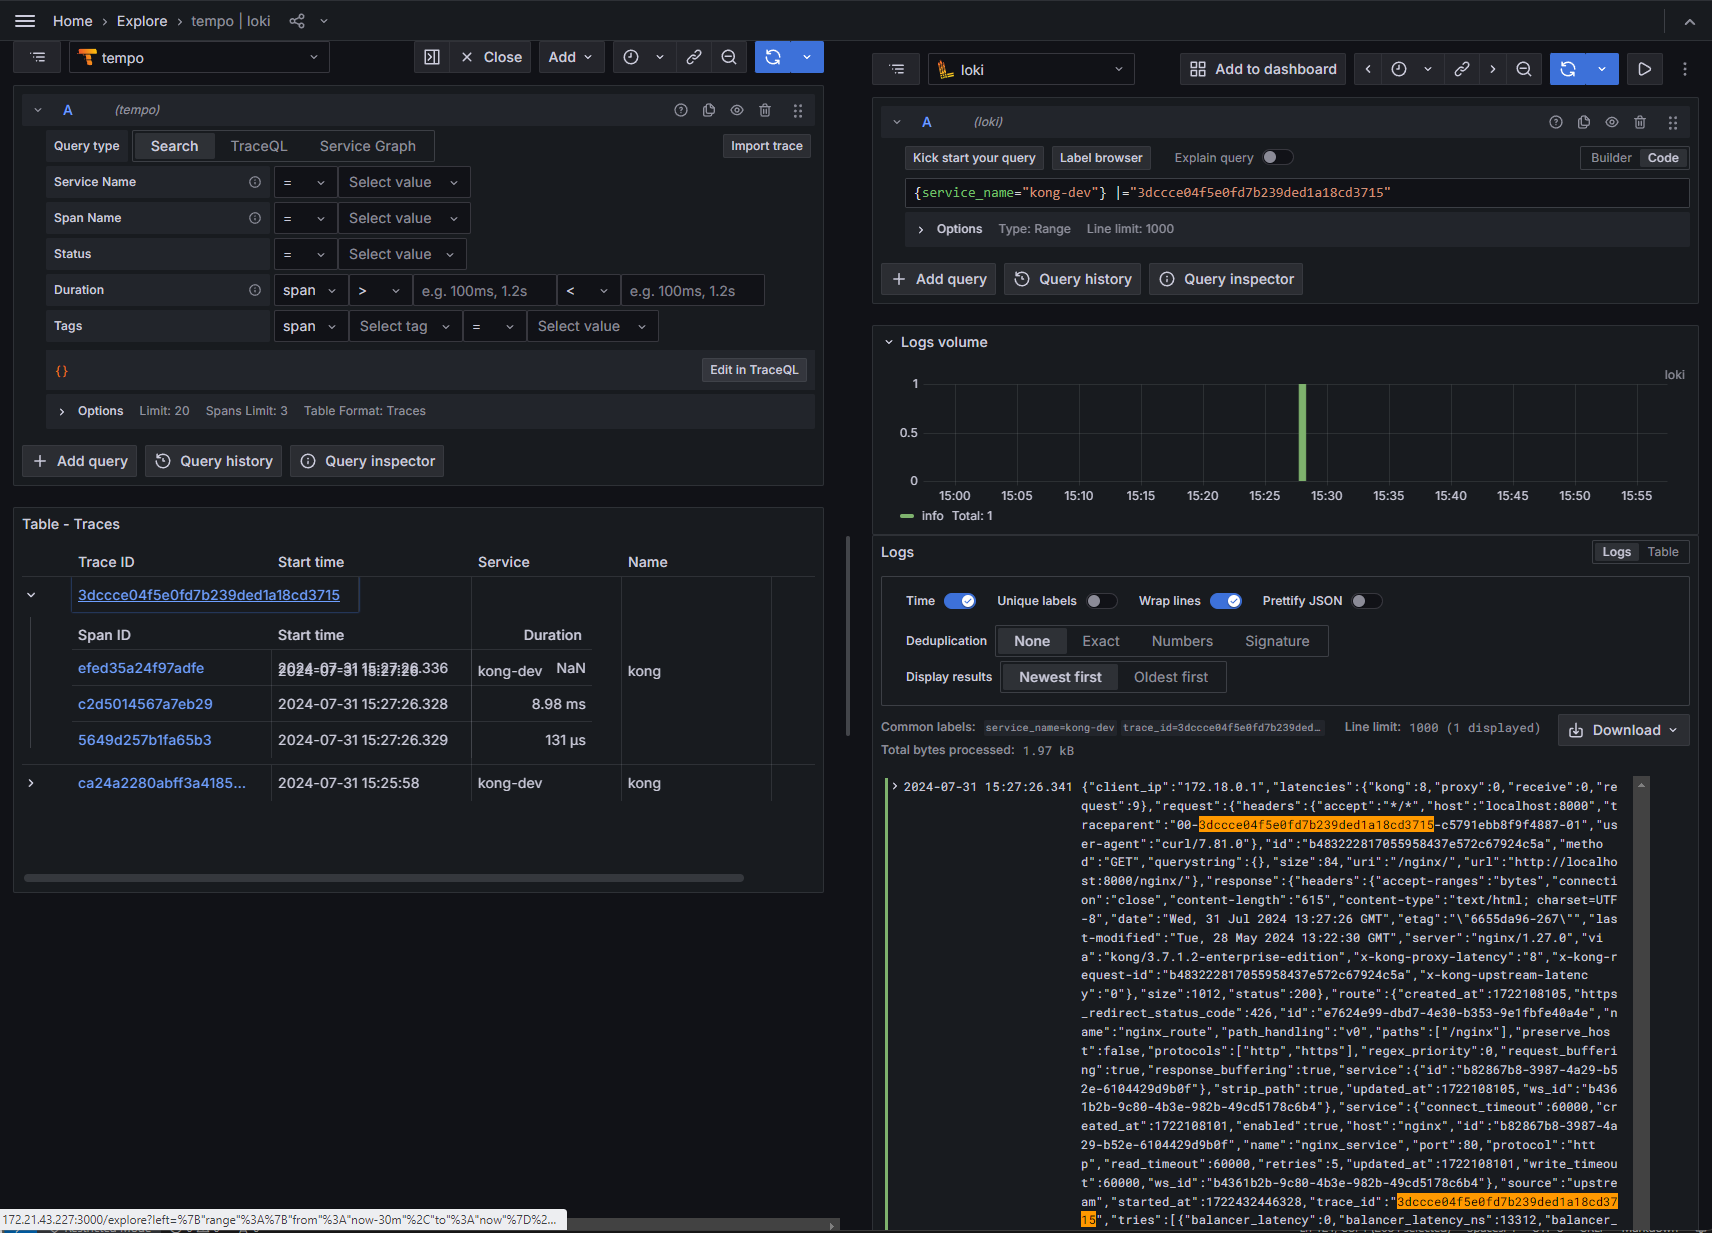
Now, we can fetch logs from a Kong trace ID.


Subscribe to my newsletter
Read articles from Bruno directly inside your inbox. Subscribe to the newsletter, and don't miss out.
Written by

Bruno
Bruno
Depuis août 2024, j'accompagne divers projets sur l'optimisation des processus DevOps. Ces compétences, acquises par plusieurs années d'expérience dans le domaine de l'IT, me permettent de contribuer de manière significative à la réussite et l'évolution des infrastructures de mes clients. Mon but est d'apporter une expertise technique pour soutenir la mission et les valeurs de mes clients, en garantissant la scalabilité et l'efficacité de leurs services IT.