Why taxi orders fail? EDA 🚗
 Anix Lynch
Table of contents
Download dataset and source code here
Expected Outcome
Understand Failure Reasons: Identify which failure reasons are most common.
Identify Critical Times: Spot times with high failure rates and their causes.
Optimize Cancellation Processes: Improve processes based on average cancellation times.
Improve ETA Predictions: Refine ETA predictions to reduce failures.
Geographical Insights: Visualize problem areas to target improvements.
By achieving these goals, we aim to enhance the overall efficiency of the Gett platform, leading to better service for customers and more successful order completions.
Insights:
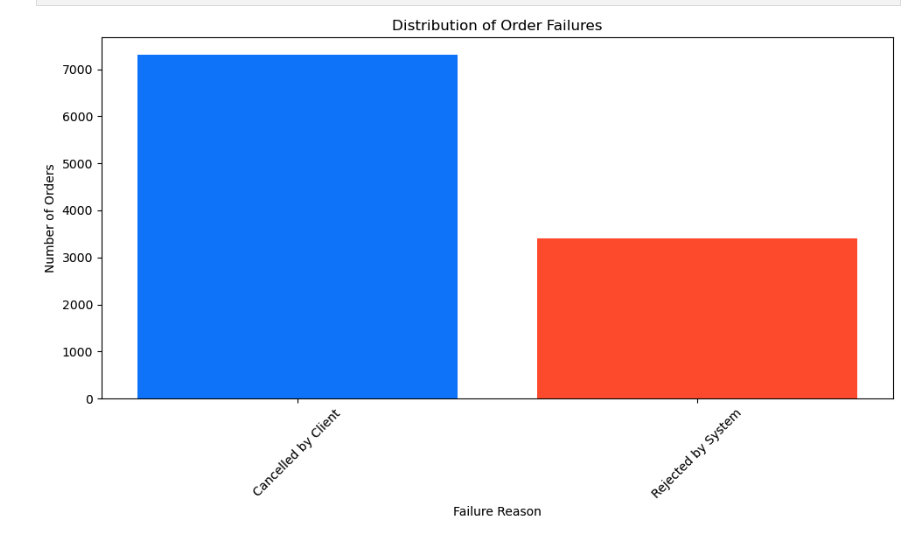
Distribution Analysis of Failures

Which reason for failure is most common --> Cancelled by Client
Number of orders that failed for each reason?
Status Key 4 (Cancelled by Client): 7,307 orders
- Status Key 9 (Rejected by System): 3,409 orders
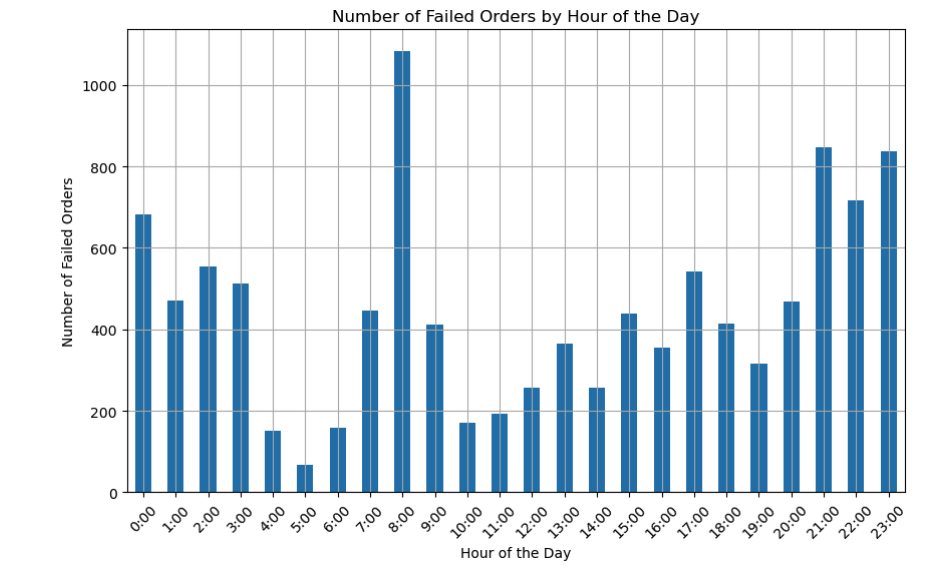
Failure Trends by Hour

- Specific times of the day when orders fail more frequently -> 8am
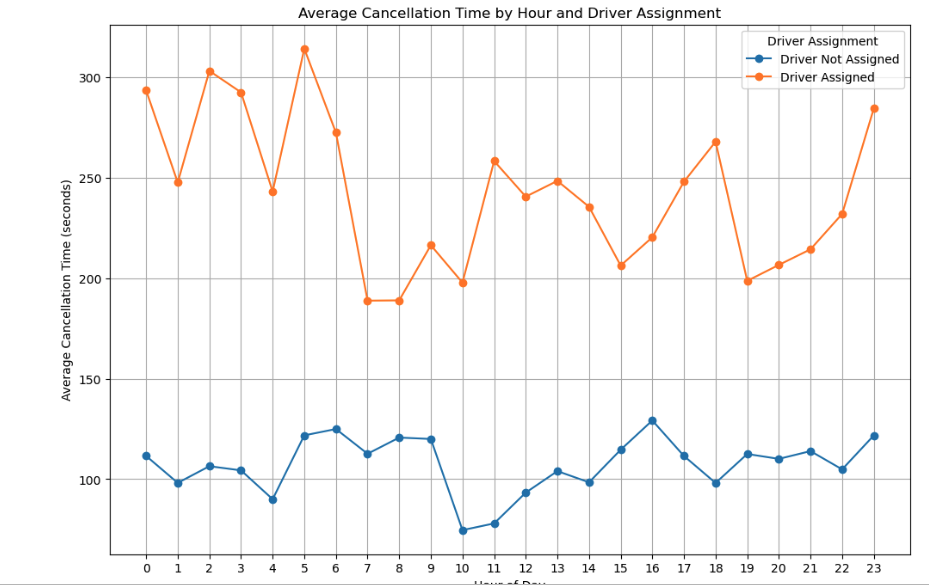
Average Cancellation Time Analysis

Task: Compare the average time it takes for cancellations with and without a driver assigned.
Deliverable: A plot of average cancellation times by hour.
Outcome: Detect any unusual cancellation patterns and outliers.
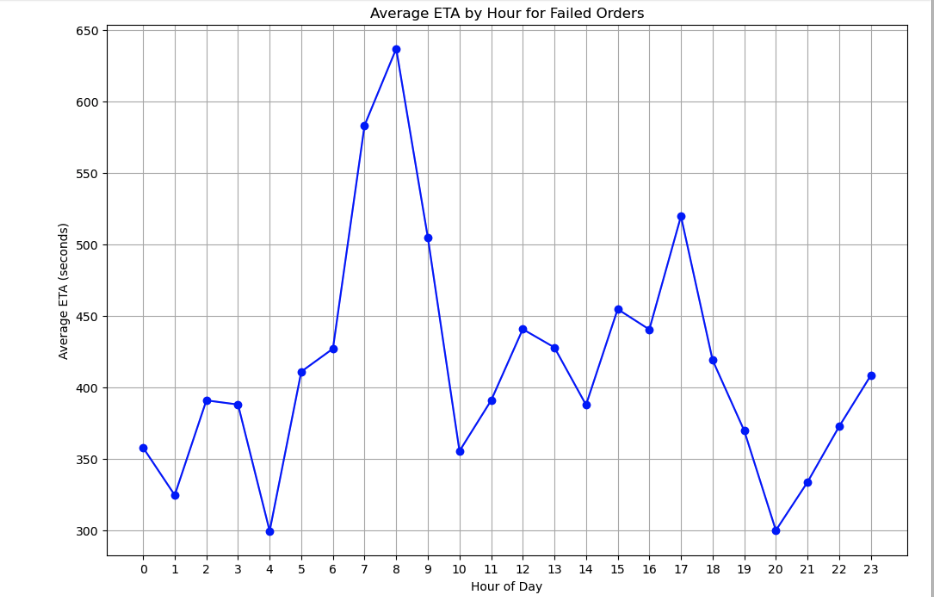
ETA Distribution Analysis

Task: Examine the average estimated time of arrival (ETA) for failed orders.
Deliverable: A plot showing how ETA varies by hour.
Outcome: Understand how ETA influences order failures.
Subscribe to my newsletter
Read articles from Anix Lynch directly inside your inbox. Subscribe to the newsletter, and don't miss out.
Written by
