Docker Scout Sample Project — Prometheus
 Megha Sharma
This is describes how to scrape the metrics endpoint using Prometheus.
🌟 Add a job for your organization:
In the Prometheus configuration file, add a new job for your organization. The job should include the following configuration; replace ORG with your organization name:
scrape_configs:
  - job_name: ORG
    metrics_path: /v1/exporter/org/ORG/metrics
    scheme: https
    static_configs:
      - targets:
          - api.scout.docker.com
The address in the targets field is set to the domain name of the Docker Scout API, api.scout.docker.com. Make sure that there's no firewall rule in place preventing the server from communicating with this endpoint.
🌟 Add bearer token authentication:
To scrape metrics from the Docker Scout Exporter endpoint using Prometheus, you need to configure Prometheus to use the PAT as a bearer token. The exporter requires the PAT to be passed in the Authorization header of the request.
Update the Prometheus configuration file to include the authorization configuration block. This block defines the PAT as a bearer token stored in a file:
scrape_configs:
  - job_name: $ORG
    authorization:
      type: Bearer
      credentials_file: /etc/prometheus/token
The content of the file should be the PAT in plain text:
dckr_pat_...
If you are running Prometheus in a Docker container or Kubernetes pod, mount the file into the container using a volume or secret.
Finally, restart Prometheus to apply the changes.
👉 Prometheus sample project
If you don’t have a Prometheus server set up, you can run a sample project using Docker Compose. The sample includes a Prometheus server that scrapes metrics for a Docker organization enrolled in Docker Scout, alongside Grafana with a pre-configured dashboard to visualize the vulnerability and policy metrics.
🌟 Clone the starter template for bootstrapping a set of Compose services for scraping and visualizing the Docker Scout metrics endpoint:
$ git clone git@github.com:dockersamples/scout-metrics-exporter.git
$ cd scout-metrics-exporter/prometheus
🌟 Create a Docker access token:
Store it in a plain text file at /prometheus/prometheus/token under the template directory.
$ echo $DOCKER_PAT > ./prometheus/token
🌟 In the Prometheus configuration file at /prometheus/prometheus/prometheus.yml, replace ORG in the metrics_path property on line 6 with the namespace of your Docker organization.
$ global:
  scrape_interval: 60s
  scrape_timeout: 40s
scrape_configs:
  - job_name: Docker Scout policy
    metrics_path: /v1/exporter/org/<ORG>/metrics
    scheme: https
    static_configs:
      - targets:
          - api.scout.docker.com
    authorization:
      type: Bearer
      credentials_file: /etc/prometheus/token
🌟 Start the compose services:
$ docker compose up -d
This command starts two services: the Prometheus server and Grafana. Prometheus scrapes metrics from the Docker Scout endpoint, and Grafana visualizes the metrics using a pre-configured dashboard.
🌟 To stop the demo and clean up any resources created, run:
$ docker compose down -v
👉 Access to Prometheus:
After starting the services, you can access the Prometheus expression browser by visiting http://localhost:9090. The Prometheus server runs in a Docker container and is accessible on port 9090.
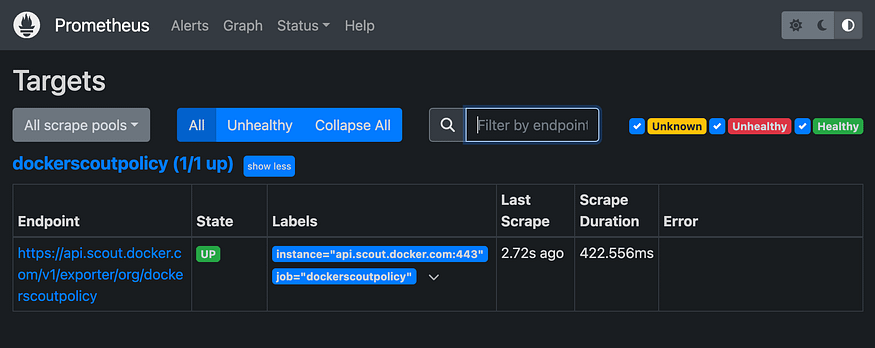
After a few seconds, you should see the metrics endpoint as a target in the Prometheus UI at http://localhost:9090/targets.

Docker Scout metrics exporter Prometheus target.
👉 Viewing the metrics in Grafana:
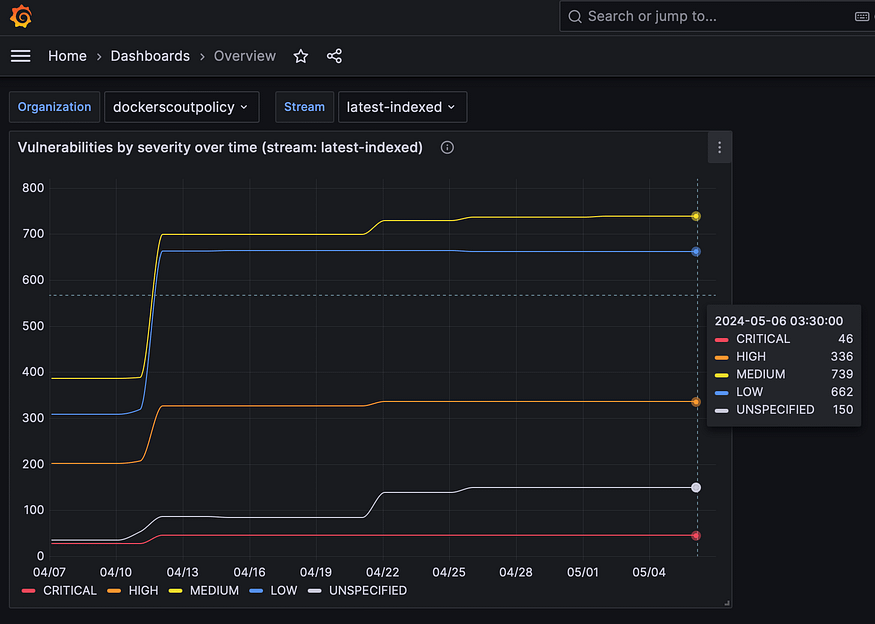
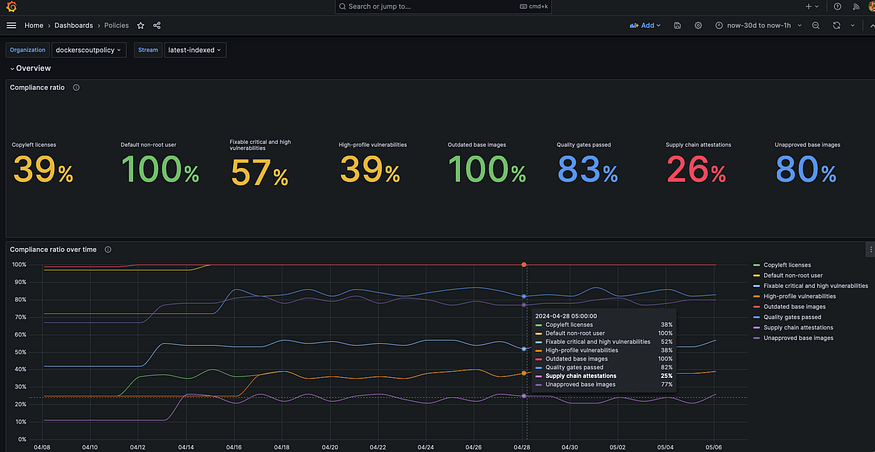
To view the Grafana dashboards, go to http://localhost:3000/dashboards, and sign in using the credentials defined in the Docker Compose file (username: admin, password: grafana).
Vulnerability dashboard in Grafana:

Policy dashboard in Grafana:

The dashboards are pre-configured to visualize the vulnerability and policy metrics scraped by Prometheus.
Subscribe to my newsletter
Read articles from Megha Sharma directly inside your inbox. Subscribe to the newsletter, and don't miss out.
Written by

Megha Sharma
Megha Sharma
👋 Hi there! I'm a DevOps enthusiast with a deep passion for all things Cloud Native. I thrive on learning and exploring new technologies, always eager to expand my knowledge and skills. Let's connect, collaborate, and grow together as we navigate the ever-evolving tech landscape! SKILLS: 🔹 Languages & Runtimes: Python, Shell Scripting, YAML 🔹 Cloud Technologies: AWS, Microsoft Azure, GCP 🔹 Infrastructure Tools: Docker, Terraform, AWS CloudFormation 🔹 Other Tools: Linux, Git and GitHub, Jenkins, Docker, Kubernetes, Ansible, Prometheus, Grafana