Day 44: AWS Route 53 Health Checks: A Comprehensive Guide🩺
 Shailesh
Introduction
AWS Route 53 is not just a DNS service; it also provides health checking and DNS failover capabilities. These features ensure that your application remains available and performant by routing traffic only to healthy endpoints. In this blog post, we will explore Route 53 health checks in detail, including their configuration and usage.
What are Route 53 Health Checks?🩺
Health checks in Route 53 monitor the health and performance of your web applications and services. They are used to:
Verify Endpoint Health: Ensure that your endpoints (such as web servers, databases, etc.) are functioning correctly.
Route Traffic: Route traffic to healthy endpoints only.
Trigger Alarms: Integrate with CloudWatch to trigger alarms when an endpoint is unhealthy.
Types of Health Checks📊
HTTP/HTTPS Health Checks: Monitor the health of web servers by sending HTTP or HTTPS requests.
TCP Health Checks: Verify if a TCP port on an endpoint is reachable.
Calculated Health Checks: Combine the results of multiple health checks into a single status.
Step-by-Step Guide to Configuring Route 53 Health Checks⚙
Step 1: Access Route 53 in the AWS Management Console
Log in to your AWS Management Console.
Navigate to Services and select Route 53 under the Networking & Content Delivery category.
Step 2: Create a Health Check
In the Route 53 dashboard, click on Health Checks in the left navigation pane.
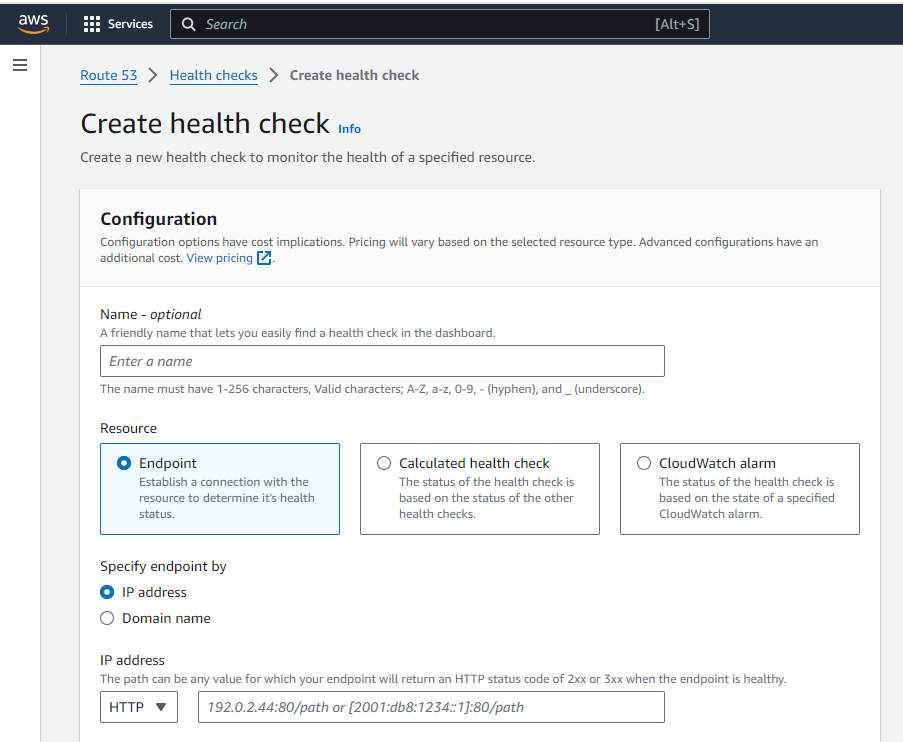
Click the Create health check button.

Step 3: Configure Health Check Details
Define the Endpoint:
Specify the domain name or IP address of the endpoint you want to monitor.
Select the protocol (HTTP, HTTPS, or TCP) and specify the port.
For HTTP/HTTPS checks, provide the path to the resource (e.g.,
/index.html).

Request Interval and Failure Threshold:
Set the Request interval (default is 30 seconds).
Define the Failure threshold (number of consecutive failed requests before considering the endpoint unhealthy).

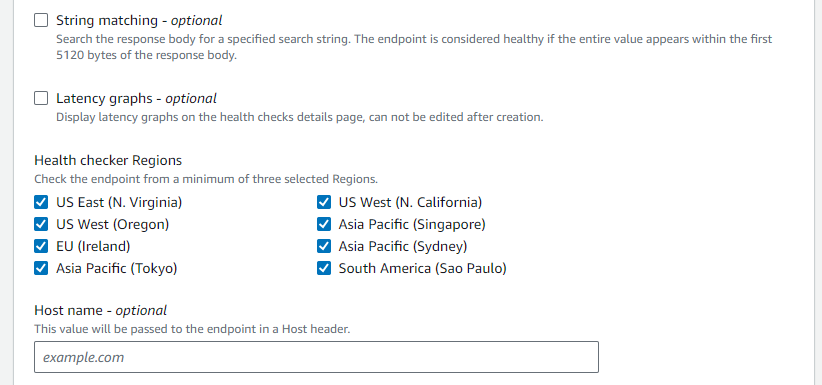
Advanced Configuration (Optional):
String Matching: Check for a specific string in the response body.
Health Check Regions: Select regions from which Route 53 will perform health checks.

Step 4: Review and Create
Review your configuration settings.
Click Create health check to finalize and activate the health check.
Checking the Status of Health Checks
Health Check Dashboard: Once created, you can monitor the status of your health checks in the Route 53 dashboard under Health Checks.
Status Indicators: The health check status is displayed as green (healthy) or red (unhealthy).
Logs and Metrics: View detailed logs and metrics in CloudWatch for deeper insights into health check performance.
Conclusion💡
Route 53 health checks are an essential feature for maintaining the reliability and availability of your applications. By ensuring traffic is routed only to healthy endpoints and integrating with CloudWatch for monitoring, you can proactively manage your application's health.🩺
Subscribe to my newsletter
Read articles from Shailesh directly inside your inbox. Subscribe to the newsletter, and don't miss out.
Written by

Shailesh
Shailesh
As a Solution Architect, I am responsible for designing and implementing scalable, secure, and efficient IT solutions. My key responsibilities include: 🔸Analysing business requirements and translating them into technical solutions. 🔸Developing comprehensive architectural plans to meet organizational goals. 🔸Ensuring seamless integration of new technologies with existing systems. 🔸Overseeing the implementation of projects to ensure alignment with design. 🔸Providing technical leadership and guidance to development teams. 🔸Conducting performance assessments and optimizing solutions for efficiency. 🔸Maintaining a keen focus on security, compliance, and best practices. Actively exploring new technologies and continuously refining strategies to drive innovation and excellence.