Discovering Grafana Tempo
 Bruno
Bruno
Overview
This is a second article of a LGTM Stack serie.
You must have followed the first LGTM Stack article to begin and complete successfully this topic.
All these examples are based on Docker containers.
This topic aims to discover the very basics of Grafana Tempo.
It guides you through installing Grafana Tempo and some other tools via the official Docker images for testing purpose.
But what is Grafana Tempo ?
Tempo is a component of LGTM stack.
Tempo is a tracing backend.
As explained in this link, a trace gives us the big picture of what happens when a request is made to an application. Whether your application is a monolith with a single database or a sophisticated mesh of services, traces are essential to understanding the full “path” a request takes in your application.
To understand this topic, you need to know some opentelemetry concepts. Please refer to the above link to learn these.
In this demo, we'll install the following components :
MinIO as a Tempo traces storage
OpenTelemetry collector
Grafana Tempo as traces backend
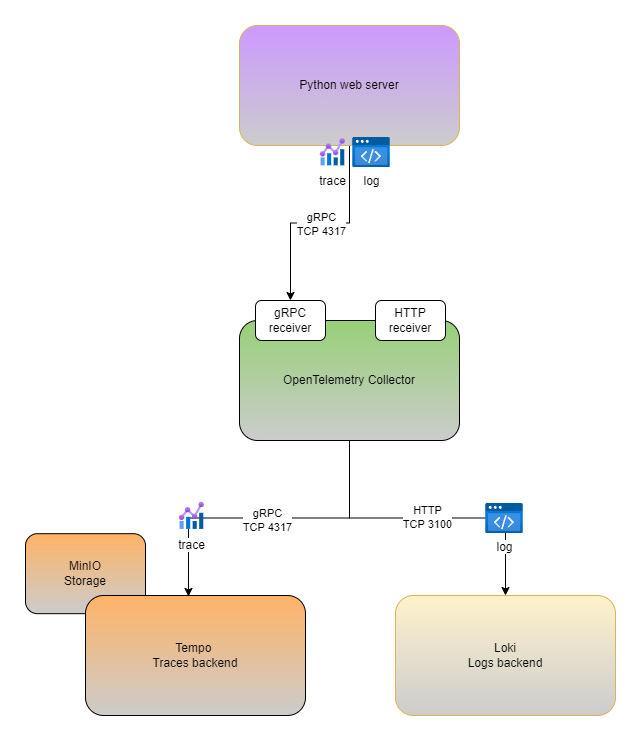
Here we go !
Install Opentelemetry collector
To make a system observable, it must be instrumented.
That is, the code must emit traces, metrics, or logs. The instrumented data must then be sent to an observability backend.
First, let's create a hierarchy folders and collector config file.
$ cd && mkdir -p opentelemetry_demo/{otelcol,tempo,python} && cd opentelemetry_demo/otelcol
$ cat << EOF >> config.yaml
receivers:
  otlp:
    protocols:
      grpc:
        endpoint: 0.0.0.0:4317
      http:
        endpoint: 0.0.0.0:4318

processors:
  batch:

exporters:
  otlp:
    endpoint: tempo:4317
    tls:
      insecure: true
  otlphttp:
    endpoint: http://loki:3100/otlp

extensions:
  health_check:
  pprof:
  zpages:

service:
  extensions: [health_check, pprof, zpages]
  pipelines:
    traces:
      receivers: [otlp]
      processors: [batch]
      exporters: [otlp]
    logs:
      receivers: [otlp]
      processors: [batch]
      exporters: [otlphttp]
EOF
We are ready to create and run OpenTelemetry container
$ docker run -d \
  --name=otelco \
  --hostname=otelco \
  --network=lgtm \
  -p 4317:4317 \
  -p 4318:4318 \
  -v $(pwd)/config.yaml:/etc/otelcol-contrib/config.yaml \
  otel/opentelemetry-collector-contrib:0.105.0
Install MinIO as Tempo storage
MinIO is a high-performance, S3 compatible object store.
In this case, MinIO will store generated traces.
$ docker run -d \
  --name=minio \
  --hostname=minio \
  --network=lgtm \
  -p 9000:9000 \
  -p 9001:9001 \
  quay.io/minio/minio \
  server /data --console-address ":9001"
Let's create a bucket and an access key.
To complete these steps, we install MinIO client CLI.
# Install minio client
$ curl https://dl.min.io/client/mc/release/linux-amd64/mc \
  --create-dirs \
  -o $HOME/minio-binaries/mc
$ chmod +x $HOME/minio-binaries/mc
$ export PATH=$PATH:$HOME/minio-binaries/
$ mc alias set myminio http://127.0.0.1:9000/ minioadmin minioadmin
$ mc admin info myminio/
●  127.0.0.1:9000
   Uptime: 2 hours
   Version: 2024-07-16T23:46:41Z
   Network: 1/1 OK
   Drives: 1/1 OK
   Pool: 1

┌──────┬───────────────────────┬─────────────────────┬──────────────┐
│ Pool │ Drives Usage          │ Erasure stripe size │ Erasure sets │
│ 1st  │ 2.0% (total: 956 GiB) │ 1                   │ 1            │
└──────┴───────────────────────┴─────────────────────┴──────────────┘

1.5 MiB Used, 1 Bucket, 52 Objects, 150 Versions, 30 Delete Markers
1 drive online, 0 drives offline, EC:0
Done !
We can now create a bucket.
$ mc mb --with-versioning myminio/traces-data
Bucket created successfully `myminio/traces-data`.
Finally, create an Access Key and a Secret Key that will be using by Tempo to store traces.
$ mc admin user svcacct add myminio/ minioadmin
Access Key: 31L8FUKUZGVMZ215AXOL
Secret Key: YPFXxy4gM1D2IPtl2MadxSErcwAcCFe8ZXrlB0jN
Expiration: no-expiry
Copy Access Key and Secret Key and paste them to the below config file.
Install Tempo as traces backend
$ cd ~/opentelemetry_demo/tempo
$ cat << EOF >> config.yaml
server:
  http_listen_port: 3200

distributor:
  receivers:
      otlp:
        protocols:
          http:
          grpc:

compactor:
  compaction:
    block_retention: 48h # configure total trace retention here

storage:
  trace:
    backend: s3
    s3:
      endpoint: minio:9000
      bucket: traces-data
      forcepathstyle: true
      # set to false if endpoint is https
      insecure: true
      access_key: 31L8FUKUZGVMZ215AXOL
      secret_key: YPFXxy4gM1D2IPtl2MadxSErcwAcCFe8ZXrlB0jN
    wal:
      path: /var/tempo/wal # where to store the wal locally
    local:
      path: /var/tempo/blocks
overrides:
  metrics_generator_processors: [service-graphs, span-metrics] # enables metrics generator
EOF
Create and run Tempo Docker container
$ docker run -d \
  --name=tempo \
  --hostname=tempo \
  --network=lgtm \
  -p 3200:3200 \
  -v $(pwd)/config.yaml:/etc/tempo/config.yaml \
  grafana/tempo:main-374c600 \
  -config.file=/etc/tempo/config.yaml
Configure Grafana
Next, we’ll add a data source to Grafana to view and explore the future traces.
Grafana listens on port 3000 and the default credentials are admin:admin.
You can now access to Grafana GUI by entering http://127.0.0.1:3100 in your browser (Supposing you are on the same host you've installed Docker daemon).
Log in to the Grafana GUI and select Connections > Add new connection on the to left sandwich menu.
Search tempo and select it.
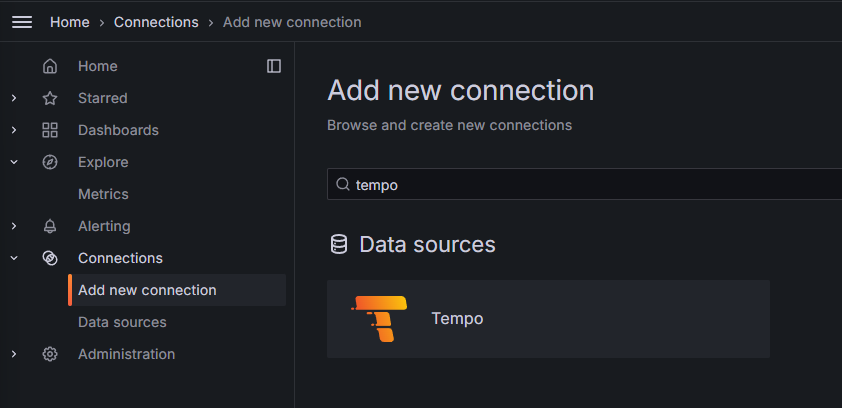
Click on the top right button Add new data source
Fill in these fields :
Name: Tempo
URL : http://tempo:3200
Keep the other fields by default.
And click on Save & test button.

Python web server
It's time to send some traces.
To perform this task, we use a simple Python web server.
We are using virtualenv to complete the following steps.
Please install it before to continue.
virtualenvwrapper is a set of extensions to Ian Bicking’s virtualenv tool. The extensions include wrappers for creating and deleting virtual environments and otherwise managing your development workflow, making it easier to work on more than one project at a time without introducing conflicts in their dependencies.
$ mkvirtualenv opentelemetry
$ pip install flask
$ pip install opentelemetry-distro opentelemetry-instrumentation opentelemetry-exporter-otlp
$ opentelemetry-bootstrap -a install
$ export OTEL_TRACES_EXPORTER=otlp
$ export OTEL_EXPORTER_OTLP_ENDPOINT="http://localhost:4317"
$ export OTEL_EXPORTER_LOGS_ENDPOINT="http://localhost:4317"
$ export OTEL_EXPORTER_METRICS_ENDPOINT=""
$ export OTEL_PYTHON_LOGGING_AUTO_INSTRUMENTATION_ENABLED=true
$ cd ~/opentelemetry_demo/python
$ cat << EOF >> app.py
from flask import Flask

app = Flask(__name__)

@app.route('/')
def index():
    return 'Hello World'

if __name__ == '__main__':
    app.run(debug=True, host='0.0.0.0')
EOF
Now, we are ready to launch our demo Python web server.
$ opentelemetry-instrument \
  --service_name flask-sample-server \
  --traces_exporter console,otlp \
  --logs_exporter console,otlp \
--metrics_exporter none \
  flask run
Now, every logs and traces of this Python application are send to our Opentelemetry collector and transfers to their different exporters.
Test the stack
Send one or more requests to generate logs & traces.
$ curl http://127.0.0.1:5000
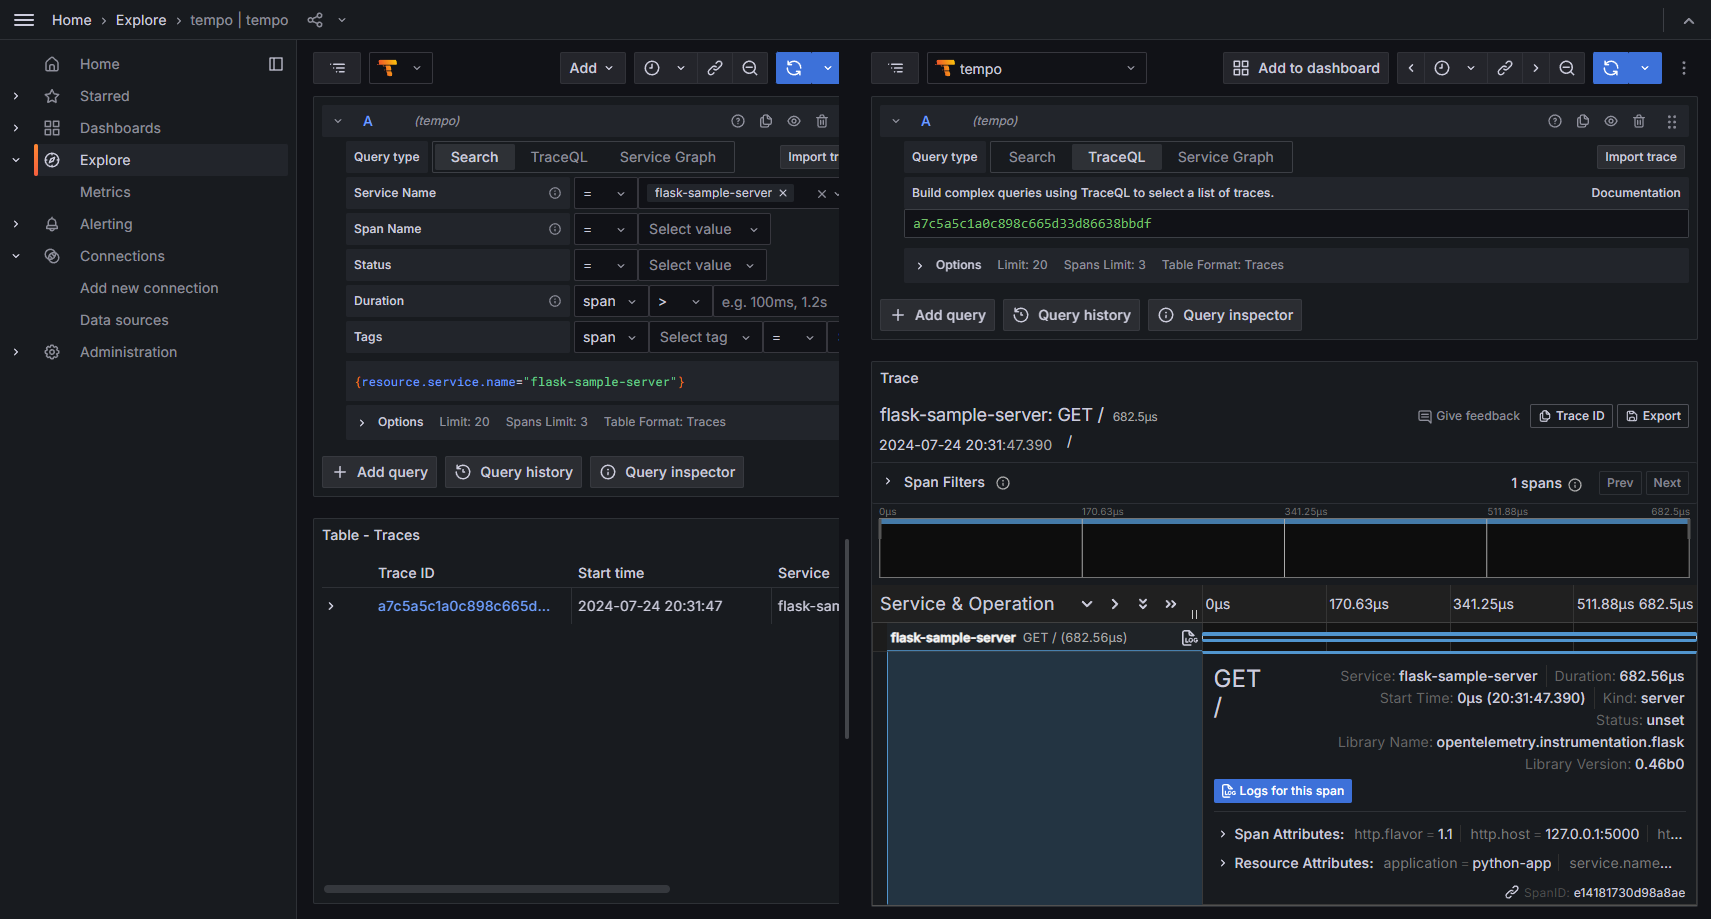
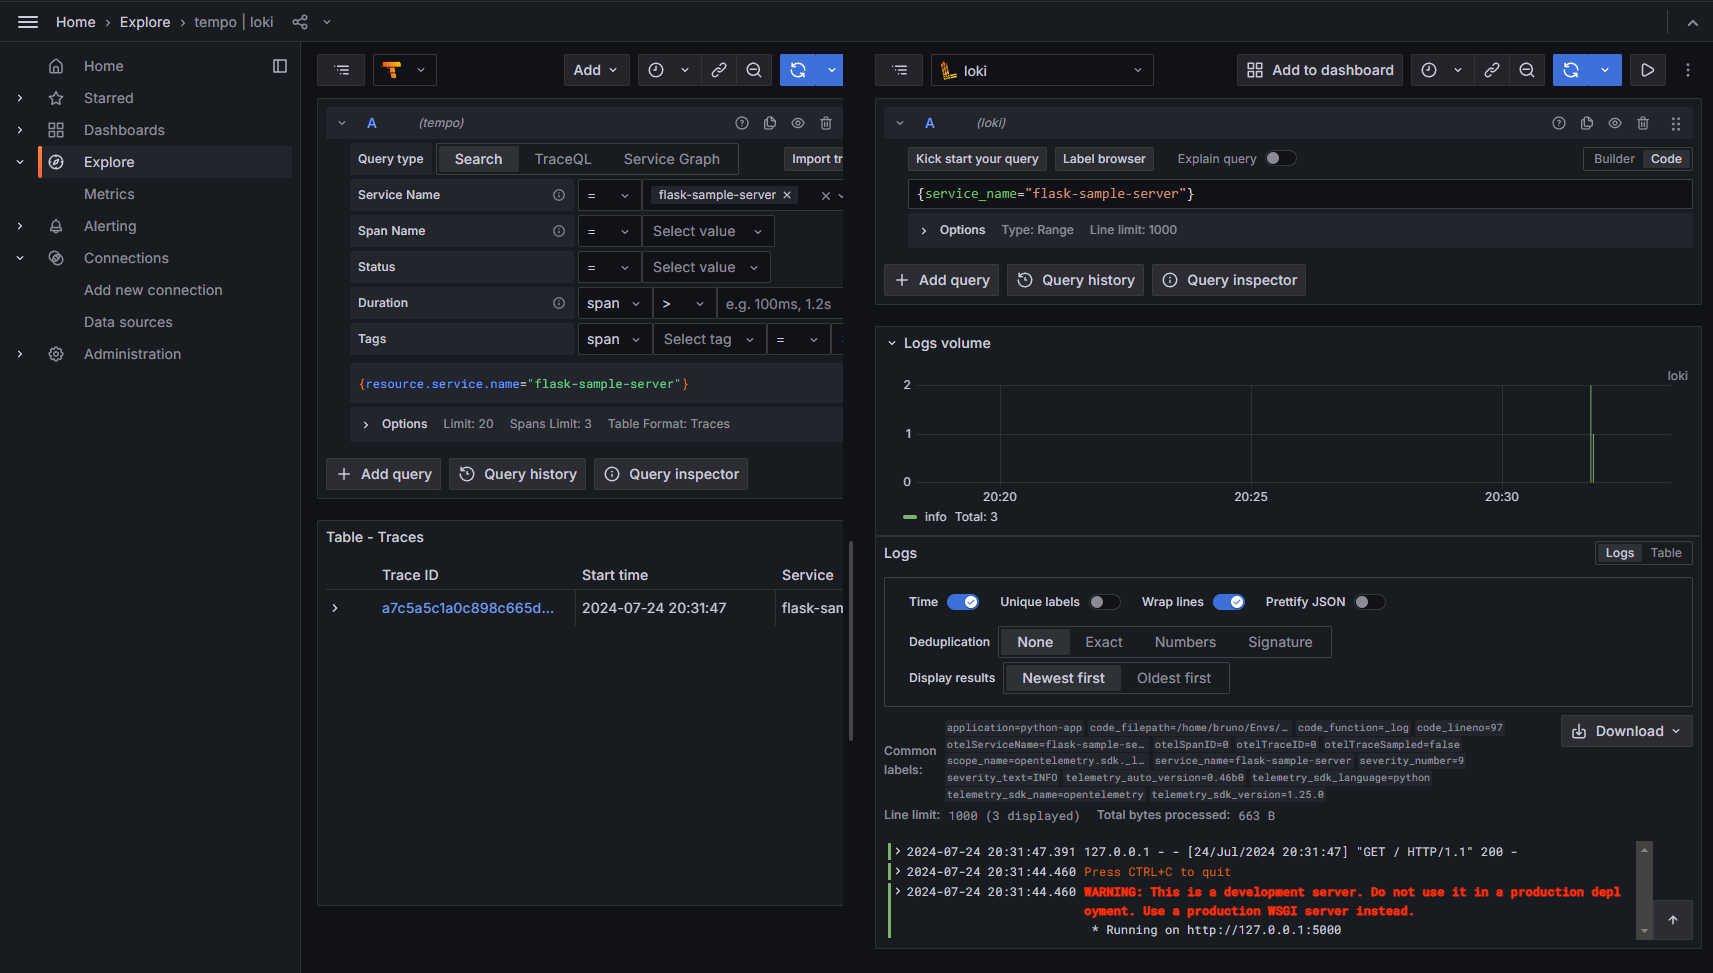
You should see some traces and logs in Grafana :
Context Propagation
Next, let's play with context propagation.
Context Propagation is the core concept that enables Distributed Tracing. With Context Propagation, Spans can be correlated with each other and assembled into a trace, regardless of where Spans are generated.
To perform this feature, we'll install Kong Gateway.
Kong Gateway is a lightweight, fast, and flexible cloud-native API gateway.
An API gateway is a reverse proxy that lets you manage, configure, and route requests to your APIs.
We have to create 2 environment variables to enable the OpenTelemetry tracing capability in Kong Gateway : KONG_TRACING_INSTRUMENTATIONS=all & KONG_TRACING_SAMPLING_RATE=1.0
The following commands will prepare and install Kong Gateway to a Docker containers.
$ docker run -d \
   --name kong-database \
   --network=lgtm \
   -p 5432:5432 \
   -e "POSTGRES_USER=kong" \
   -e "POSTGRES_DB=kong" \
   -e "POSTGRES_PASSWORD=kongpass" \
   postgres:13

$ docker run --rm \
  --network=lgtm \
  -e "KONG_DATABASE=postgres" \
  -e "KONG_PG_HOST=kong-database" \
  -e "KONG_PG_PASSWORD=kongpass" \
  kong/kong-gateway:3.7.1.2 kong migrations bootstrap

$ docker run -d --name kong-gateway \
  --network=lgtm \
  -e "KONG_DATABASE=postgres" \
  -e "KONG_PG_HOST=kong-database" \
  -e "KONG_PG_USER=kong" \
  -e "KONG_PG_PASSWORD=kongpass" \
  -e "KONG_TRACING_INSTRUMENTATIONS=all" \
  -e "KONG_TRACING_SAMPLING_RATE=1.0" \
  -e "KONG_PROXY_ACCESS_LOG=/dev/stdout" \
  -e "KONG_ADMIN_ACCESS_LOG=/dev/stdout" \
  -e "KONG_PROXY_ERROR_LOG=/dev/stderr" \
  -e "KONG_ADMIN_ERROR_LOG=/dev/stderr" \
  -e "KONG_ADMIN_LISTEN=0.0.0.0:8001" \
  -e "KONG_ADMIN_GUI_URL=http://127.0.0.1:8002" \
  -e KONG_LICENSE_DATA \
  -p 8000:8000 \
  -p 8443:8443 \
  -p 8001:8001 \
  -p 8444:8444 \
  -p 8002:8002 \
  -p 8445:8445 \
  -p 8003:8003 \
  -p 8004:8004 \
  kong/kong-gateway:3.7.1.2
And enable the plugin:
$ curl -X POST http://localhost:8001/plugins \
    -H 'Content-Type: application/json' \
    -d '{
      "name": "opentelemetry",
      "config": {
        "endpoint": "http://otelco:4318/v1/traces",
        "resource_attributes": {
          "service.name": "kong-dev"
        }
      }
    }'
We'll use our NGINX container created on the first LGTM topic.
The NGINX container will be the upstream server.

Create the service and the route on Kong container
$ curl -i -s -X POST http://localhost:8001/services \
  --data name=nginx_service \
  --data url='http://nginx'
$ curl -i -X POST http://localhost:8001/services/nginx_service/routes \
  --data 'paths[]=/nginx' \
  --data name=nginx_route
We also need to make some changes on NGINX container.
We'll make these changes directly on the container.
$ docker exec -ti nginx bash
root@nginx: apt update && apt install -y curl vim gnupg2 ca-certificates lsb-release debian-archive-keyring
root@nginx: curl https://nginx.org/keys/nginx_signing.key | gpg --dearmor \
  | tee /usr/share/keyrings/nginx-archive-keyring.gpg >/dev/null
root@nginx: echo "deb [signed-by=/usr/share/keyrings/nginx-archive-keyring.gpg] \
http://nginx.org/packages/mainline/debian `lsb_release -cs` nginx" \
  | tee /etc/apt/sources.list.d/nginx.list
root@nginx: apt update && apt install -y nginx-module-otel
Edit /etc/nginx/nginx.conf by adding these parameters :
[...]
load_module modules/ngx_otel_module.so;
[...]
http {
[...]
    otel_exporter {
        endpoint otelco:4317;
    }
    otel_service_name nginx_upstream;
    otel_trace on;
[...]
}
The file should be like this :
user  nginx;
worker_processes  auto;
load_module modules/ngx_otel_module.so;

error_log  /var/log/nginx/error.log notice;
pid        /var/run/nginx.pid;


events {
    worker_connections  1024;
}


http {
    include       /etc/nginx/mime.types;
    default_type  application/octet-stream;

    log_format  main  '$remote_addr - $remote_user [$time_local] "$request" '
                      '$status $body_bytes_sent "$http_referer" '
                      '"$http_user_agent" "$http_x_forwarded_for"';

    access_log  /var/log/nginx/access.log  main;

    sendfile        on;
    #tcp_nopush     on;

    keepalive_timeout  65;

    #gzip  on;

    otel_exporter {
        endpoint otelco:4317;
    }
    otel_service_name nginx_upstream;
    otel_trace on;

    include /etc/nginx/conf.d/*.conf;
}
Finally, edit /etc/nginx/conf.d/default.conf to activate parent-based tracing.
[...]
    location / {
        otel_trace $otel_parent_sampled;
        otel_trace_context propagate;
    }
[...]
The file should be like this :
server {
    listen       80;
    listen  [::]:80;
    server_name  localhost;

    #access_log  /var/log/nginx/host.access.log  main;

    location / {
        root   /usr/share/nginx/html;
        index  index.html index.htm;
        otel_trace $otel_parent_sampled;
        otel_trace_context propagate;
    }

    #error_page  404              /404.html;

    # redirect server error pages to the static page /50x.html
    #
    error_page   500 502 503 504  /50x.html;
    location = /50x.html {
        root   /usr/share/nginx/html;
    }

    # proxy the PHP scripts to Apache listening on 127.0.0.1:80
    #
    #location ~ \.php$ {
    #    proxy_pass   http://127.0.0.1;
    #}

    # pass the PHP scripts to FastCGI server listening on 127.0.0.1:9000
    #
    #location ~ \.php$ {
    #    root           html;
    #    fastcgi_pass   127.0.0.1:9000;
    #    fastcgi_index  index.php;
    #    fastcgi_param  SCRIPT_FILENAME  /scripts$fastcgi_script_name;
    #    include        fastcgi_params;
    #}

    # deny access to .htaccess files, if Apache's document root
    # concurs with nginx's one
    #
    #location ~ /\.ht {
    #    deny  all;
    #}
}
Restart NGINX container
$ docker restart nginx
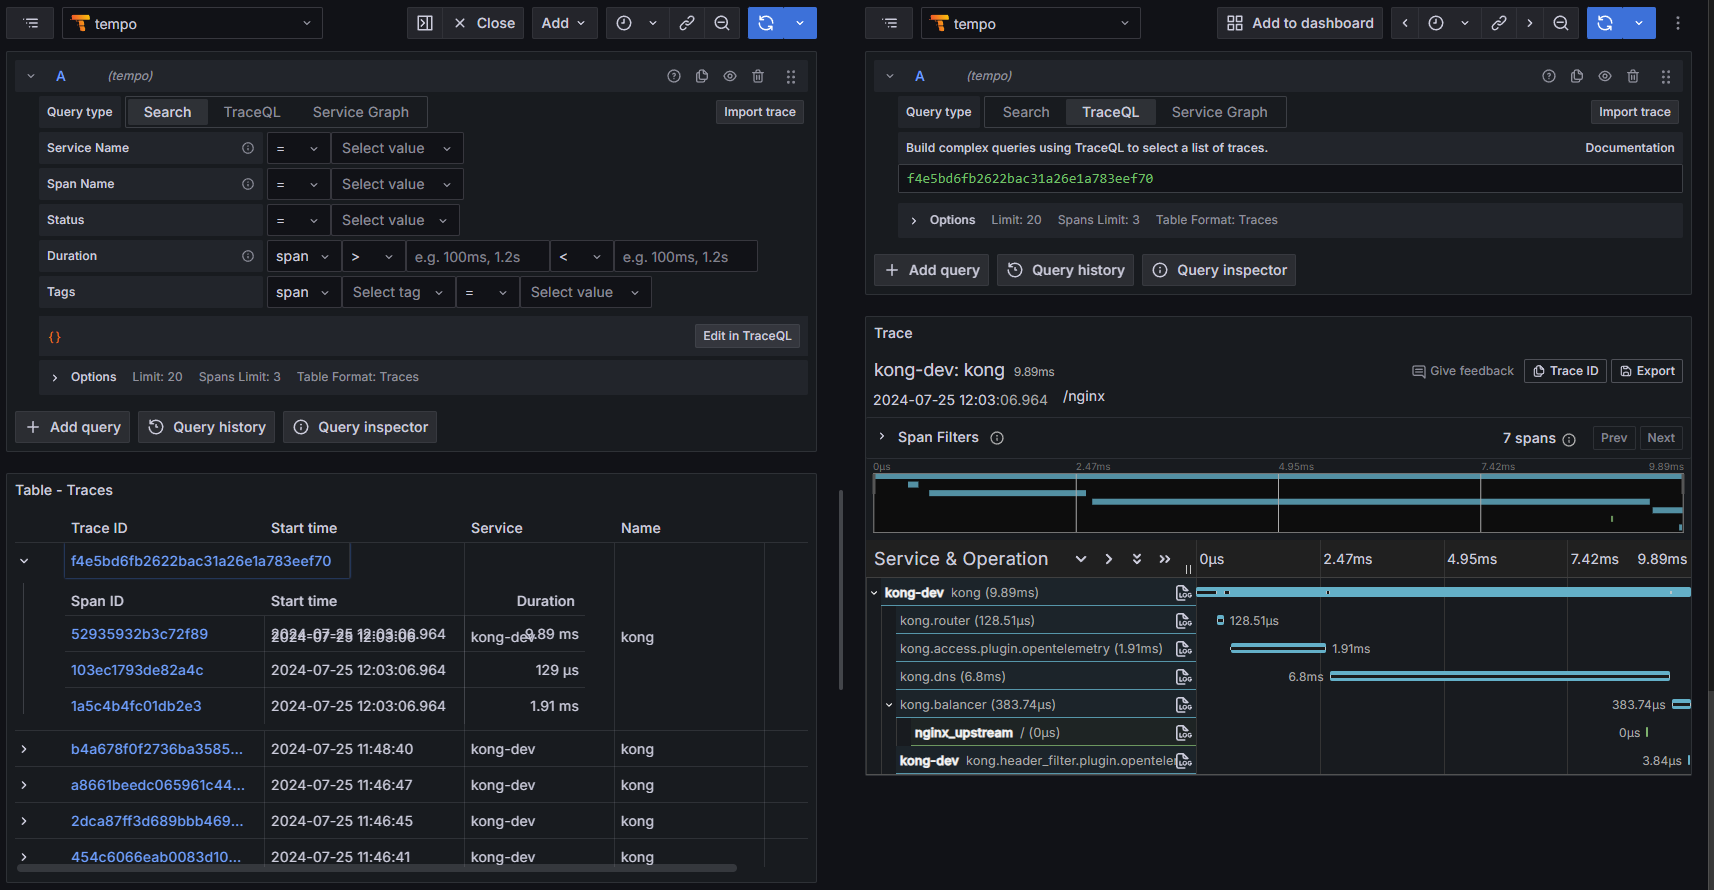
Send one or more requests to Kong Gateway to request NGINX upstream and generate traces.
$ curl -X GET http://localhost:8000/nginx/
It's time to take a look to Grafana.
Sources :
https://opentelemetry.io/docs/zero-code/python/configuration/
https://docs.konghq.com/hub/kong-inc/opentelemetry/
https://github.com/nginxinc/nginx-otel?tab=readme-ov-file
Subscribe to my newsletter
Read articles from Bruno directly inside your inbox. Subscribe to the newsletter, and don't miss out.
Written by

Bruno
Bruno
Depuis août 2024, j'accompagne divers projets sur l'optimisation des processus DevOps. Ces compétences, acquises par plusieurs années d'expérience dans le domaine de l'IT, me permettent de contribuer de manière significative à la réussite et l'évolution des infrastructures de mes clients. Mon but est d'apporter une expertise technique pour soutenir la mission et les valeurs de mes clients, en garantissant la scalabilité et l'efficacité de leurs services IT.