Quick Start to Monitoring, Alerting, and Logging in Kubernetes with Helm
 Suraj
Suraj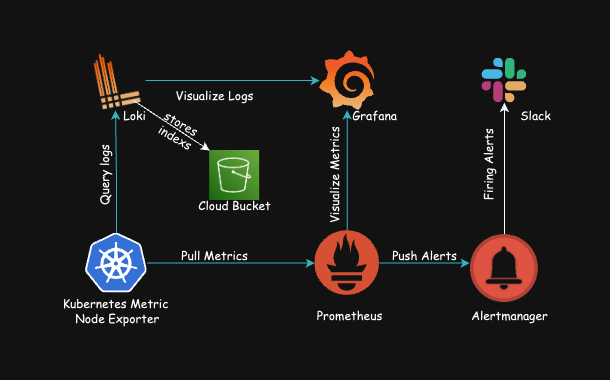
Managing the health and activities of your Kubernetes cluster is essential for its efficient operation. This guide provides a straightforward approach to setting up monitoring, alerting, and logging using Helm, tailored for cloud environments such as AWS EKS, Azure AKS, and GCP GKE. This setup includes comprehensive log management.
Prerequisites
Before you start, make sure that you have a Kubernetes cluster active (like AKS, EKS, or GKE) and Helm installed on your system.
Setup Steps
1. Create a Namespace for Monitoring
Purpose: Isolates monitoring resources from other cluster activities.
kubectl create namespace monitoring
2. Add Helm Repositories
Purpose: Adds the Prometheus community charts necessary for our monitoring setup.
Kube-Prometheus-stack, also known as Prometheus Operator, is a renowned open-source project providing complete monitoring solutions for Kubernetes clusters. It combines several tools and components to create an integrated monitoring stack.
helm repo add prometheus-community https://prometheus-community.github.io/helm-charts
helm repo update
3. Deploy Prometheus, Alertmanager, and Grafana
Purpose: Installs Prometheus for monitoring and alerting, and Grafana for visualizing the data.
First, save the kube-prometheus-stack-values.yaml locally for future modifications:
helm show values prometheus-community/kube-prometheus-stack >> kube-prometheus-stack-values.yaml
Update the kube-prometheus-stack-values.yaml file to change the default Grafana password and adjust selectors (rule, service monitor, pod monitor, and scrape config) to have independent configurations not based on Helm values:
grafana:
  adminPassword: 'ThisIsARanDomPassword'  # Replace with your desired Grafana admin user password
prometheus:
  prometheusSpec:
    ruleSelectorNilUsesHelmValues: false
    serviceMonitorSelectorNilUsesHelmValues: false
    podMonitorSelectorNilUsesHelmValues: false
    probeSelectorNilUsesHelmValues: false
    scrapeConfigSelectorNilUsesHelmValues: false
Run the Helm deployment command:
helm upgrade --install -f kube-prometheus-stack-values.yaml kube-prometheus-stack prometheus-community/kube-prometheus-stack -n monitoring --version 58.5.3
Access the applications locally after deployment:
Grafana:
  kubectl port-forward svc/kube-prometheus-stack-grafana 3000:80 -n monitoring
  # Go to http://localhost:3000
Prometheus:
  kubectl port-forward svc/prometheus-operated 9090:9090 -n monitoring
  # Go to http://localhost:9090
AlertManager:
  kubectl port-forward svc/alertmanager-operated 9093:9093 -n monitoring
  # Go to http://localhost:9093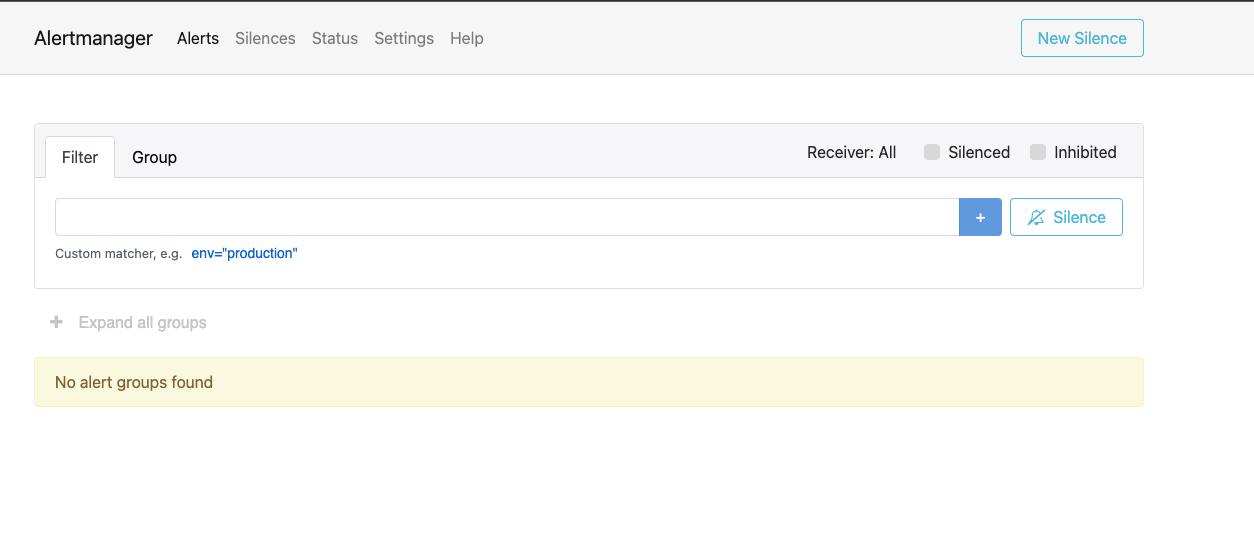
4. Install Loki and Promtail for Logs
Purpose: Loki manages logs, and Promtail sends those logs to Loki.
helm repo add grafana https://grafana.github.io/helm-charts
helm repo update
helm show values grafana/loki-distributed >> loki-values.yaml
helm show values grafana/promtail >> promtail.yaml
Update the loki-values.yaml according to your specific cloud storage (Azure Blob Storage, AWS S3 Bucket, or GCP Cloud Storage), then deploy:
For Azure Blob Storage
  schemaConfig:
      configs:
          - from: "2020-07-01"
            store: boltdb-shipper
            object_store: azure
            schema: v11
            index:
              prefix: loki_index_
              period: 24h
            chunks:
              prefix: loki_chunk
              period: 24h
  storageConfig:
      boltdb_shipper:
          shared_store: azure
          active_index_directory: /var/loki/index
          cache_location: /var/loki/cache
          cache_ttl: 24h
      filesystem:
          directory: /var/loki/chunks
      azure:
        container_name: ********* #replace with your Azure_container_blob_name
        account_name: ********* #replace with your Azure_Azzount_name
        account_key: ********* #replace with your Azure_account_key
        request_timeout: 0
For AWS S3 Bucket
  schemaConfig:
    configs:
    - chunks:
        period: 24h
        prefix: loki_chunk
      from: "2020-07-01"
      index:
        period: 24h
        prefix: loki_
      object_store: aws
      schema: v11
      store: boltdb-shipper
  server:
    http_listen_port: 3100
  serviceAnnotations: {}
  storageConfig:
    aws:
      access_key_id: ********* #replace with your AWS_Access_Key_Id
      bucketnames: loki-index # replace with your bucket name
      endpoint: https://s3.us-east-1.amazonaws.com # replace with your bucket region
      insecure: false
      region: us-east-1 #replace your bucket region
      s3: s3://loki-index #replace your bucket name
      s3forcepathstyle: true
      secret_access_key: ********* #replace with your AWS_Secret_Access_Key
      sse_encryption: false
    boltdb_shipper:
      active_index_directory: /var/loki/index
      cache_location: /var/loki/cache
      cache_ttl: 24h
      shared_store: s3
    filesystem:
      directory: /var/loki/chunks
  structuredConfig: {}
For GCP Cloud Storage
schemaConfig:
  configs:
    - from: "2020-07-01"
      store: boltdb-shipper
      object_store: gcs
      schema: v11
      index:
        prefix: loki_index_
        period: 24h
      chunks:
        prefix: loki_chunk_
        period: 24h

storageConfig:
  boltdb_shipper:
    shared_store: gcs
    active_index_directory: /var/loki/index
    cache_location: /var/loki/cache
    cache_ttl: 24h

  filesystem:
    directory: /var/loki/chunks

  gcs:
    bucket_name: ********* #replace with your GCP_bucket_name
    credentials_file: ********* #replace with path to your GCP_credentials_file
    request_timeout: 0
After updating yaml with your cloud as mentioned above, you can now install loki and promtail as below:
helm upgrade --install -f loki-values.yaml loki grafana/loki-distributed -n monitoring
helm upgrade --install -f promtail.yaml promtail grafana/promtail -n monitoring
Updatingkube-prometheus-stack-values.yaml to include Loki as a datasource.
grafana:
  additionalDataSources:
  - access: proxy
    name: Loki
    type: loki
    url: http://loki-loki-distributed-gateway.monitoring.svc.cluster.local
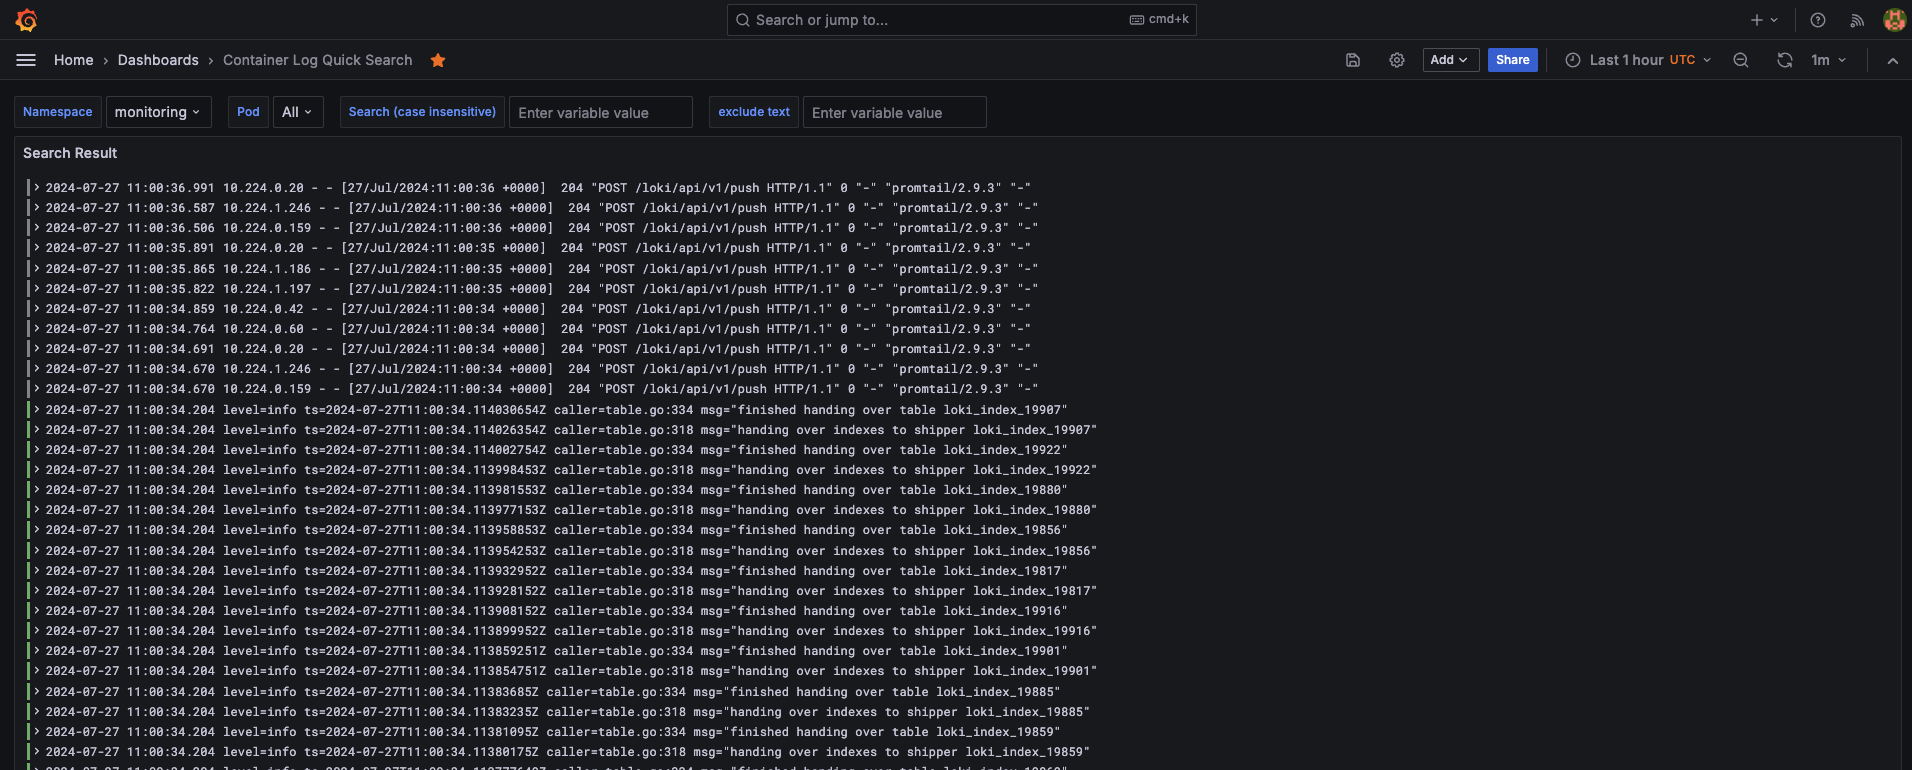
you can see all your cluster pods logs in this dashboard link or import this loki dashboard 13186
5. Set Up Blackbox Exporter for External Monitoring
Purpose: Monitors external systems and services from a black-box perspective.
helm show values prometheus-community/prometheus-blackbox-exporter >> prometheus-blackbox-exporter-values.yaml
helm upgrade --install -f prometheus-blackbox-exporter-values.yaml prometheus-blackbox-exporter prometheus-community/prometheus-blackbox-exporter -n monitoring
6. Setting Up Alerting with Slack
To configure alerting via Slack, you'll need a Slack webhook URL. Replace TOKEN with your actual Slack webhook URL and follow these configuration steps:
- Update the Prometheus Alertmanager Configuration: Add the following settings to your
kube-prometheus-stack-values.yamlunderalertmanager.configto set up alerts sent to a Slack channel:
alertmanager:
  config:
    global:
      resolve_timeout: 5m
      slack_api_url: https://hooks.slack.com/services/TOKEN # replace with your slack webhook
    inhibit_rules:
    - equal:
      - namespace
      - alertname
      source_matchers:
      - severity = critical
      target_matchers:
      - severity =~ warning|info
    - equal:
      - namespace
      - alertname
      source_matchers:
      - severity = warning
      target_matchers:
      - severity = info
    - equal:
      - namespace
      source_matchers:
      - alertname = InfoInhibitor
      target_matchers:
      - severity = info
    - target_matchers:
      - alertname = InfoInhibitor
    receivers:
    - name: "null"
    - name: slack
      slack_configs:
      - channel: '#kubernetes-development-alert' # replace with your slack channel
        color: '{{ if eq .Status "firing" -}}{{ if eq .CommonLabels.severity "warning"
          -}}warning{{- else if eq .CommonLabels.severity "critical" -}}danger{{-
          else -}}#439FE0{{- end -}}{{ else -}}good{{- end }}'
        icon_url: https://avatars3.githubusercontent.com/u/3380462
        send_resolved: true
        text: |
          {{- if eq .CommonLabels.severity "critical" -}}
          *Severity:* `Critical` :red_circle:
          {{- else if eq .CommonLabels.severity "warning" -}}
          *Severity:* `Warning` :warning:
          {{- else if eq .CommonLabels.severity "info" -}}
          *Severity:* `Info` :information_source:
          {{- else -}}
          *Severity:* `Unknown` :interrobang: {{ .CommonLabels.severity }}
          {{- end }}
          {{- if (index .Alerts 0).Annotations.summary }}
          {{- "\n" -}}
          *Summary:* {{ (index .Alerts 0).Annotations.summary }}
          {{- end }}
          {{- if (index .Alerts 0).Labels.namespace }}
          {{- "\n" -}}
          *Namespace:* `{{ (index .Alerts 0).Labels.namespace }}`
          {{- end }}
          {{ range .Alerts }}
              {{- if .Annotations.description }}
              {{- "\n" -}}
              {{ .Annotations.description }}
              {{- "\n" -}}
              {{- end }}
              {{- if .Annotations.message }}
              {{- "\n" -}}
              {{ .Annotations.message }}
              {{- "\n" -}}
              {{- end }}
          {{- end }}
        title: |
          [{{ .Status | toUpper -}}
          {{ if eq .Status "firing" }}:{{ .Alerts.Firing | len }}{{- end -}}
          ] {{ .CommonLabels.alertname }}
- Define Custom Alerts: Include additional Prometheus rules for custom alert conditions:
additionalPrometheusRulesMap:
  custom-alerts:
    groups:
      - name: endpoint-check
        rules:
          - alert: EndpointDown
            expr: probe_success == 0
            for: 5m
            labels:
              severity: critical
            annotations:
              summary: "Endpoint {{ $labels.instance }} down"
              description: "{{ $labels.instance }} of job {{ $labels.job }} has been down for more than 5 minutes."
- Additional Scrape Configurations for Prometheus:
prometheus:
  prometheusSpec:
    additionalScrapeConfigs:
      - job_name: 'blackbox'
        metrics_path: /probe
        params:
          module: [http_2xx]  # Use the module defined in Blackbox Exporter
        static_configs:
          - targets:
            - https://google.com
        relabel_configs:
          - source_labels: [__address__]
            target_label: __param_target
          - source_labels: [__param_target]
            target_label: instance
          - target_label: __address__
            replacement: prometheus-blackbox-exporter:9115
Update your kube-prometheus-stack-values.yaml
helm upgrade --install -f kube-prometheus-stack-values.yaml kube-prometheus-stack prometheus-community/kube-prometheus-stack -n monitoring --version 58.5.3
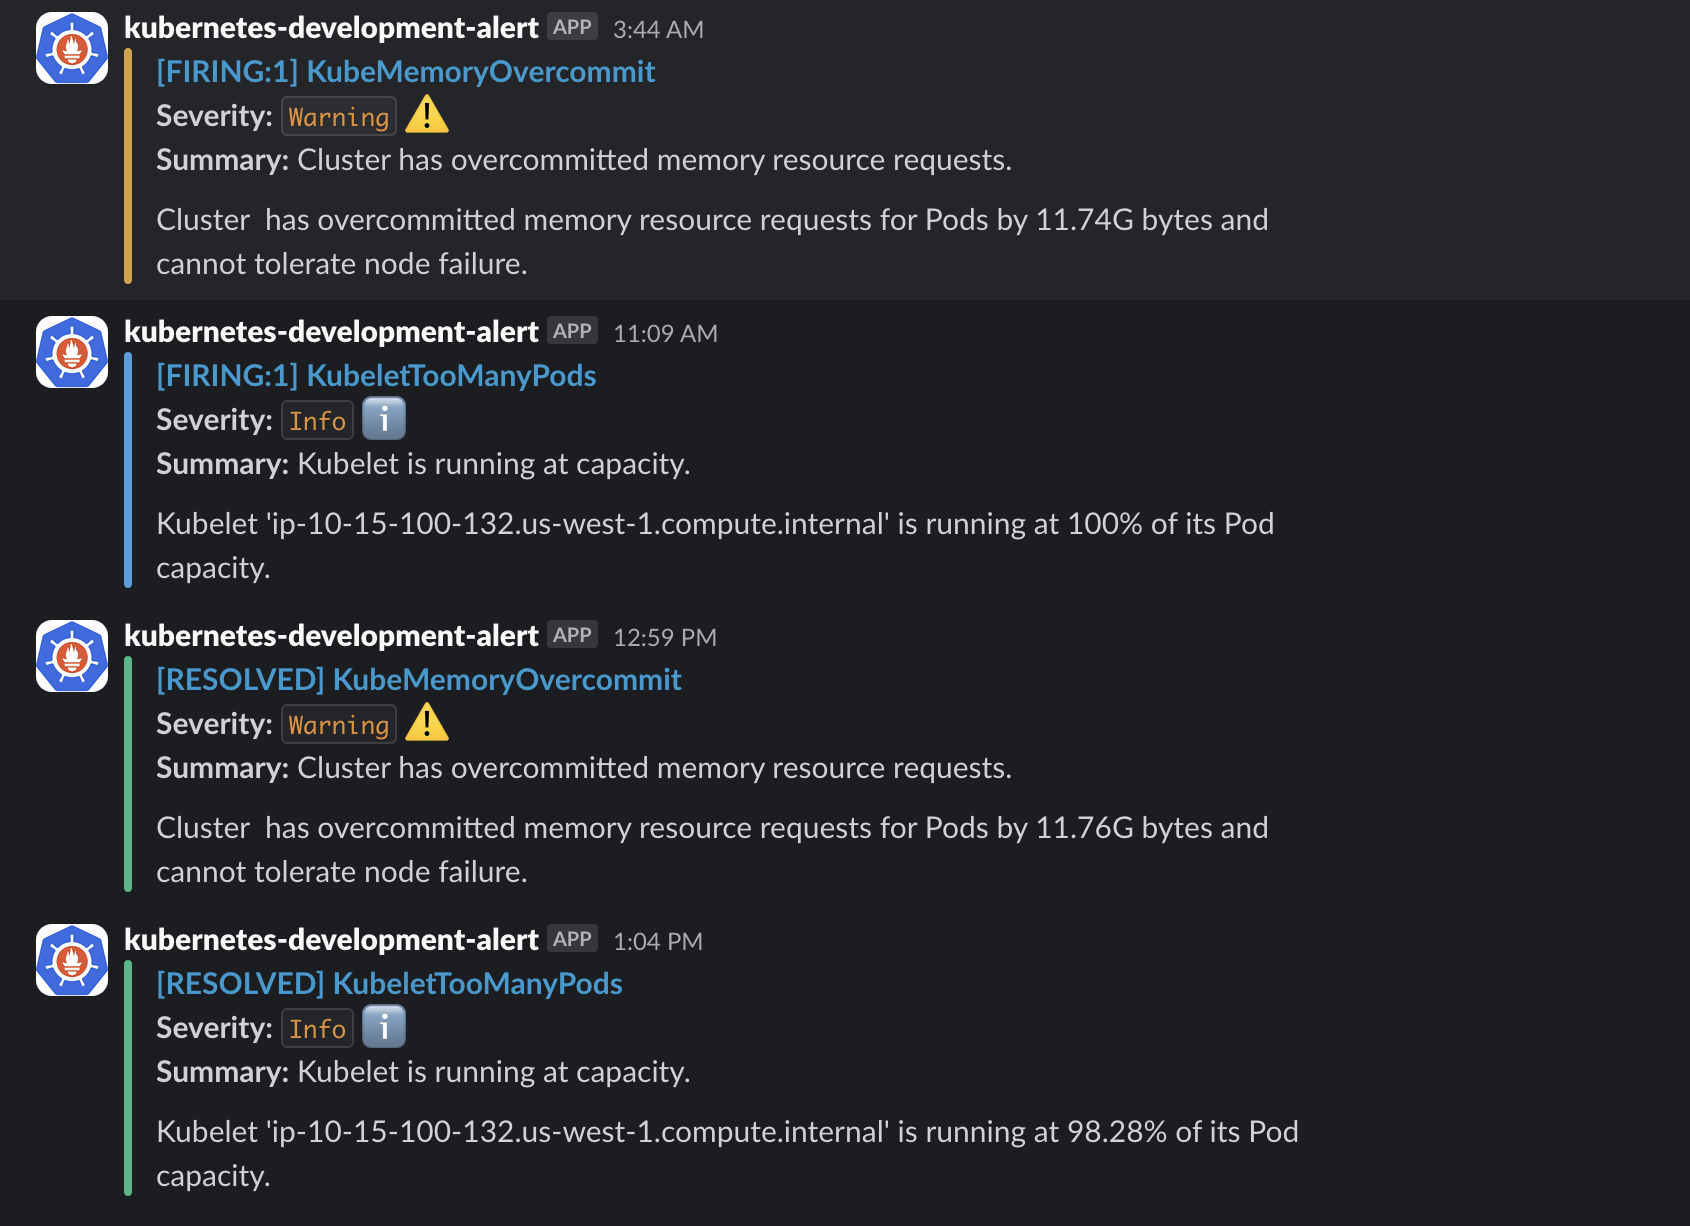
In Slack you can see alerts firing if your cluster have any issues.
In grafana you can add below dashboard to get all the Urls history
Conclusion
By following these steps, you’ve established a comprehensive monitoring framework for your Kubernetes clusters that can adapt to various environments. Experiment with different configurations to deepen your understanding and optimize your cluster’s performance.
Subscribe to my newsletter
Read articles from Suraj directly inside your inbox. Subscribe to the newsletter, and don't miss out.
Written by

Suraj
Suraj
a Rust enthusiast and DevOps expert with extensive experience in AWS, GCP, Kubernetes, continuous integration, automated deployments, and in
