SecureDevOpsPipeline: CI/CD with Built-in Security and Automation
 Vijay Kumar Singh
In today's software development landscape, the swift delivery of new features and updates is paramount; however, this must be balanced against the increasing importance of robust security practices. CI/CD (Continuous Integration/Continuous Delivery or Deployment) pipelines provide a framework for automating the building, testing, and deployment of applications, supporting both speed and reliability. This project demonstrates a CI/CD pipeline where security is integrated as a first-class citizen throughout every stage.
Project Overview
The core objective of this project is to establish a CI/CD pipeline that prioritizes the following principles:
Security by Design: Security considerations are embedded in all phases of the development and deployment workflow.
Automation: Leveraging automation to maximize efficiency, reduce potential human error, and enforce security best practices.
Continuous Monitoring: Implementing systems and application-level monitoring for proactive issue detection and rapid response.
Infrastructure as Code with Terraform: Utilizing Terraform, a popular Infrastructure as Code (IaC) tool, to predictably create, change, and improve cloud infrastructure.
Google Cloud as the Cloud Platform: Leveraging Google Cloud's compute engine services and products to provision and manage the required infrastructure components.
Key Technologies
Kubernetes: Container orchestration for application deployment and management.
Jenkins: CI/CD automation server.
SonarQube: Static code analysis to ensure code quality and identify potential security issues.
Aqua Trivy: Vulnerability scanning for code dependencies and container images.
Nexus Repository: Secure storage for build artifacts.
Docker: Containerization for application packaging.
Docker Hub: Docker image registry.
Kubeaudit: Tool to audit Kubernetes clusters for various different security concerns.
Grafana: For system and application-level monitoring and alerting.
Prometheus: For collecting and querying metrics from services and endpoints.
Gmail: For status notifications and alerts.
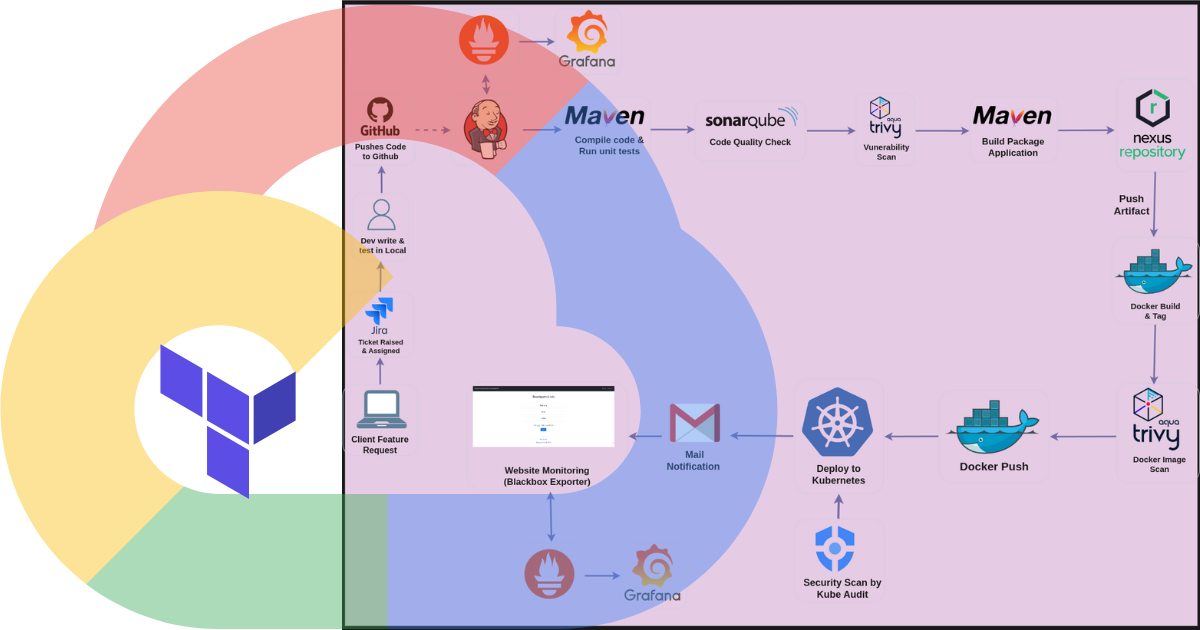
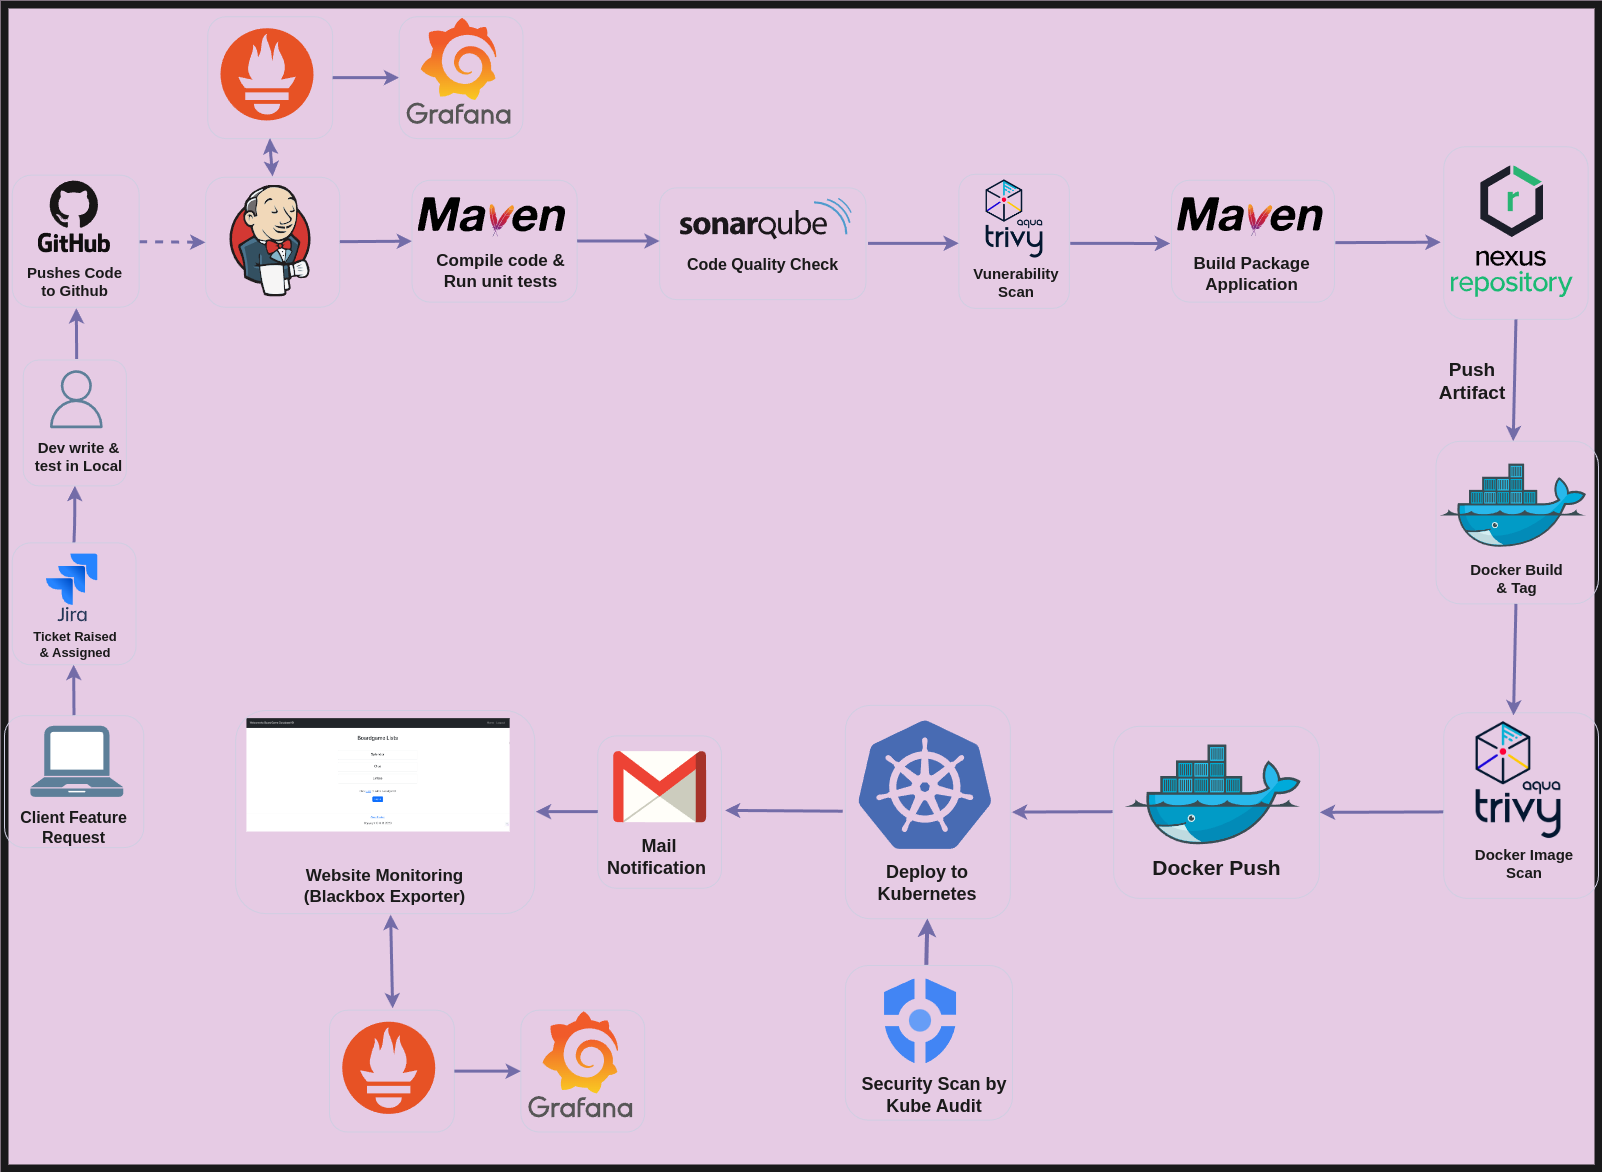
Architecture
Workflow Overview
Development and Version Control
Feature Request and Ticketing**:**
When a client identifies a need for a new feature or a modification, they initiate a Jira ticket. This ticket is then assigned to the appropriate developer for action.
Development Process:
Developers create feature branches within a Git repository (e.g., GitHub) and conduct local testing to ensure the new functionality works as intended.
Pipeline Triggering:
After developers push their changes and the associated source code to the GitHub repository, it automatically triggers the CI/CD pipeline.
Build and Unit Testing
Code Compilation:
The build system (such as Maven) compiles the code, checking for any syntax issues.
Unit Testing Execution:
Unit tests are performed to ensure the functionality of the code is validated.
Code Quality and Security Analysis
Static Code Analysis:
SonarQube is utilized to evaluate the code for maintainability, potential bugs and security vulnerabilities.
Dependency Vulnerability Scanning:
Aqua Trivy scans the project's dependencies for any vulnerabilities.
Artifact Creation and Storage
Artifact Generation:
A build artifact, such as a JAR or WAR file, is created during the build process.
Secure Artifact Storage:
The generated artifact is then pushed to Nexus Repository, ensuring it is securely stored and managed for future releases.
Docker Image Creation
Containerization Process:
Docker constructs a container image that includes the build artifact and applies the necessary tags.
Image Vulnerability Scanning:
Aqua Trivy performs a vulnerability scan on the newly created Docker image.
Image Registry Storage:
The scanned Docker image is subsequently pushed to Docker Hub for storage.
Kubernetes Deployment
Cluster Security Assessment:
Kubeaudit is employed to enhance the security of the Kubernetes cluster.
Deployment Phase:
If all security scans are successfully passed, the image is deployed to the Kubernetes cluster.
Notification System
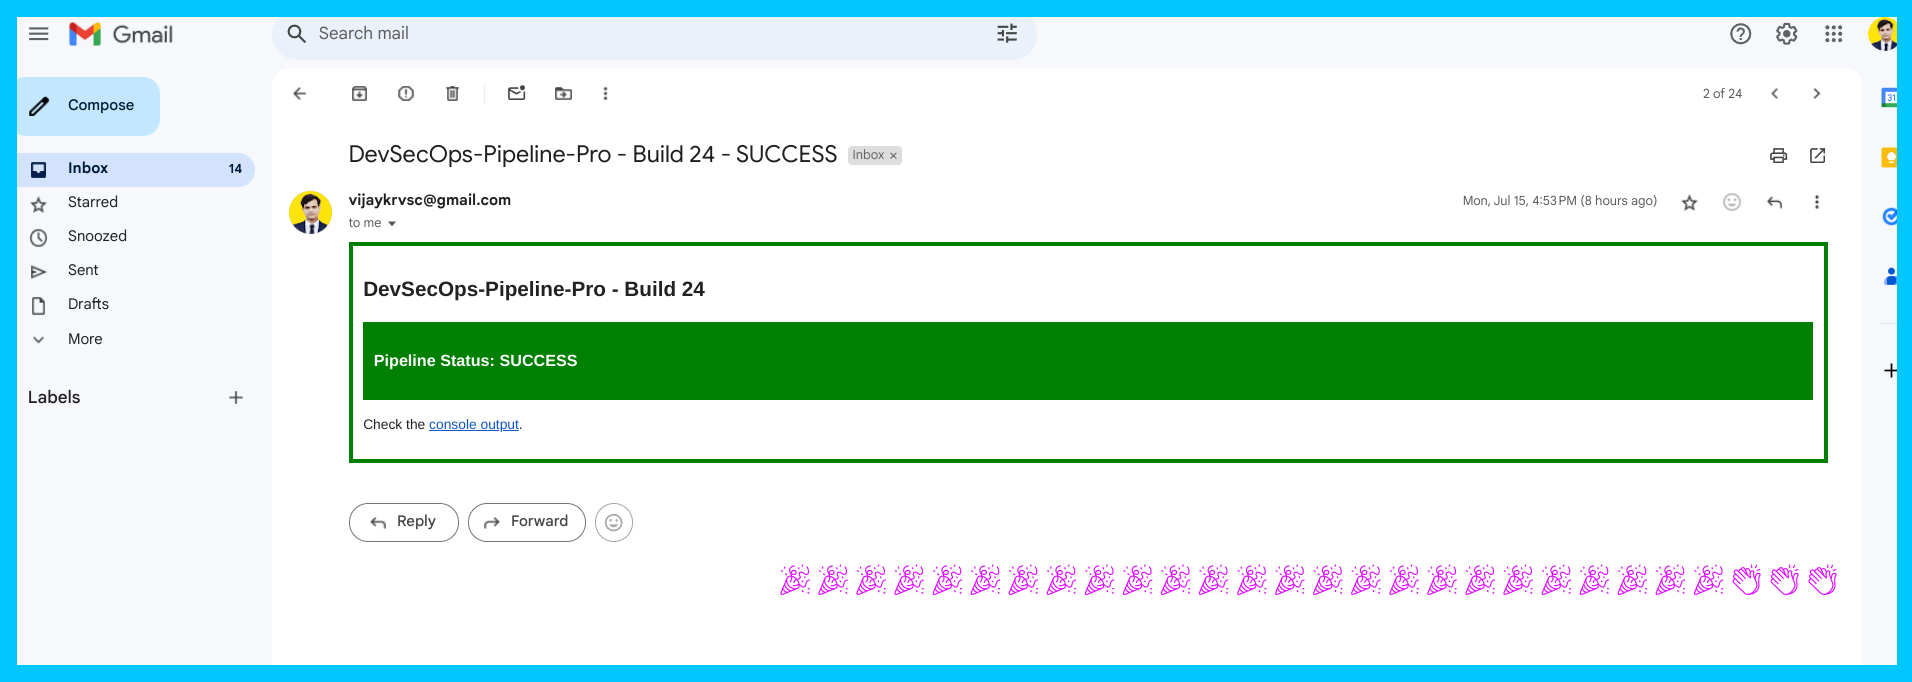
Email Notifications:
Clients and DevOps engineers receive email alerts regarding the success or failure of the pipeline, deployment status, errors, and any critical alerts.
Monitoring and Maintenance
System Health Monitoring:
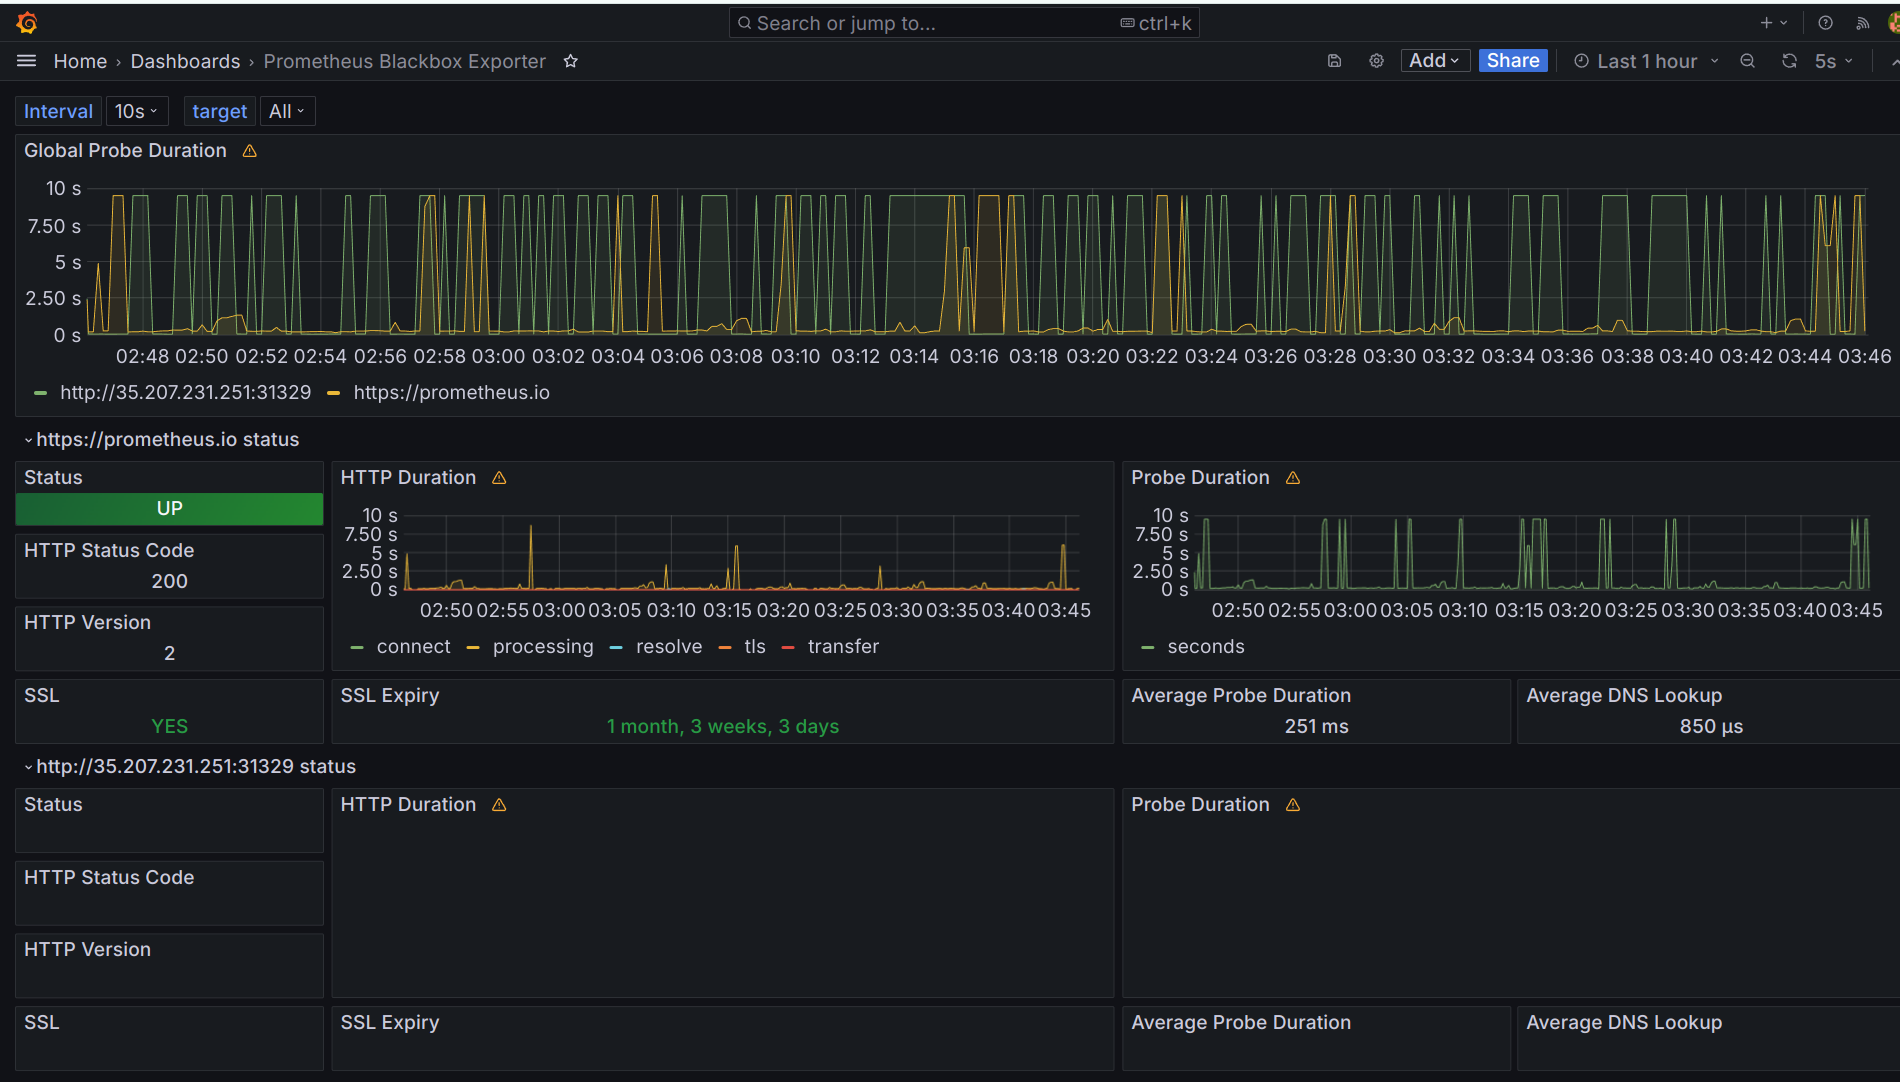
Tools such as Prometheus and Grafana are used to monitor the health of both the system and the application.
Hardware Monitoring:
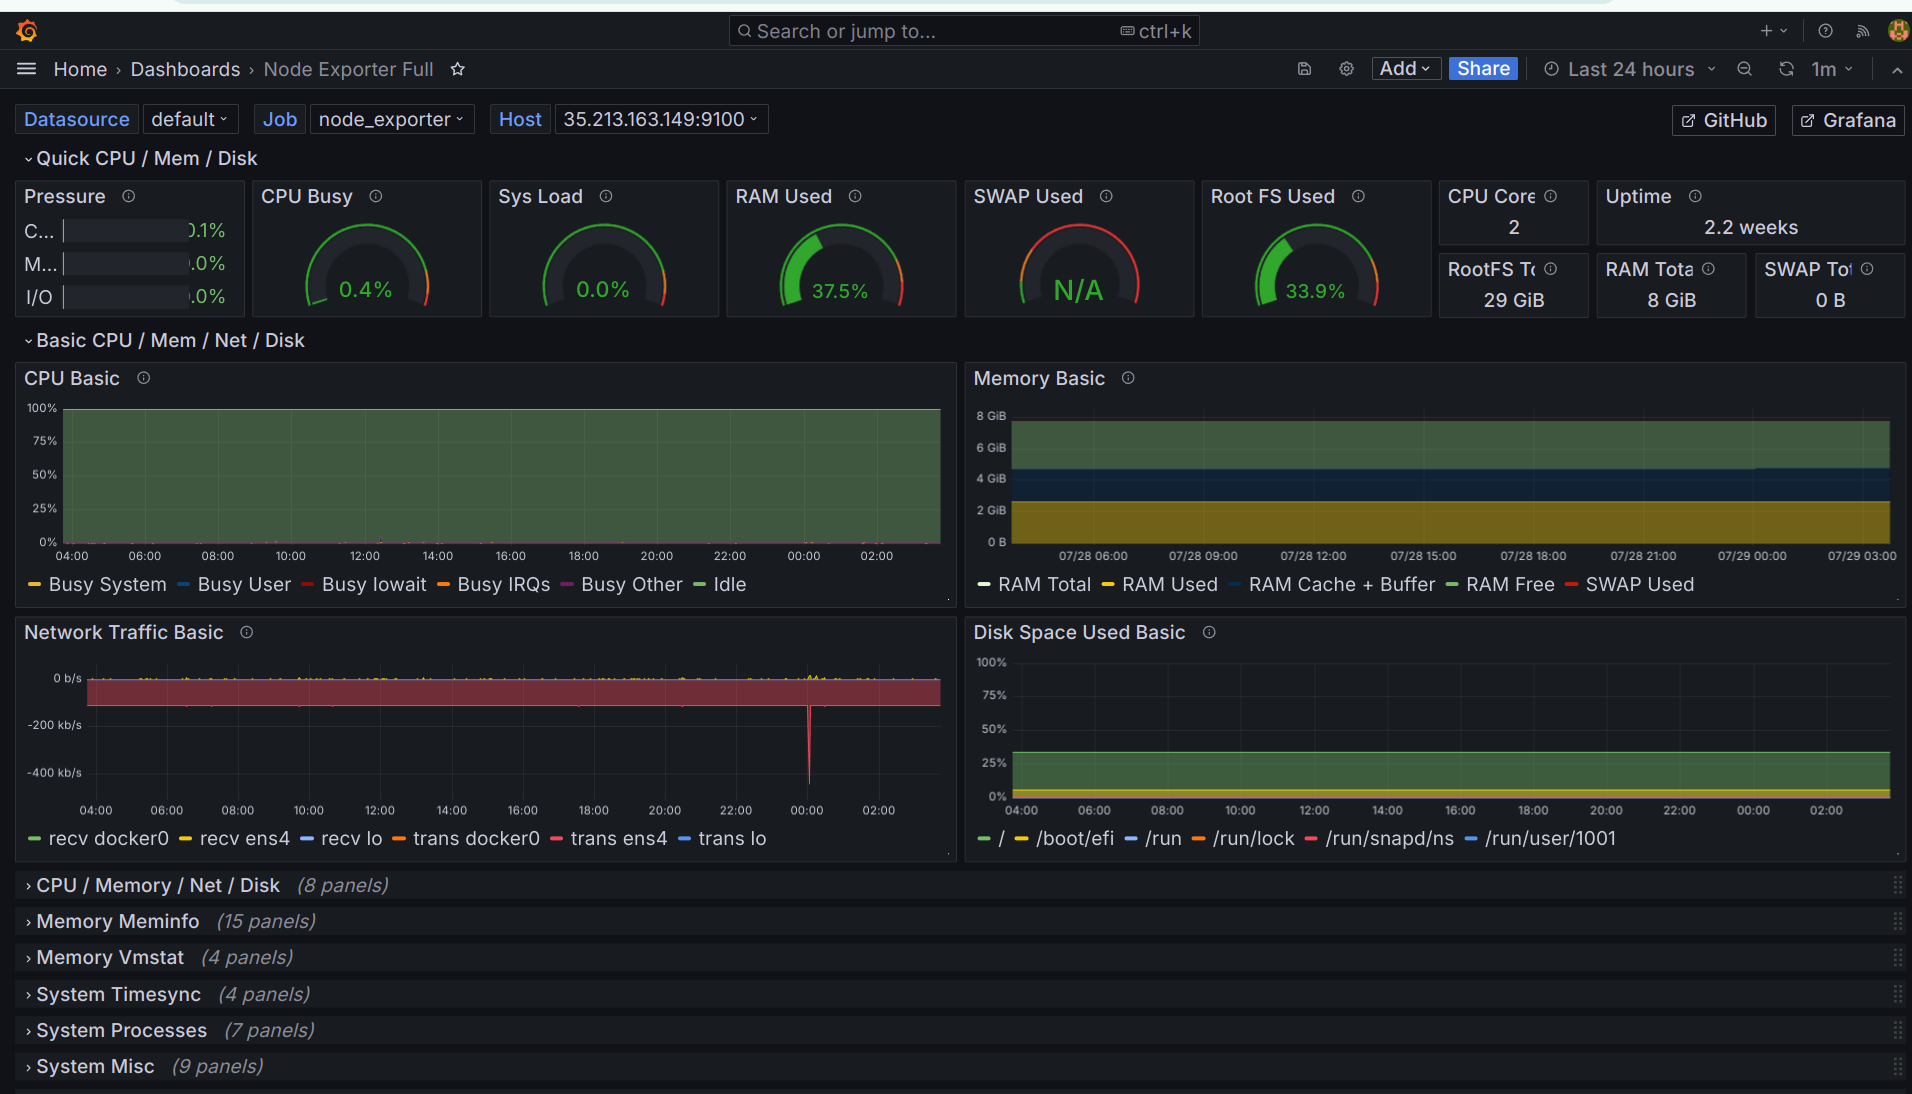
System-level monitoring of hardware resources is conducted using Jenkins and Node Exporter.
Problems Addressed
Manual Processes:
Problem: Manual builds, testing, and deployments are error-prone and time-consuming.
Solution: Automates these processes through Jenkins, Docker, and Kubernetes, reducing manual intervention and improving efficiency.
Code Quality and Security:
Problem: Poor code quality and security vulnerabilities can lead to unreliable and insecure applications.
Solution: Integrates SonarQube for code quality analysis and Trivy for vulnerability scanning, ensuring that only high-quality and secure code is deployed.
Infrastructure Management Complexity:
Problem: Managing infrastructure manually or with non-modular configurations can be complex and error-prone.
Solution: Uses modular Terraform configurations to manage infrastructure in a scalable and maintainable way.
Performance Monitoring:
Problem: Lack of visibility into application performance can lead to undetected issues.
Solution: Implements Prometheus and Grafana for comprehensive monitoring and visualization, providing insights into application performance and health.
Deployment Delays:
Problem: Delays in deploying code changes can slow down the release cycle and impact time-to-market.
Solution: Automates the deployment process to various environments, speeding up the release cycle and ensuring timely delivery of updates.
Overall, this project is designed to improve the efficiency, reliability, and security of the software development and deployment process, making it a valuable solution for development teams and organizations seeking to enhance their CI/CD pipelines and infrastructure management.
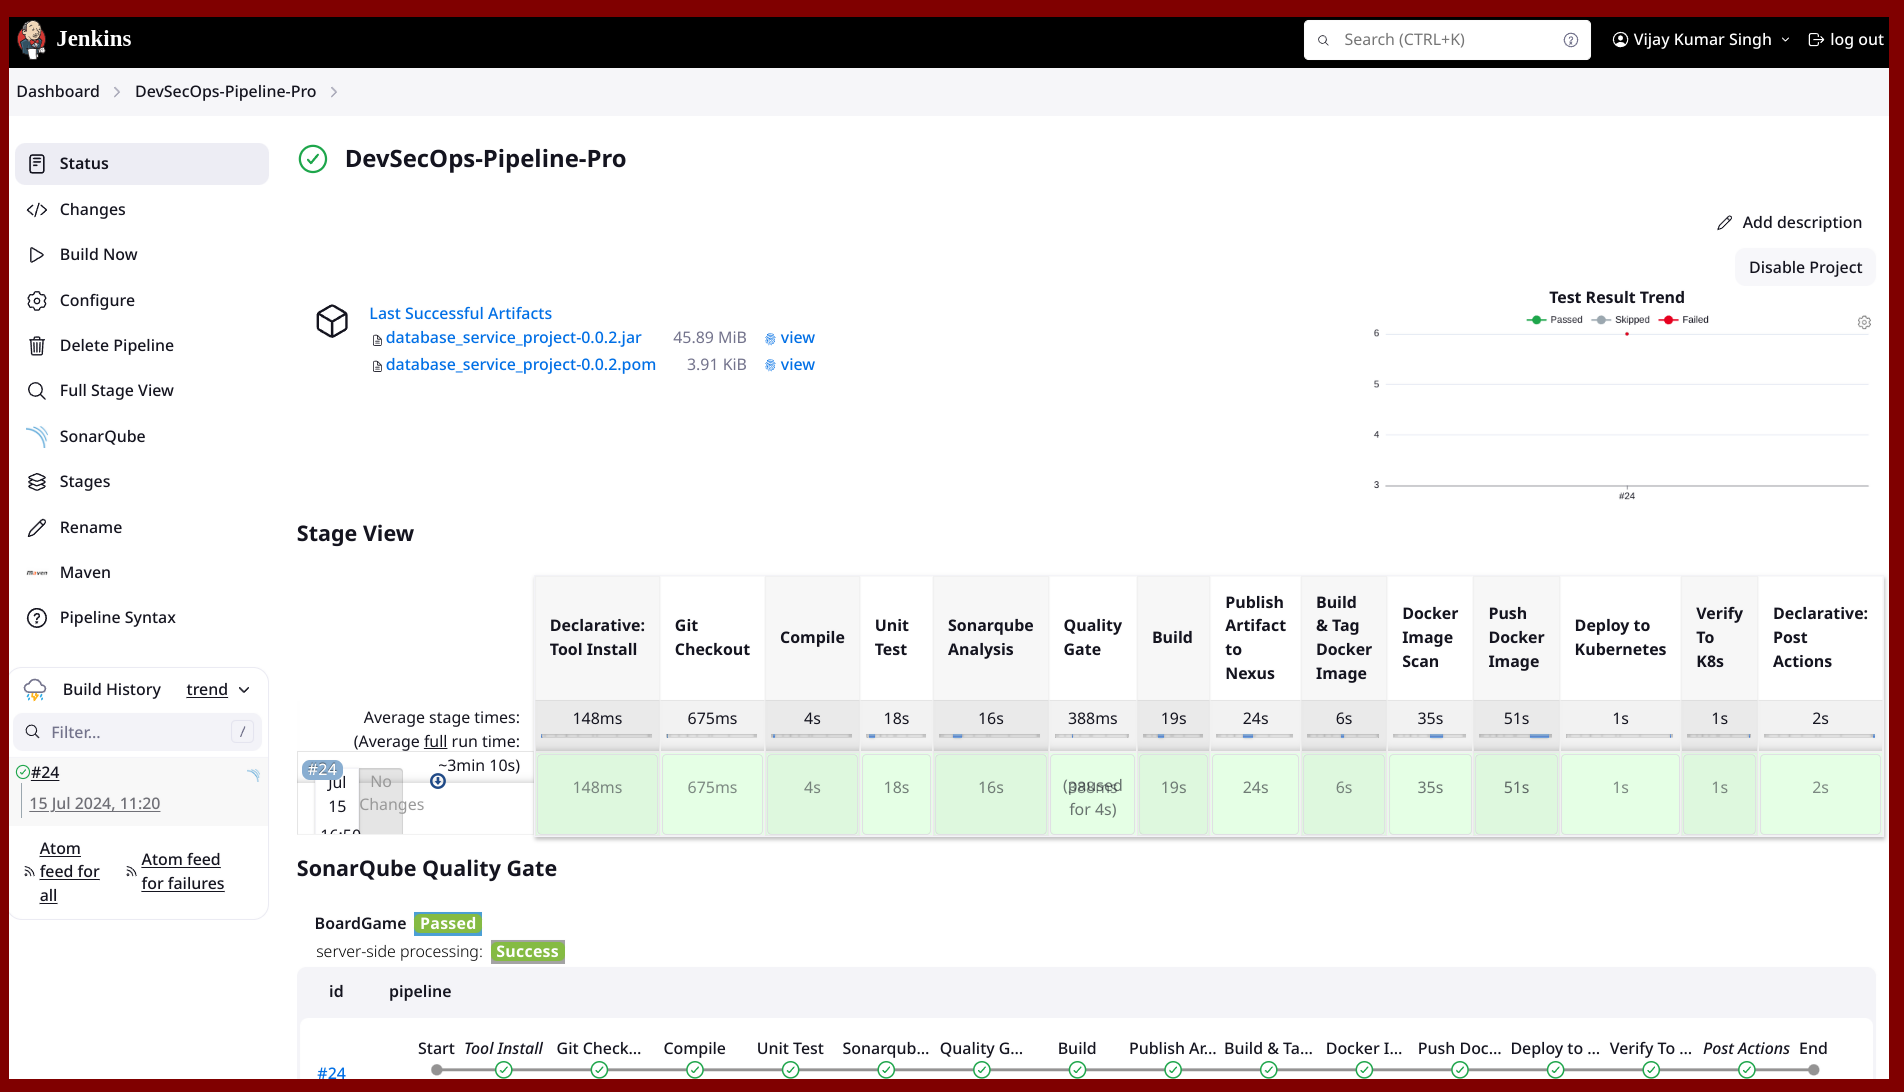
Jenkins Pipeline
The Jenkins pipeline automates the entire CI/CD process, ensuring efficient and reliable application delivery. Below is an elaborated guide on the Jenkins pipeline configuration used in this project:
Jenkins Pipeline Configuration
pipeline {
    agent any

    tools {
        maven 'maven3'
        jdk 'jdk17'
    }

    environment {
        SCANNER_HOME = tool 'sonar-scanner'
    }

    stages {
        stage('Git Checkout') {
            steps {
                git branch: 'main', credentialsId: 'git-crd', url: 'https://github.com/vsingh55/DevSecOps-Pipeline-Pro.git'
            }
        }

        stage('Compile') {
            steps {
                dir('BoardGameApp') {
                    sh "mvn compile"
                }
            }
        }

        stage('Unit Test') {
            steps {
                dir('BoardGameApp') {
                    sh "mvn test"
                }
            }
        }

        stage('Sonarqube Analysis') {
            steps {
                dir('BoardGameApp') {
                    withSonarQubeEnv('sonar') {
                        sh ''' $SCANNER_HOME/bin/sonar-scanner -Dsonar.projectName=BoardGame \
                        -Dsonar.projectKey=BoardGame -Dsonar.java.binaries=. '''
                    }
                }
            }
        }

        stage('Quality Gate') {
            steps {
                dir('BoardGameApp') {
                    script {
                    waitForQualityGate abortPipeline: false, credentialsId: 'sonar-token'
                    }
                }
            }
        }

        stage('Build') {
            steps {
                dir('BoardGameApp') {
                    sh "mvn package"
                }
            }
        }

        stage('Publish Artifact to Nexus') {
            steps {
                dir('BoardGameApp') {
                    withMaven(globalMavenSettingsConfig: 'global-settings', jdk: 'jdk17', maven: 'maven3', mavenSettingsConfig: '', traceability: true) {
                    sh "mvn deploy"
                    }
                }
           }
        }

        stage('Build & Tag Docker Image') {
            steps {
                dir('BoardGameApp') {
                    script {
                        withDockerRegistry(credentialsId: 'docker-crd') {
                            sh 'docker build -t krvsc/boardgame:latest .'
                        }
                    }
                }
            }
        }

        stage('Docker Image Scan') {
            steps {
                sh "trivy image --format table -o trivy-image-report.html krvsc/boardgame:latest"
            }
        }

        stage('Push Docker Image') {
            steps {
                dir('BoardGameApp') {
                    script {
                        withDockerRegistry(credentialsId: 'docker-crd') {
                            sh 'docker push krvsc/boardgame:latest'
                        }
                    }
                }
            }
        }

        stage('Deploy to Kubernetes') {
            steps {
                dir('BoardGameApp') {
                    withKubeConfig(caCertificate: '', clusterName: 'kubernetes', contextName: 'kubernetes-admin@kubernetes', credentialsId: 'k8-crd', namespace: 'webapps', restrictKubeConfigAccess: false, serverUrl: 'https://10.160.0.4:6443') {
                        sh "kubectl apply -f deployment.yaml"
                    }
                }
            }
        }

        stage('Verify Deployment to K8s') {
            steps {
                dir('BoardGameApp') {
                    withKubeConfig(caCertificate: '', clusterName: 'kubernetes', contextName: '', credentialsId: 'k8-crd', namespace: 'webapps', restrictKubeConfigAccess: false, serverUrl: 'https://10.160.0.4:6443') {
                        sh "kubectl get pods -n webapps"
                        sh "kubectl get svc -n webapps"
                    }
                }
            }
        }
    }

    post {
        always {
            script {
                def jobName = env.JOB_NAME
                def buildNumber = env.BUILD_NUMBER
                def pipelineStatus = currentBuild.result ?: 'UNKNOWN'
                def bannerColor = pipelineStatus.toUpperCase() == 'SUCCESS' ? 'green' : 'red'

                def body = """
                <html>
                <body>
                <div style="border: 4px solid ${bannerColor}; padding: 10px;">
                <h2>${jobName} - Build ${buildNumber}</h2>
                <div style="background-color: ${bannerColor}; padding: 10px;">
                <h3 style="color: white;">Pipeline Status: ${pipelineStatus.toUpperCase()}</h3>
                </div>
                <p>Check the <a href="${env.BUILD_URL}">console output</a>.</p>
                </div>
                </body>
                </html>
                """

                emailext (
                    subject: "${jobName} - Build ${buildNumber} - ${pipelineStatus.toUpperCase()}",
                    body: body,
                    to: 'vijaykrvsc@gmail.com',
                    from: 'jenkins@example.com',
                    replyTo: 'jenkins@example.com',
                    mimeType: 'text/html',
                    attachmentsPattern: 'trivy-fs-report.html'
                )
            }
        }
    }
}
Instructions to implement the project:
Step.1:Go to the project repository and clone, fork, or star it as you prefer. I will be adding new things to this project.
Step.2: Go check out my blog where I discuss everything you need to know about infrastructure provisioning and setting up a Jenkins server.
Step.3: To set up monitoring, follow these steps:
Access Prometheus on port 9090 using
http://<monitoring-vm-ip>:9090
Access Grafana on port 3000 using
http://<monitoring-vm-ip>:3000The initial username and password for Grafana are both "admin." Log in and change the username and password.
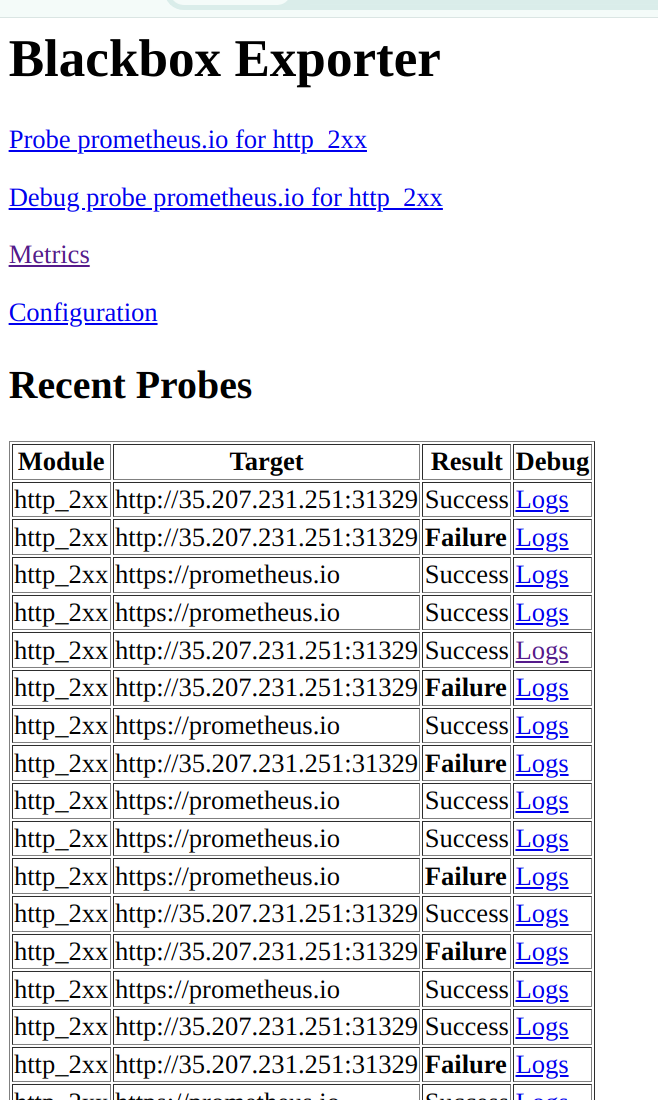
Access the Blackbox Exporter on port 9115 using
http://<monitoring-vm-ip>:9115Now, you need to modify the jobs in the
prometheus.ymlfile:

* Refresh Blackbox exporter web it will look like:
The only thing left is to set up the dashboard in Grafana. Go to Grafana -> Dashboard -> Import Dashboard using the following dashboard IDs:
BlackBox Exporter Dashboard ID: 7587
NodeExporter Dashboard ID: 1860 for system-level monitoring
Select data source: Prometheus
That's it! Now you can monitor both the application and the system.
Conclusion
Implementing this DevSecOps pipeline ensures a seamless and secure development lifecycle, leveraging the power of Jenkins for CI/CD, SonarQube for code quality, Nexus for artifact management, Docker and Kubernetes for containerization and deployment, and Prometheus and Grafana for monitoring and alerting. The modularized Terraform configurations enhance the scalability and maintainability of the infrastructure, providing a robust foundation for continuous development and deployment.
Subscribe to my newsletter
Read articles from Vijay Kumar Singh directly inside your inbox. Subscribe to the newsletter, and don't miss out.
Written by

Vijay Kumar Singh
Vijay Kumar Singh
I'm Vijay Kumar Singh, a Linux, DevOps, Cloud enthusiast learner and contributor in shell scripting, Python, networking, Kubernetes, Terraform, Ansible, Jenkins, and cloud (Azure, GCP, AWS) and basics of IT world. 💻✨ Constantly exploring innovative IT technologies, sharing insights, and learning from the incredible Hashnode community. 🌟 On a mission to build robust solutions and make a positive impact in the tech world. 🚀 Let's connect and grow together! #PowerToCloud