Monitor Linux Server with Splunk
 Ankita Lunawat
Continuous monitoring is an important part of software development. It is something we take up as measure to maintain the health of a software & to improve the quality of the software, & this is based on feedback we get from the insights gained from monitoring.
Types of data that we can monitor -
Application Metrics
Application Logs
Transactional data
API data
Customer data
Network data
Configuration settings
security data
Business related data
Types of monitoring -
System performance
process monitoring
integration
application performance
Business monitoring
Monitoring Tools available w.r.t. Software development -
Prometheus
Grafana
Nagios
Amazon cloud watch
Splunk
ELK stack — Elasticsearch
Datadog
Splunk is a software platform for searching, monitoring, and analyzing machine-generated data, including logs, events, and metrics. It is used by organizations of all sizes to improve their IT operations and security. Splunk is paid tool. Free version has very less features.
Splunk is better than other monitoring tools in several ways:
Ease of use: Splunk is relatively easy to use, even for users with limited technical expertise.
Scalability: Splunk can scale to handle very large volumes of data, making it ideal for enterprise environments.
Flexibility: Splunk is very flexible and can be used for a wide range of monitoring tasks, including log management, application monitoring, security monitoring, and compliance reporting.
Power: Splunk’s powerful search and analytics capabilities make it easy to identify trends and patterns in data that would be difficult to find with other tools.
Benefits of Splunk -
Data analytics
Easy to use
Good customer support
ML abilities
Real-time performance monitoring
Logging tool
Stack security and alerting
Dashboards & visualizations
Splunk Products -
Splunk Core = Splunk enterprise — for monitoring
Splunk IT operations
Splunk security
Splunk DevOps
Splunk enterprise has set of tools -
Forwarder
Indexer
Search head
Each of these tools have their own servers.
Splunk Enterprise Layout -
There are different types of licenses in Splunk that you can purchase to make use of different services within Splunk enterprise. These can be:
Slunk Platform License,
Splunk Enterprise infrastructure license
Splunk Enterprise Trial license
Free license
Splunk Enterprise license contains -
Forwarder License
Beta License
Splunk premium app license
Splunk industrial IoT license
Splunk Enterprise -
Splunk Enterprise is a software product that enables you to search, analyze, and visualize the data gathered from the components of your IT infrastructure or business. Splunk Enterprise takes in data from websites, applications, sensors, devices, and so on. After you define the data source, Splunk Enterprise indexes the data stream and parses it into a series of individual events that you can view and search.
Most users connect to Splunk Enterprise with a web browser and use Splunk Web to administer their deployment, manage and create knowledge objects, run searches, create pivots and reports, and so on. You can also use the command-line interface to administer your Splunk Enterprise deployment.
Features of Splunk Enterprise
The following section highlights seven Splunk Enterprise features.
Indexing
Splunk Enterprise processes and stores the data that represents your business and its infrastructure. You can collect data from devices and applications such as websites, servers, databases, operating systems, and more. Once the data is collected, the index segments, stores, compresses the data, and maintains the supporting metadata to accelerate searching. To learn about getting your data into Splunk Enterprise.
Search
Search is the primary way users navigate their data in Splunk Enterprise. You can save a search as a report and use it to power dashboard panels. Searches provide insight from your data, such as:
Retrieving events from an index
Calculating metrics
Searching for specific conditions within a rolling time window
Identifying patterns in your data
Predicting future trends
Alerts
Alerts notify you when search results for both historical and real-time searches meet configured conditions. You can configure alerts to trigger actions like sending alert information to designated email addresses, posting alert information to an RSS feed, and running a custom script, such as one that posts an alert event to syslog.
Dashboards
Dashboards contain panels of modules like search boxes, fields, charts, and so on. Dashboard panels are usually connected to saved searches or pivots. They display the results of completed searches and data from real-time searches that run in the background.
Reports
Splunk Enterprise allows you to save searches and pivots as reports, and then add reports to dashboards as dashboard panels. Run reports on an ad hoc basis, schedule them to run on a regular interval, or set a scheduled report to generate alerts when the result meets particular conditions.
Data model
Data models encode specialized domain knowledge about one or more sets of indexed data. They enable Pivot Editor users to create reports and dashboards without designing the searches that generate them.
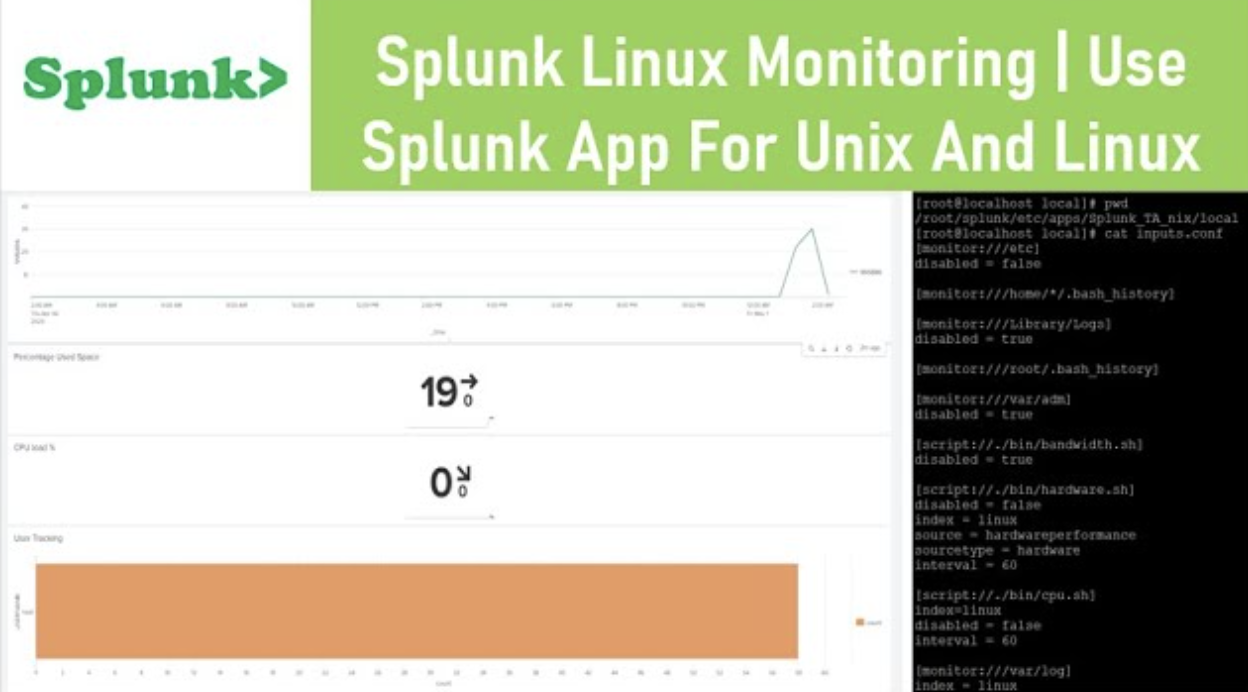
By above steps and experimenting with different search queries, you can effectively search and analyze data collected by the “Splunk Add-on for Unix and Linux” to gain insights into your Unix and Linux systems.
Subscribe to my newsletter
Read articles from Ankita Lunawat directly inside your inbox. Subscribe to the newsletter, and don't miss out.
Written by

Ankita Lunawat
Ankita Lunawat
Hi there! I'm a passionate AWS DevOps Engineer with 2+ years of experience in building and managing scalable, reliable, and secure cloud infrastructure. I'm excited to share my knowledge and insights through this blog. Here, you'll find articles on: AWS Services: Deep dives into core AWS services like EC2, S3, Lambda, and more. DevOps Practices: Best practices for CI/CD, infrastructure as code, and automation. Security: Tips and tricks for securing your AWS environments. Serverless Computing: Building and deploying serverless applications. Troubleshooting: Common issues and solutions in AWS. I'm always eager to learn and grow, and I hope this blog can be a valuable resource for fellow DevOps enthusiasts. Feel free to connect with me on [LinkedIn/Twitter] or leave a comment below!