Day 19 of my 90-day Devops journey: Logging and Tracing with the ELK Stack and Jaeger: A Beginner's Guide
 Abigeal Afolabi
#logging#devops#elk#devjournal
Hey everyone! Today, we're diving into the world of logging and tracing with the ELK Stack and Jaeger. It's been a bit hectic lately, and I'm a couple of days behind on my project timeline. But hey, we all have those days, right? The good news is, we're going to be building a powerful solution that will help us get a much better understanding of our applications. This guide will walk you through setting up the ELK Stack (Elasticsearch, Logstash, Kibana) and Jaeger to create a robust logging and tracing solution for your applications. We'll cover the basics, but even experienced developers might find some helpful tips.
Project Overview
Goal: Implement a comprehensive logging and tracing solution using the ELK Stack and Jaeger.
Tools:
Elasticsearch 7.17.3: For storing and searching log data.
Logstash 7.17.3: For processing and forwarding log data.
Kibana 7.17.3: For visualizing log data.
Jaeger: For tracing distributed systems.
Project Structure:
day19-project/
├── elasticsearch/
│   ├── bin/
│   ├── config/
│   │   └── elasticsearch.yml
├── logstash/
│   ├── bin/
│   ├── config/
│   │   └── logstash.conf
├── kibana/
│   ├── bin/
│   ├── config/
│   │   └── kibana.yml
└── docker-compose.yml
Step-by-Step Guide
1. Setting Up the ELK Stack with Docker Compose
- Create
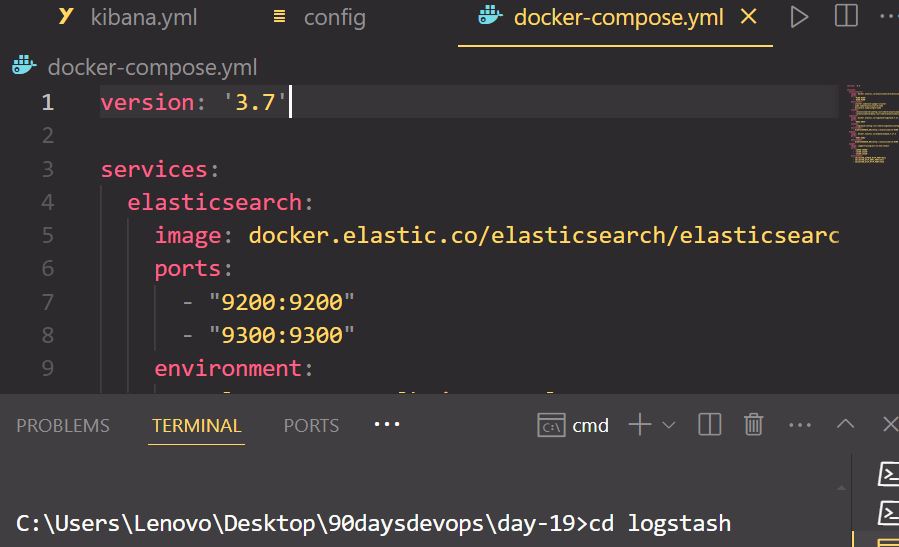
docker-compose.yml: Create adocker-compose.ymlfile in your project directory with the following configuration:
   version: '3.7'

   services:
     elasticsearch:
       image: docker.elastic.co/elasticsearch/elasticsearch:7.17.3
       ports:
         - "9200:9200"
         - "9300:9300"
       environment:
         - cluster.name=elk-jaeger-cluster
         - node.name=elasticsearch-node
         - discovery.type=single-node
       volumes:
         - ./elasticsearch/config:/usr/share/elasticsearch/config
         - ./elasticsearch/data:/usr/share/elasticsearch/data
     logstash:
       image: docker.elastic.co/logstash/logstash:7.17.3
       ports:
         - "5044:5044"
       volumes:
         - ./logstash/config:/usr/share/logstash/config
       environment:
         - ELASTICSEARCH_URL=http://elasticsearch:9200
     kibana:
       image: docker.elastic.co/kibana/kibana:7.17.3
       ports:
         - "5601:5601"
       environment:
         - ELASTICSEARCH_URL=http://elasticsearch:9200
- Run Docker Compose: Navigate to your project directory and run:
docker-compose up -d
This will start Elasticsearch, Logstash, and Kibana in the background.
2. Setting Up Jaeger (Docker Compose)
- Add Jaeger Services to
docker-compose.yml: Extend yourdocker-compose.ymlfile to include the Jaeger agent and collector:
   # ... (previous services) ...

   jaeger-agent:
     image: jaegertracing/jaeger-agent:latest
     ports:
       - "6831:6831" # Jaeger agent port
     environment:
       - JAEGER_AGENT_HOST=jaeger-collector
       - JAEGER_AGENT_PORT=14250 # Jaeger collector port
   jaeger-collector:
     image: jaegertracing/jaeger-collector:latest
     ports:
       - "14250:14250" # Jaeger collector port
       - "14268:14268" # Jaeger query port
       - "16686:16686" # Jaeger UI port
     environment:
       - JAEGER_SAMPLER_TYPE=const
       - JAEGER_SAMPLER_PARAM=1
       - COLLECTOR_ZIPKIN_HTTP_PORT=9411
       - COLLECTOR_OTLP_GRPC_PORT=4317
       - COLLECTOR_OTLP_HTTP_PORT=4318
- Restart Docker Compose: Run
docker-compose up -dagain to restart the containers with the added Jaeger services.
3. Instrumenting Your Application with Jaeger
Choose a Jaeger Client Library: Select the Jaeger client library for your programming language (e.g., Java, Python, Go). The Jaeger documentation (https://www.jaegertracing.io/docs/) provides detailed instructions and examples.
Integrate Jaeger: Follow the instructions in the Jaeger client library documentation to integrate Jaeger into your application. This usually involves adding a few lines of code to instrument your functions and methods.
4. Sending Logs with Beats
Install and Configure Beats: Choose the appropriate Beat for your data source (e.g., Filebeat for log files, Metricbeat for system metrics). The Beats documentation (https://www.elastic.co/guide/en/beats/index.html) provides detailed instructions on installation and configuration.
Configure Beats to Send Logs to Logstash: Configure your Beat to send data to Logstash on port 5044. This will forward the logs to Elasticsearch for storage and analysis.
5. Visualizing Data in Kibana
Access Kibana: Open your web browser and navigate to
http://localhost:5601.Create Dashboards: Use Kibana's dashboard builder to create visualizations of your log data and traces. You can create charts, graphs, and maps to gain insights into your application's performance and behavior.
6. Troubleshooting
Check Logs: Review the logs of Elasticsearch, Logstash, Kibana, and Jaeger for any error messages.
Verify Network Connectivity: Ensure that all components can communicate with each other on the correct ports.
Test Jaeger Integration: Send test traces from your application to Jaeger to verify that they are being collected and displayed correctly.
Next Steps
Optimize Performance: Tune the performance of your ELK Stack and Jaeger setup by adjusting configurations and optimizing queries.
Automate Reporting: Use Kibana's reporting features to generate automated reports on a regular basis.
Explore Advanced Features: Explore the advanced features of the ELK Stack and Jaeger, such as machine learning, anomaly detection, and more.
Remember: This is a basic guide to get you started. The ELK Stack and Jaeger offer a wide range of features and customization options. Refer to the official documentation for more in-depth information and advanced use cases.
Let me know if you have any questions or need further assistance!
Subscribe to my newsletter
Read articles from Abigeal Afolabi directly inside your inbox. Subscribe to the newsletter, and don't miss out.
Written by

Abigeal Afolabi
Abigeal Afolabi
🚀 Software Engineer by day, SRE magician by night! ✨ Tech enthusiast with an insatiable curiosity for data. 📝 Harvard CS50 Undergrad igniting my passion for code. Currently delving into the MERN stack – because who doesn't love crafting seamless experiences from front to back? Join me on this exhilarating journey of embracing technology, penning insightful tech chronicles, and unraveling the mysteries of data! 🔍🔧 Let's build, let's write, let's explore – all aboard the tech express! 🚂🌟 #CodeAndCuriosity