How to Turn Your Bubble.io Database into a Visual Schema: A Step-by-Step Guide
 Farabiulder
Introduction
In today’s data-driven world, having a clear visual representation of your database can significantly enhance your understanding and utilization of data. Bubble.io, a powerful no-code platform, enables users to build applications without traditional coding. However, managing and understanding the underlying database can be complex. This guide will show you how to turn your Bubble.io database into a visual schema, making data analysis and insights much easier to achieve.
Why Visualize Your Database?
Visualizing your database brings numerous benefits:
Enhanced Data Understanding: Visual representations help you quickly understand complex data structures and relationships.
Easier Error Detection: Visuals simplify spotting anomalies or inconsistencies in your data.
Improved Communication: Share data insights with team members or stakeholders more effectively using visual tools.
Simplified Data Management: Makes managing and maintaining your database straightforward and efficient.
Informed Decision Making: Provides clear insights that support better decision-making.
Streamlined Workflow: Enhances data manipulation, making your workflow smoother and more intuitive.
Steps to Visualize Your Bubble.io Database
1. Install the BubVisch Extension
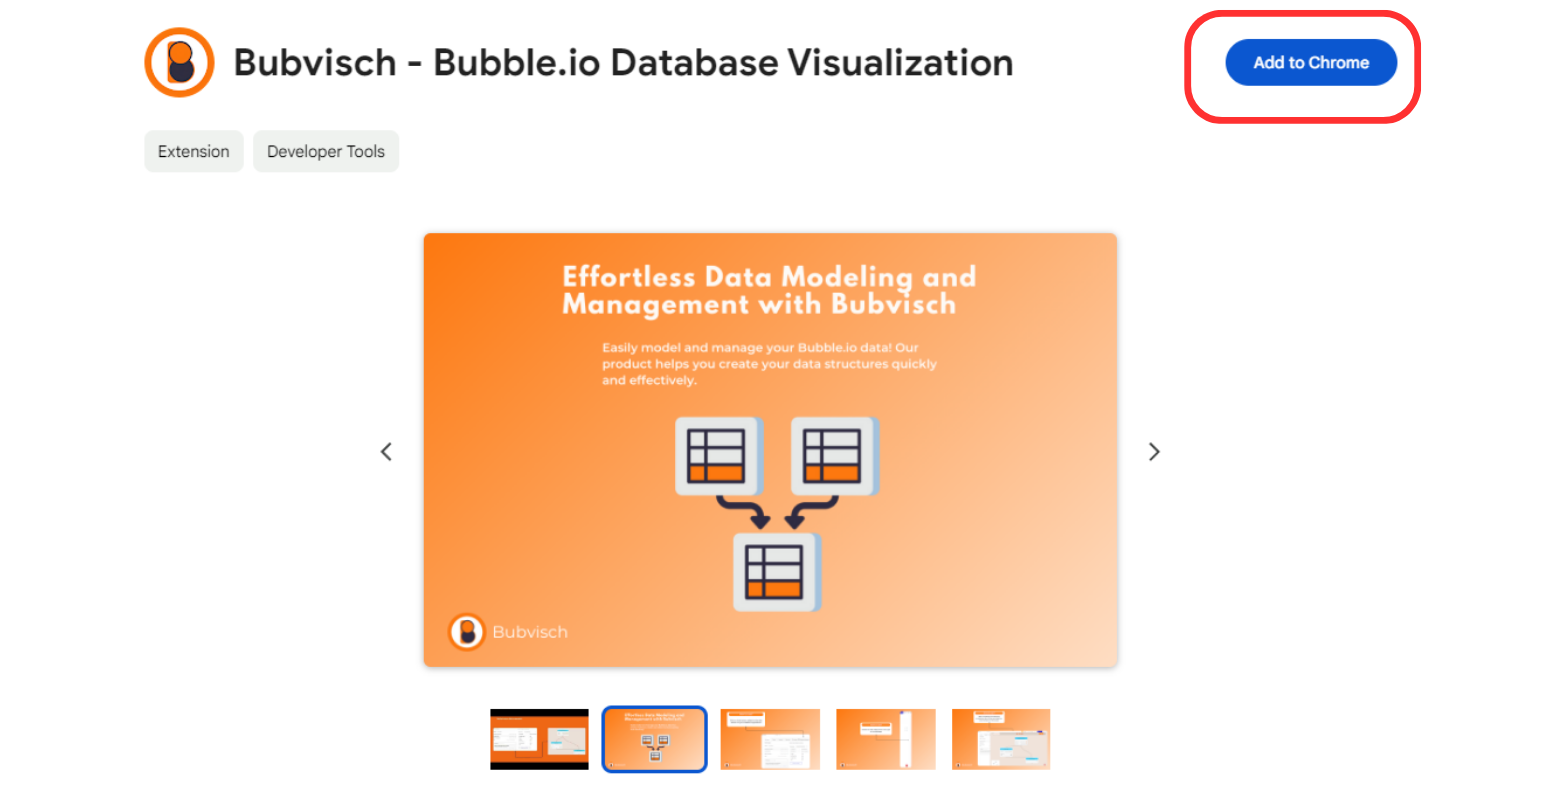
Begin by installing the BubVisch Chrome extension from the 🔗 Chrome Web Store. This extension integrates seamlessly with Bubble.io, providing a robust tool for visualizing your database.

2. Navigate to the Database Tab
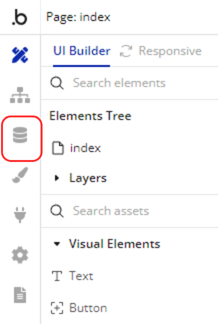
After installation, open your Bubble.io application and head to the Database Tab. Here, you will manage your database and activate the extension.

3. Click the Data Visualizer Button
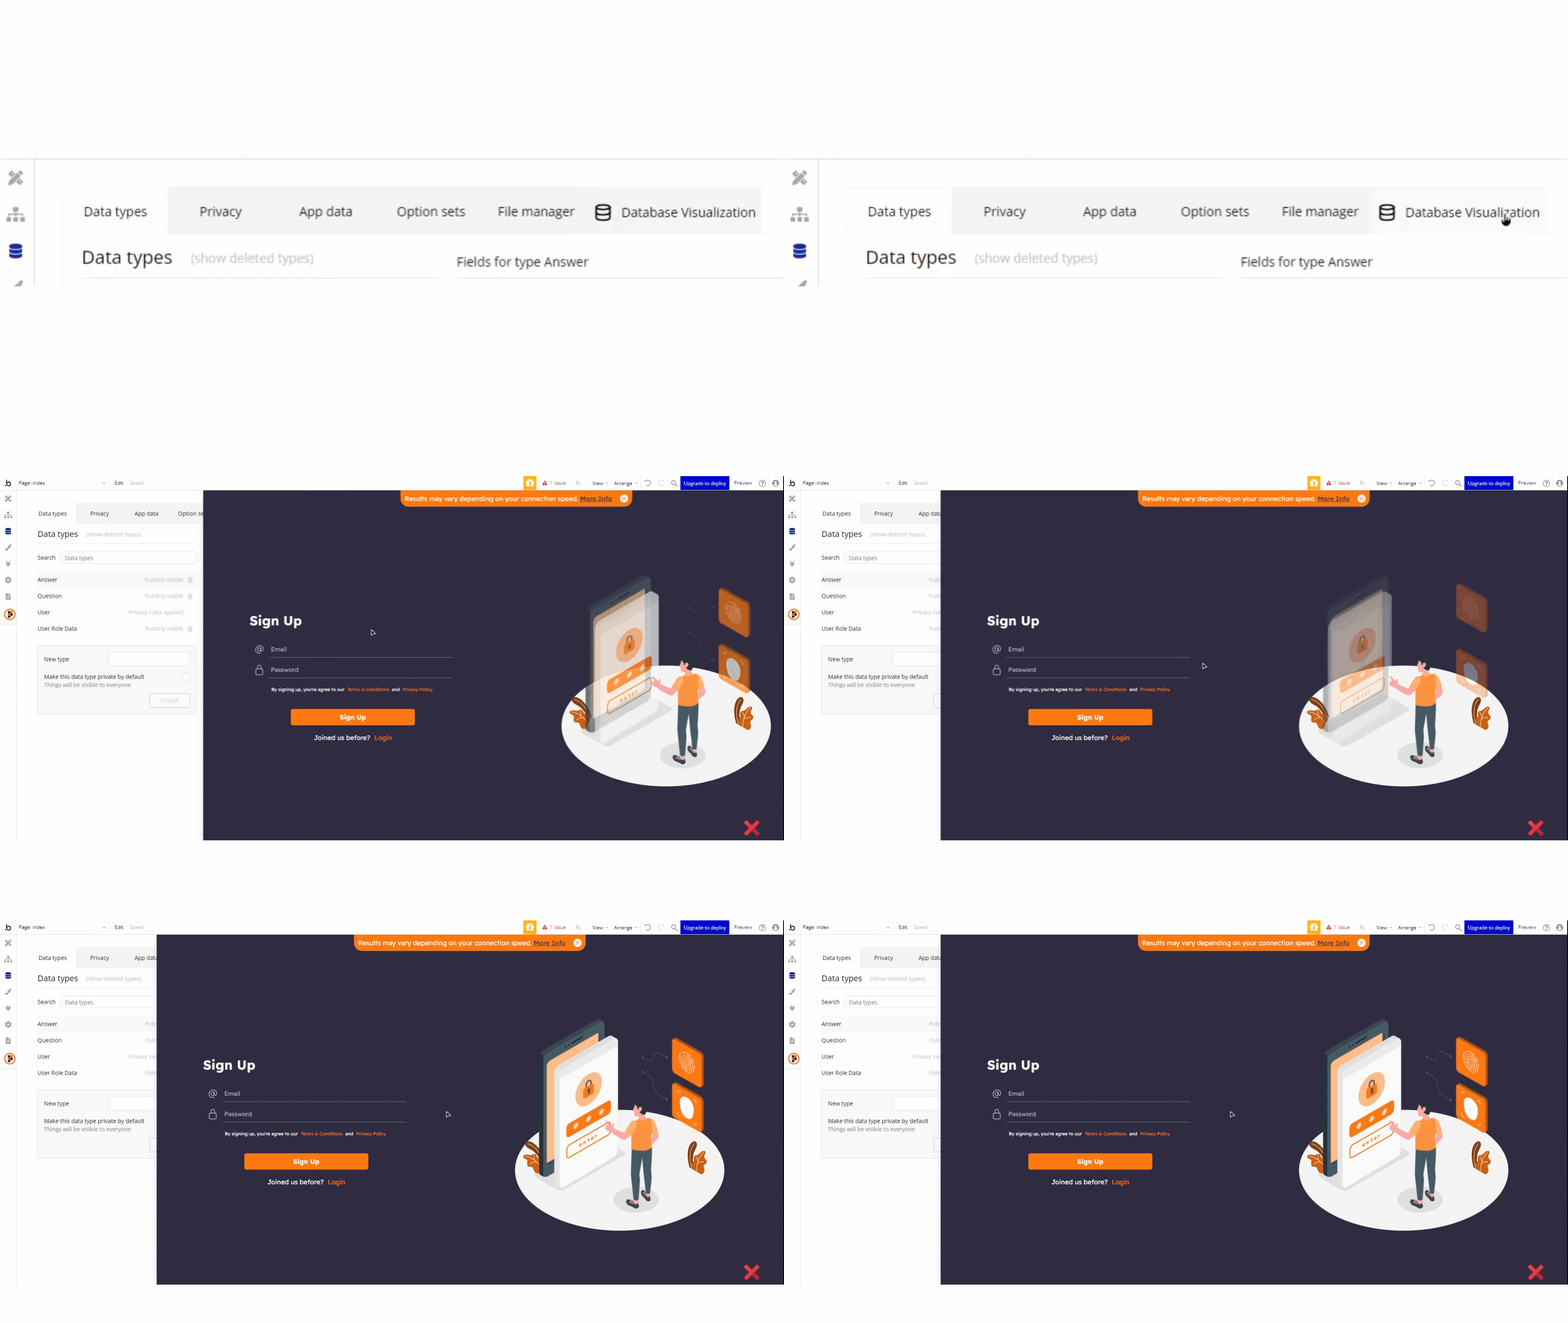
Within the Database Tab, locate and click the Data Visualizer button on the top bar. This action will launch the visualization tool.

4. Sign Up and Get Started
Follow the on-screen prompts to sign up and start using the Data Visualizer. These steps will help you set up and visualize your database effectively.

Conclusion
Transforming your Bubble.io database into a visual schema can revolutionize your interaction with data. With the BubVisch extension, you can unlock deeper insights, enhance data management, and make more informed decisions. Start visualizing today and elevate your data understanding to the next level!
Subscribe to my newsletter
Read articles from Farabiulder directly inside your inbox. Subscribe to the newsletter, and don't miss out.
Written by
