Discovering Grafana Mimir
 Bruno
Bruno
Overview
This is a third article of a LGTM Stack serie.
You must have followed the first two LGTM Stack articles to begin and complete successfully this topic.
All these examples are based on Docker containers.
Third and last topic about the 3 pillars of observability.
We are talking about metrics with Mimir.
This topic aims to discover the very basics of Grafana Mimir.
It guides you through installing Grafana Mimir via the official Docker images for testing purpose.
But what is Mimir ?
In a nutshell, Mimir is an open source, horizontally scalable, highly available, multi-tenant TSDB for long-term storage for Prometheus.
For this topic, we don’t use Prometheus but the integrated scraper of OpenTelemetry collector.
Requirements
Create S3 bucket
I have chosen to store metrics on S3 storage (MinIO).
Refer to the precedent topic of LGTM serie to install MinIO.
Create mimir-blocks bucket
$ export PATH=$PATH:$HOME/minio-binaries/
$ mc alias set myminio http://127.0.0.1:9000/ minioadmin minioadmin
$ mc mb --with-versioning myminio/mimir-blocks
Bucket created successfully `myminio/mimir-blocks`.
Finally, create an Access Key and a Secret Key that will be using by Mimir to store their data.
$ mc admin user svcacct add myminio/ minioadmin
Access Key: SOJVCGETRE485HTATR6T
Secret Key: N3omIitLcpYFKhKBx9pNSTIYT61NZa04N+DyDP+I
Expiration: no-expiry
Copy Access Key and Secret Key and paste them to the below config file.
Install Mimir
As previous topics, let’s install Mimir by using Docker container.
First, let's create a hierarchy folders and collector config file.
$ cd && mkdir -p opentelemetry_demo/mimir && cd opentelemetry_demo/mimir
$ cat << EOF >> mimir-config.yaml
# Do not use this configuration in production.
# It is for demonstration purposes only.
multitenancy_enabled: false

common:
  storage:
    backend: s3
    s3:
      endpoint: minio:9000
      insecure: true
      secret_access_key: "N3omIitLcpYFKhKBx9pNSTIYT61NZa04N+DyDP+I"
      access_key_id: "SOJVCGETRE485HTATR6T"

blocks_storage:
  s3:
    bucket_name: mimir-blocks

compactor:
  data_dir: /tmp/mimir/compactor
  sharding_ring:
    kvstore:
      store: memberlist

distributor:
  ring:
    instance_addr: 127.0.0.1
    kvstore:
      store: memberlist

ingester:
  ring:
    instance_addr: 127.0.0.1
    kvstore:
      store: memberlist
    replication_factor: 1

ruler_storage:
  backend: filesystem
  filesystem:
    dir: /tmp/mimir/rules

store_gateway:
  sharding_ring:
    replication_factor: 1
EOF
We are ready to create and run Mimir container
$ docker run -d \
  --name mimir \
  --hostname mimir \
  --network=lgtm \
  -v $(pwd)/mimir-config.yaml:/etc/mimir/config.yaml \
  grafana/mimir:2.13.0 \
  -config.file=/etc/mimir/config.yaml
Configure OpenTelemetry collector
Next step is editing the OpenTelemetry collector config file stored in ~/opentelemetry_demo/otelco/config.yaml by adding a receiver and an exporter for the metrics.
receivers:
  otlp:
    protocols:
      grpc:
        endpoint: 0.0.0.0:4317
      http:
        endpoint: 0.0.0.0:4318
  prometheus:
    config:
      scrape_configs:
      - job_name: 'otel-collector'
        scrape_interval: 10s
        static_configs:
        - targets: ['0.0.0.0:8888']

processors:
  batch:

exporters:
  otlp:
    endpoint: tempo:4317
    tls:
      insecure: true
  otlphttp:
    endpoint: http://loki:3100/otlp
  prometheusremotewrite:
    endpoint: http://mimir:8080/api/v1/push

extensions:
  health_check:
  pprof:
  zpages:

service:
  extensions: [health_check, pprof, zpages]
  pipelines:
    traces:
      receivers: [otlp]
      processors: [batch]
      exporters: [otlp]
    logs:
      receivers: [otlp]
      processors: [batch]
      exporters: [otlphttp]
    metrics:
      receivers: [prometheus]
      processors: [batch]
      exporters: [prometheusremotewrite]
📌 The Prometheus receiver supports the Prometheus config file out of the box, with very few limitations.
You can add multiple scraping configurations as you do with Prometheus.
When done, restart OpenTelemetry container.
$ docker restart otelco
Configure Grafana
Finally, we need to add Mimir data source with following :
Log in to the Grafana GUI and select Connections > Add new connection on the to left sandwich menu.
Search prometheus and select it.
Click on the top right button Add new data source

Fill in these fields :
Name: Mimir
URL : http://mimir:8080/prometheus
In Performance tab :
Prometheus type : Mimir
Mimir version : > 2.9.x
Keep the other fields by default.
And click on Save & test button.

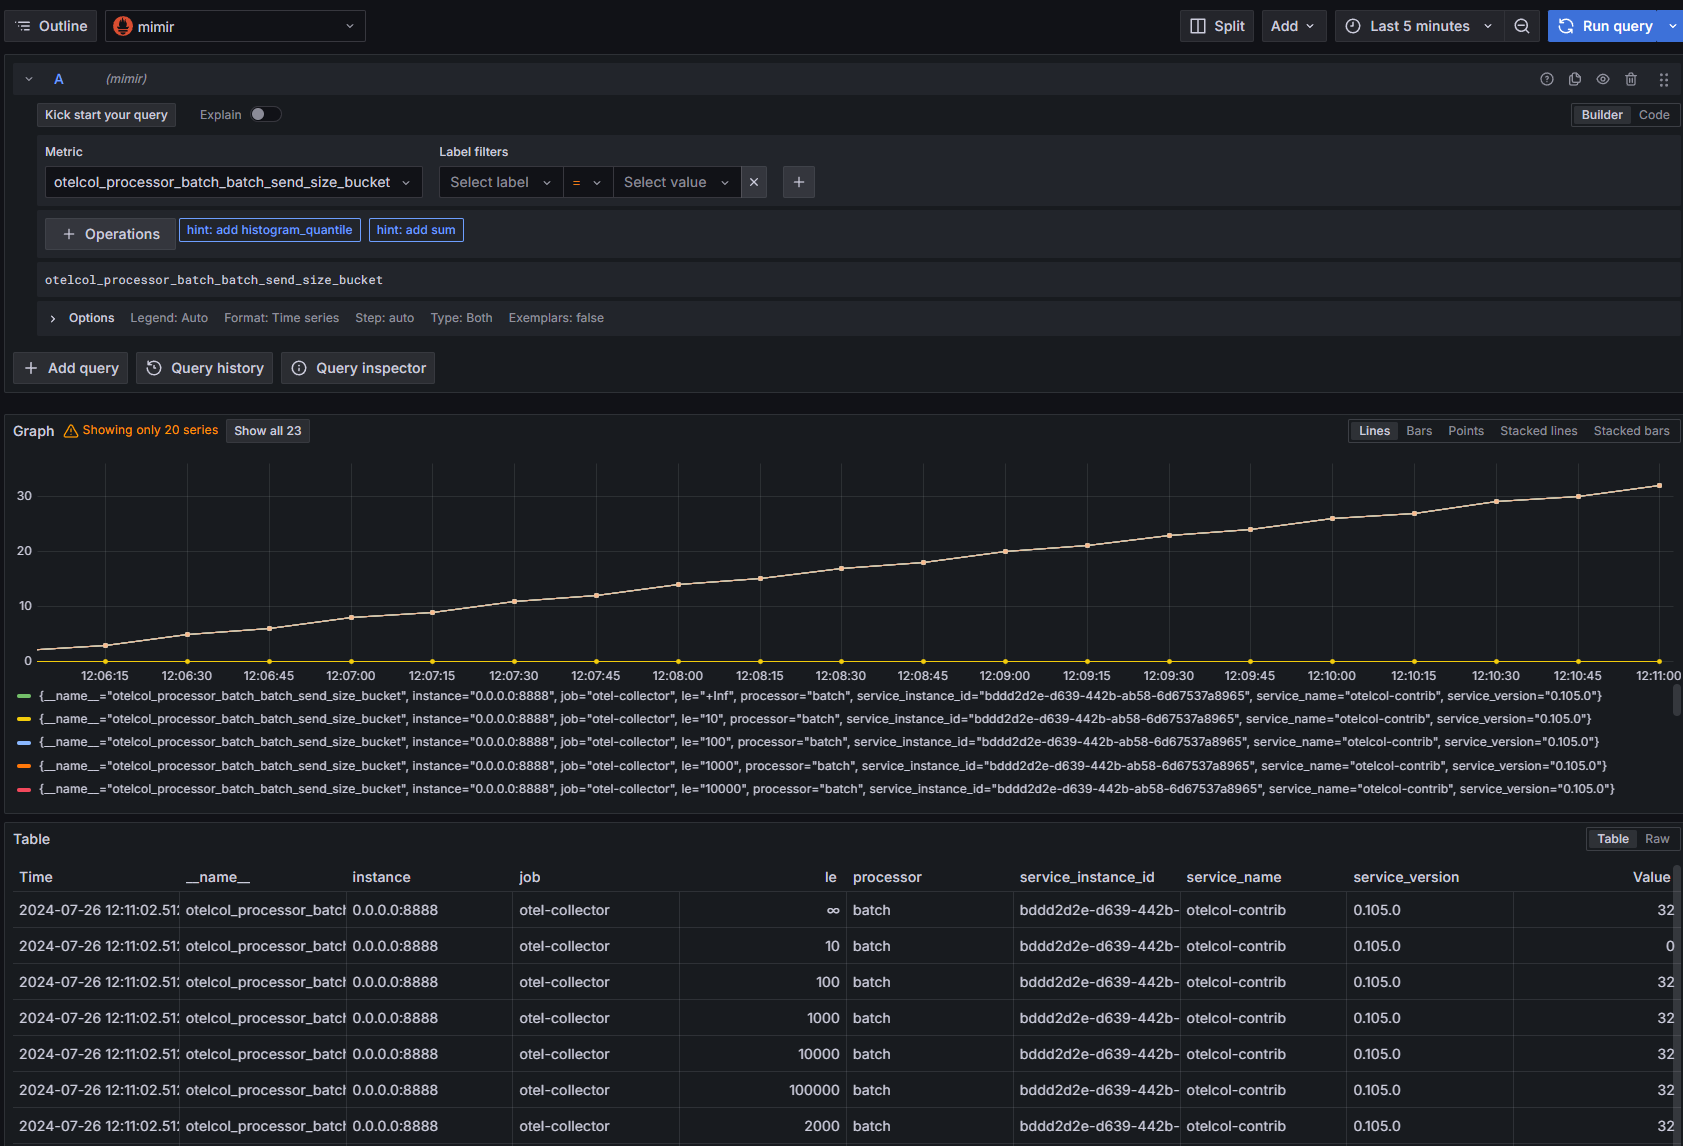
We should now explore the metrics with Grafana.

Now, let's enjoy and create many dashboards.
Sources :
https://grafana.com/docs/mimir/latest/get-started/
https://grafana.com/docs/mimir/latest/configure/configure-object-storage-backend/
https://grafana.com/docs/mimir/latest/configure/configure-otel-collector/
Subscribe to my newsletter
Read articles from Bruno directly inside your inbox. Subscribe to the newsletter, and don't miss out.
Written by

Bruno
Bruno
Depuis août 2024, j'accompagne divers projets sur l'optimisation des processus DevOps. Ces compétences, acquises par plusieurs années d'expérience dans le domaine de l'IT, me permettent de contribuer de manière significative à la réussite et l'évolution des infrastructures de mes clients. Mon but est d'apporter une expertise technique pour soutenir la mission et les valeurs de mes clients, en garantissant la scalabilité et l'efficacité de leurs services IT.