How to Customize the Fastify Logger
 Manuel Salinardi
Table of contents

Intro
Fastify uses pino as its logger, one of the most performant loggers for Node.js.
So generally, to customize the Fastify logger, you apply the same concepts to customize pino, with a few exceptions that we will see in this article.
For this article, Node.js v20.13.1 was used.
Enable the logger
By default, the Fastify logger is disabled. To enable it, simply set it to true when initializing Fastify.
const fastify = Fastify({
  logger: true
})
Let's write the first log
To see the first log example, let's create a simple Fastify project, which we will use for all the other examples in this article.
Let's create the Fastify project
Let's create and enter the project folder
mkdir my-logger
cd my-logger
Let's install Fastify in the project
npm install fastify
This is the content of the generated package.json file:
{
  "dependencies": {
    "fastify": "^4.28.1"
  }
}
Let's create the index.js file
// import Fastify
const Fastify = require('fastify')

// initialize Fastify
const fastify = Fastify({
  logger: true // enable the logger (disabled by default)
})

// start logging
fastify.log.info('Hello Log!')
We haven't started any server; we have only initialized Fastify, and this is enough to start logging.
Run the file with the command:
node server
As output, we will get an object similar to this:
{"level":30,"time":1721369918925,"pid":85758,"hostname":"Manuels-MacBook-Pro.local","msg":"Hello World!"}
Let's format it better to analyze it:
{
   "level":30, // 30 represents the level of information due from: fastify.log.info
   "time":1721369918925, // Unix time in milliseconds ( epoch time )
   "pid":85758, // process id (equivalent to process.pid)
   "hostname":"Manuels-MacBook-Pro.local", // the host name of the operating system. ( equivalent to require('os').hostname() )
   "msg":"Hello World!" // the string we logged
}
We can see from our simple log call:
fastify.log.info('Hello Log!')
Only "msg" is actually what we wrote; all the other fields were added by Pino and will be included with every call to the logger.
Customize the Logger
We have seen that by default, when we make a call to the logger, a JSON object is logged where our message is placed as the value of the "msg" field.
But Pino also adds the fields:
"level"
"time"
"pid"
"hostname"
In this section, we will see how to customize them one by one.
level
Before customizing the "level" field, let's see how it works.
In Pino, there are different log levels:
"fatal" | "error" | "warn" | "info" | "debug" | "trace".
For each level, there is a corresponding method:
const Fastify = require('fastify')

const fastify = Fastify({
  logger: true
})

fastify.log.fatal('Hello fatal!')
fastify.log.error('Hello error!')
fastify.log.warn('Hello warn!')
fastify.log.info('Hello info!')
fastify.log.debug('Hello debug!')
fastify.log.trace('Hello trace!')
The code above will generate the following output:
{"level":60,"time":1722405654790,"pid":57113,"hostname":"Manuels-MacBook-Pro.local","msg":"Hello fatal!"}
{"level":50,"time":1722405654790,"pid":57113,"hostname":"Manuels-MacBook-Pro.local","msg":"Hello error!"}
{"level":40,"time":1722405654790,"pid":57113,"hostname":"Manuels-MacBook-Pro.local","msg":"Hello warn!"}
{"level":30,"time":1722405654790,"pid":57113,"hostname":"Manuels-MacBook-Pro.local","msg":"Hello info!"}
But there's something strange, because from the code we called the logger 6 times, but only 4 were generated?
"Hello fatal!"
"Hello error!"
"Hello warn!"
"Hello info!"
Missing are:
"Hello debug!"
"Hello trace!"
Where did they go?
Pino associates a numeric value to each level:
"fatal" = 60
"error" = 50
"warn" = 40
"info" = 30
"debug" = 20
"trace" = 10
Which we can see in the "level" field of the generated logs.
By default, logs below level 30, or "info", are discarded.
To change this default and see logs of all levels, you need to set the logger level field like this:
const fastify = Fastify({
  logger: {
    level: 'trace'
  }
})
Now we see that all 6 logs are there:
{"level":60,"time":1722406770355,"pid":57832,"hostname":"Manuels-MacBook-Pro.local","msg":"Hello fatal!"}
{"level":50,"time":1722406770355,"pid":57832,"hostname":"Manuels-MacBook-Pro.local","msg":"Hello error!"}
{"level":40,"time":1722406770355,"pid":57832,"hostname":"Manuels-MacBook-Pro.local","msg":"Hello warn!"}
{"level":30,"time":1722406770355,"pid":57832,"hostname":"Manuels-MacBook-Pro.local","msg":"Hello info!"}
{"level":20,"time":1722406770355,"pid":57832,"hostname":"Manuels-MacBook-Pro.local","msg":"Hello debug!"}
{"level":10,"time":1722406770355,"pid":57832,"hostname":"Manuels-MacBook-Pro.local","msg":"Hello trace!"}
Now that we understand how the "level" field works, let's see how to customize it:
const fastify = Fastify({
  logger: {
    formatters: {
      level (label, number) {
        // these fields will be replaced by the default "level" field
        return {
          myLevel: `${label}-${number}`,
          levelName: label,
          levelNumber: number
        }
      }
    }
  }
})
Now the generated logs will be in this format:
{"myLevel":"fatal-60","levelName":"fatal","levelNumber":60,"time":1722576879835,"pid":90770,"hostname":"Manuels-MacBook-Pro.local","msg":"Hello fatal!"}
{"myLevel":"error-50","levelName":"error","levelNumber":50,"time":1722576879835,"pid":90770,"hostname":"Manuels-MacBook-Pro.local","msg":"Hello error!"}
{"myLevel":"warn-40","levelName":"warn","levelNumber":40,"time":1722576879835,"pid":90770,"hostname":"Manuels-MacBook-Pro.local","msg":"Hello warn!"}
{"myLevel":"info-30","levelName":"info","levelNumber":30,"time":1722576879835,"pid":90770,"hostname":"Manuels-MacBook-Pro.local","msg":"Hello info!"}
As we can see from the logs, now instead of the "level" field we find 3 more:
"myLevel"
"levelName"
"levelNumber
time
You can customize the time field by setting the "timestamp" field as follows:
const Fastify = require('fastify')
const pino = require('pino')

const fastify = Fastify({
  logger: {
    timestamp: pino.stdTimeFunctions.isoTime, // convert from epoch time to ISO time
  }
})

fastify.log.info('Hello info!')
{
   "level":30,
   "time":"2024-07-18T06:48:52.040Z", // ISO Time
   "pid":19929,
   "hostname":"Manuels-MacBook-Pro.local",
   "msg":"Hello info"
}
Pino provides us with the following functions for formatting the "timestamp":
pino.stdTimeFunctions.epochTime: Milliseconds since Unix epoch (Default)pino.stdTimeFunctions.unixTime: Seconds since Unix epochpino.stdTimeFunctions.nullTime: Clears timestamp property (Used whentimestamp: false)pino.stdTimeFunctions.isoTime: ISO 8601-formatted time in UTC
From the official documentation: Pino stdTimeFunctions
pid e hostname
To customize the "pid" and "hostname" fields you need to customize the bindings.
Bindings are additional data that can be associated with a logger to be included in all logs generated by that logger. This data is used to enrich the log information without having to manually specify this information each time a log call is made.
By default Pino logger adds in the bindings: "pid" and "hostname", so to remove them and add fields to our liking we have to modify the bindings in this way:
const Fastify = require('fastify')
const os = require('os')

const fastify = Fastify({
  logger: {
    formatters: {
      bindings: (bindings) => {
        return {
          osMachine: os.machine(),
          osType: os.type()
        };
      },
    },
  }
})

fastify.log.info('Hello info!')
{
   "level":30,
   "time":1721283756521,
   "osMachine":"arm64",
   "osType":"Darwin",
   "msg":"Hello info!"
}
We see that "pid" and "hostname" are gone, but in their place are "osMachine" and "osType".
Instead of replacing "pid" and "hostname" we can also keep them and add fields like this:
const fastify = Fastify({
  logger: {
    formatters: {
      bindings: (bindings) => {
        return {
          pid: bindings.pid,
          hostname: bindings.hostname,
          osMachine: os.machine(),
          osType: os.type()
        };
      },
    },
  }
})

fastify.log.info('Hello info!')
{
   "level":30,
   "time":1722577623975,
   "pid":91371,
   "hostname":"Manuels-MacBook-Pro.local",
   "osMachine":"arm64",
   "osType":"Darwin",
   "msg":"Hello info!"
}
What is Request Logger?
Up until now we have used the Fastify logger but without ever starting a server. Fastify provides us with a very useful feature called "Request Logger". Now with some practical examples we will see how it works and how to customize it.
Let's create the server
 const Fastify = require('fastify')

const fastify = Fastify({
  logger: true
})

// Declare the route GET /
fastify.get('/', async function handler (request, reply) {
  fastify.log.info('Fastify logger!')
  // note that request.log is used instead of fastify.log
  // unlike the previous examples
  request.log.info('Request logger!')
  return { hello: 'world' }
})

// Start the server on port 3000
fastify.listen({ port: 3000 }, (err) => {
  if (err) {
    fastify.log.error(err)
    process.exit(1)
  }
})
In this server we have defined only one GET route "/" which:
log the string "Fastify logger!" (with fastify.log)
log the string "Request logger!" (with request.log)
returns the object as response: { hello: 'world' }
Note that for the first log "fastify.log" is used for the second "request.log". Then we will see with an example what is the difference between the two.
Let's start the server with:
node server
When the server starts we will see some logs automatically generated by Fastify like this:
{"level":30,"time":1720591420640,"pid":69286,"hostname":"Manuels-MacBook-Pro.local","msg":"Server listening at http://127.0.0.1:3000"}
{"level":30,"time":1720591420643,"pid":69286,"hostname":"Manuels-MacBook-Pro.local","msg":"Server listening at http://[::1]:3000"}
First HTTP call
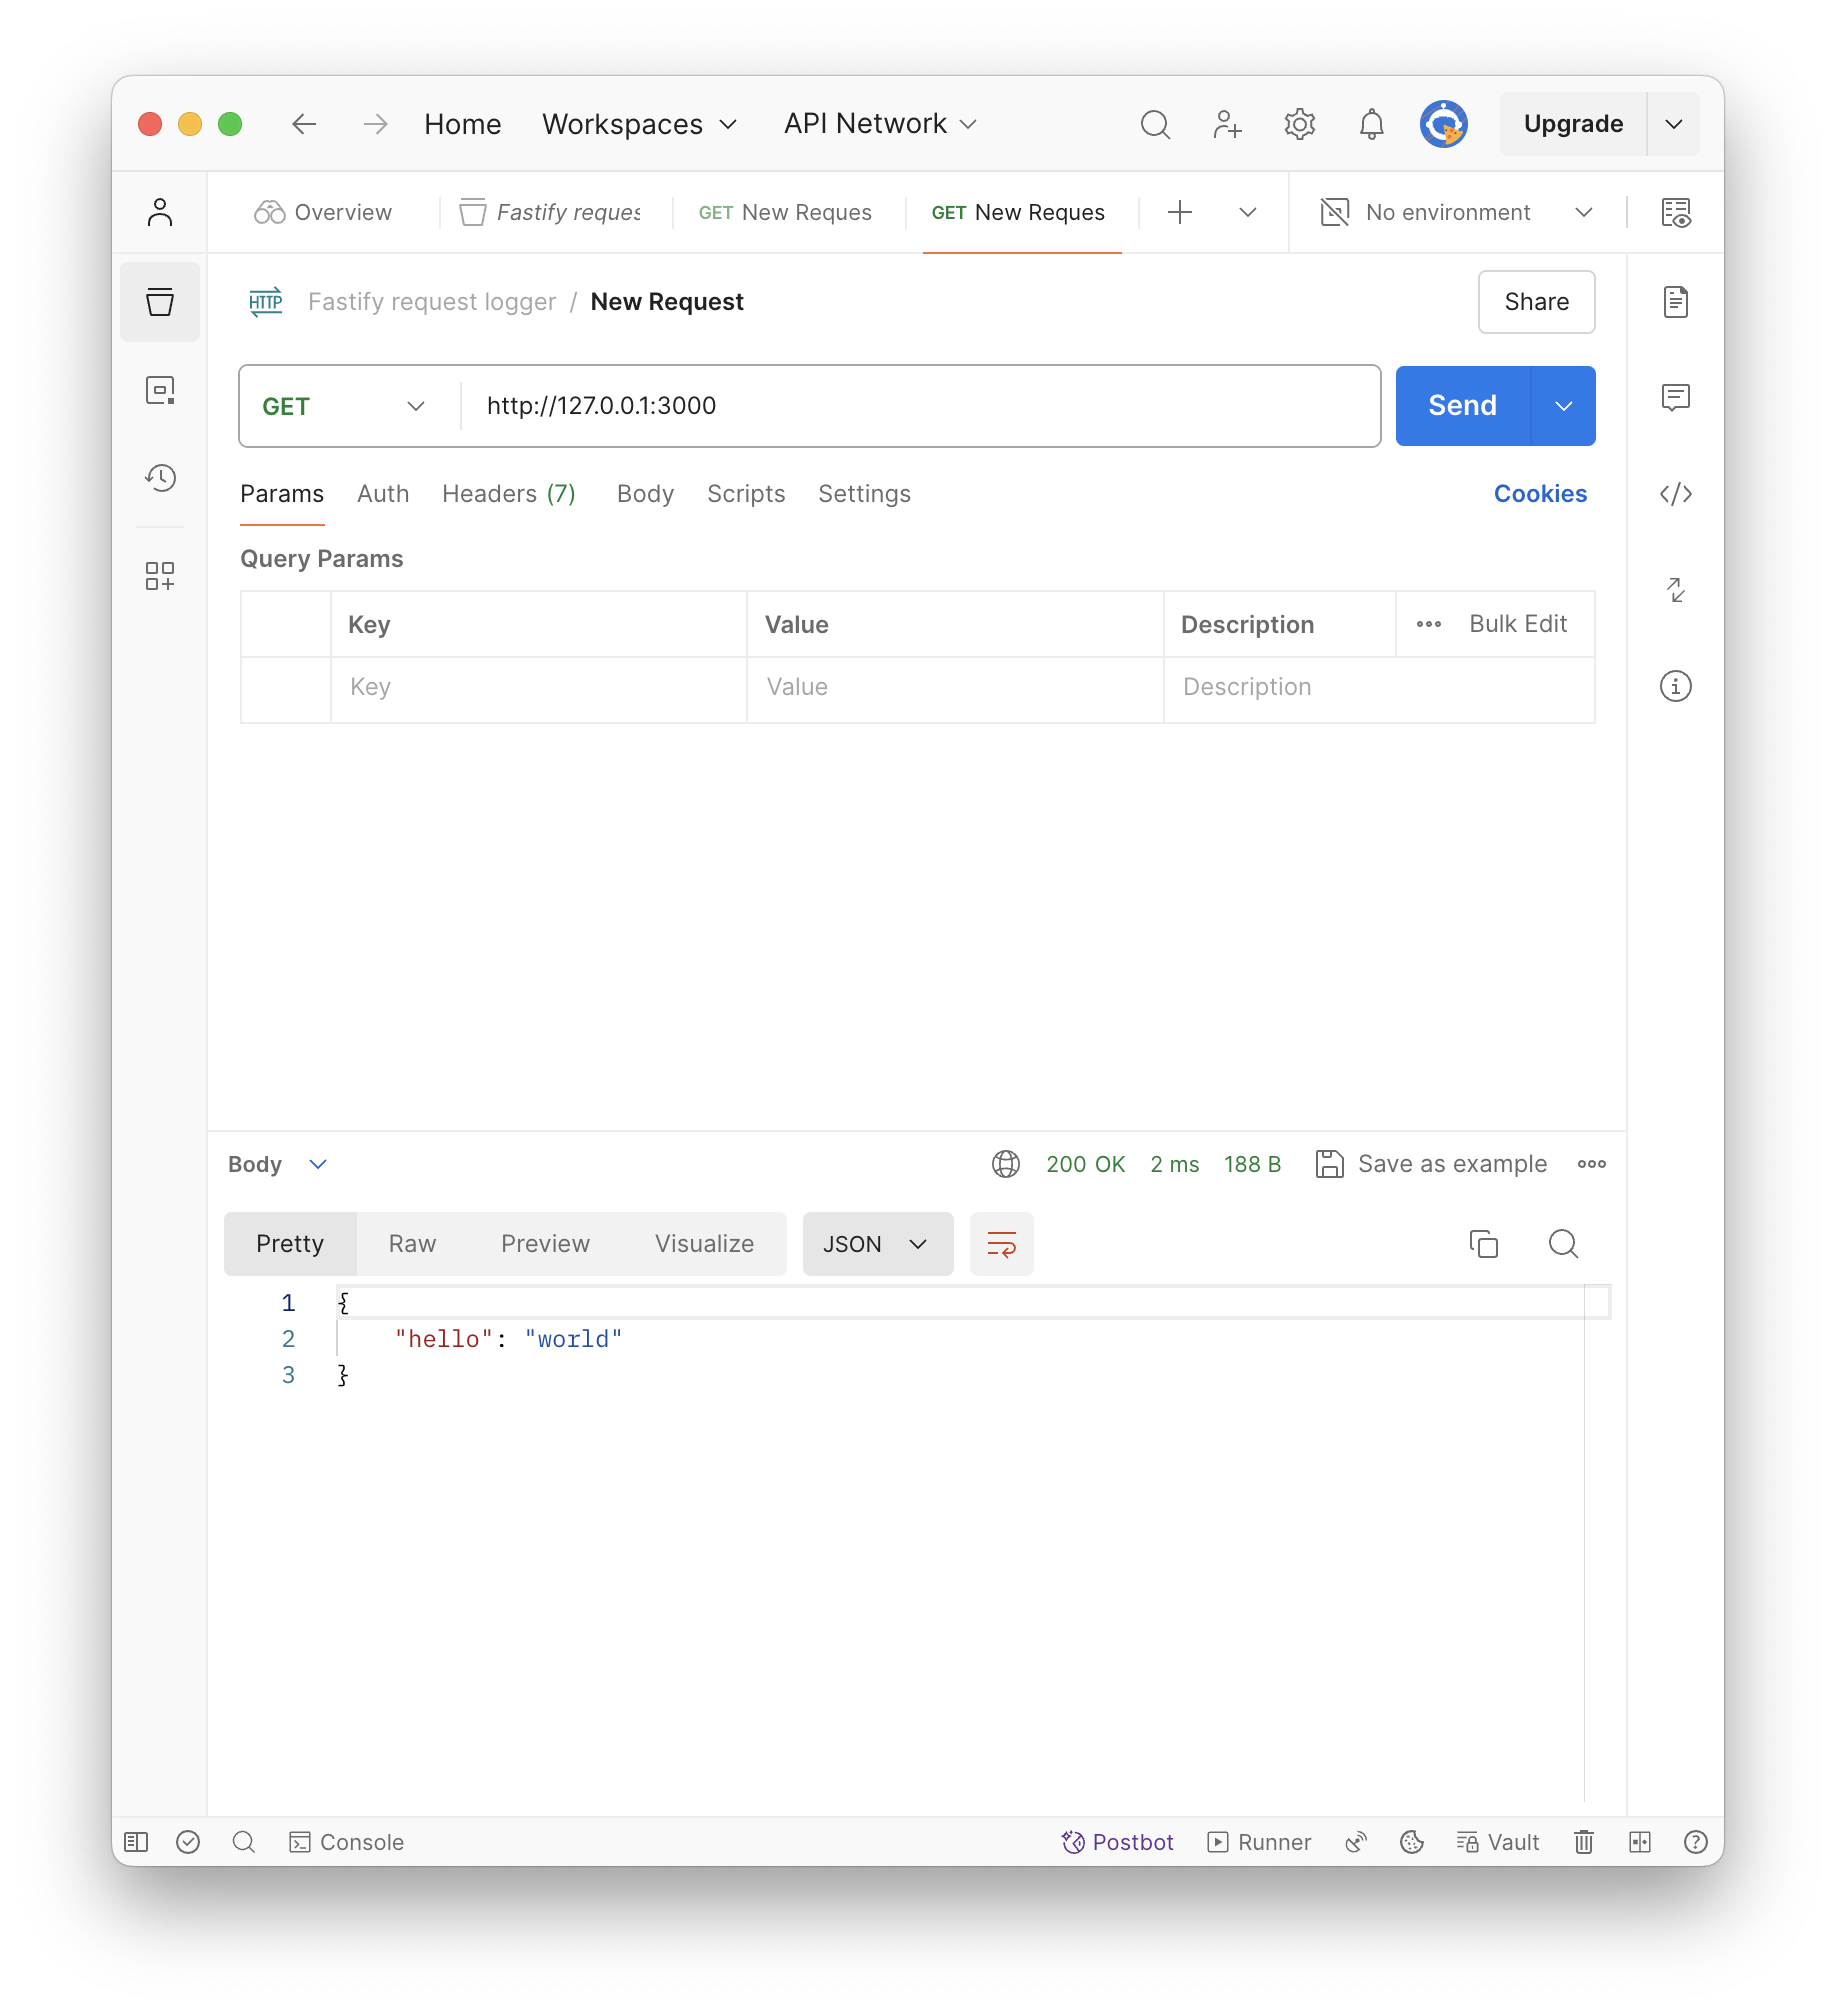
Now let's try to make an HTTP call, for example with Postman to our newly created single route.

This call generated 4 logs:
// auto generated by Fastify (when receiving an HTTP request)
{
   "level":30,
   "time":1720678823876,
   "pid":2292,
   "hostname":"Manuels-MacBook-Pro.local",
   "reqId":"req-1",
   "req":{
      "method":"GET",
      "url":"/",
      "hostname":"127.0.0.1:3000",
      "remoteAddress":"127.0.0.1",
      "remotePort":63548
   },
   "msg":"incoming request"
}

// generated by us with fastify.log.info('Fastify logger!')
{
   "level":30,
   "time":1720678823877,
   "pid":2292,
   "hostname":"Manuels-MacBook-Pro.local",
   "msg":"Fastify logger!"
}

// generated by us with request.log.info('Request logger!')
{
   "level":30,
   "time":1720678823877,
   "pid":2292,
   "hostname":"Manuels-MacBook-Pro.local",
   "reqId":"req-1",
   "msg":"Request logger!"
}

// auto generated by Fastify (when sending an HTTP response)
{
   "level":30,
   "time":1720678823880,
   "pid":2292,
   "hostname":"Manuels-MacBook-Pro.local",
   "reqId":"req-1",
   "res":{
      "statusCode":200
   },
   "responseTime":3.9882499873638153,
   "msg":"request completed"
}
There is an intruder among the four logs, can you see it?
The intruder is the second one: "Fastify logger!"
In fact we can see that it is the only one that does not have the "reqId". It does not have the "reqId" because it is the only one that was not generated by the request logger.
For each request Fastify generates a "reqId" useful to connect all the logs to that specific request, in our case:
"incoming request" was generated by Fastify upon receiving the request, and a unique id "reqId":"req-1" was created for this request.
"Fastify logger!" was generated by us with fastify.log.info('Fastify logger!'), but since we used fastify.log, this log will not be part of the request context, so "reqId":"req-1" will not be logged.
"Request logger!" was generated by us with request.log.info('Request logger!'), in this case since we used request.log, this log will be part of the request context so "reqId":"req-1" will be logged.
"request completed" was generated by Fastify when the request was completed and the response was sent.
Disable the request logger
const app = Fastify({
  disableRequestLogging: true, // disable the request logger
  logger: true
})
Simply set disableRequestLogging to true to prevent Fastify from automatically generating logs when receiving the request and sending the response.
Let's see the previous example with the request logger disabled:
 const Fastify = require('fastify')

const fastify = Fastify({
  disableRequestLogging: true, // disable the request logger
  logger: true
})

// declare the route GET /
fastify.get('/', async function handler (request, reply) {
  fastify.log.info('Fastify logger!') // logged
  request.log.info('Request logger!') // it is still logged
  return { hello: 'world' }
})

// start the server on the port 3000
fastify.listen({ port: 3000 }, (err) => {
  if (err) {
    fastify.log.error(err)
    process.exit(1)
  }
})
Let's start the server:
node server
{"level":30,"time":1722320649945,"pid":20123,"hostname":"Manuels-MacBook-Pro.local","msg":"Server listening at http://[::1]:3000"}
{"level":30,"time":1722320649947,"pid":20123,"hostname":"Manuels-MacBook-Pro.local","msg":"Server listening at http://127.0.0.1:3000"}
Automatic logs at server startup are still generated.
Let's make the HTTP call again with Postman:

{"level":30,"time":1722320840449,"pid":20123,"hostname":"Manuels-MacBook-Pro.local","msg":"Fastify logger!"}
{"level":30,"time":1722320840449,"pid":20123,"hostname":"Manuels-MacBook-Pro.local","reqId":"req-1","msg":"Request logger!"}
We see that now there are only 2 logs, the ones automatically generated by Fastify are missing:
"incoming request"
"request completed"
But the request logger we invoked manually with:
request.log.info('Request logger!')
It is still logged.
Customize the Request Logger
The Request Logger is used in the following cases:
explicitly called with method: "request.log"
automatically called by Fastify on every new HTTP request received
automatically called by Fastify on every HTTP response sent
automatically called by Fastify for every exception thrown inside a route (we haven't seen it yet but we'll see it later)
Let's review them one by one:
// called explicitly with the method: "request.log"
{
   "level":30,
   "time":1720678823877,
   "pid":2292,
   "hostname":"Manuels-MacBook-Pro.local",
   "reqId":"req-1",
   "msg":"Request logger!"
}

// automatically called by Fastify with each new HTTP request received
{
   "level":30,
   "time":1720678823876,
   "pid":2292,
   "hostname":"Manuels-MacBook-Pro.local",
   "reqId":"req-1",
   "req":{
      "method":"GET",
      "url":"/",
      "hostname":"127.0.0.1:3000",
      "remoteAddress":"127.0.0.1",
      "remotePort":63548
   },
   "msg":"incoming request"
}

// automatically called by Fastify with each HTTP response sent
{
   "level":30,
   "time":1720678823880,
   "pid":2292,
   "hostname":"Manuels-MacBook-Pro.local",
   "reqId":"req-1",
   "res":{
      "statusCode":200
   },
   "responseTime":3.9882499873638153,
   "msg":"request completed"
}

// automatically called by Fastify on every exception thrown within a route
{
   "level":50,
   "time":1720766398542,
   "pid":40069,
   "hostname":"Manuels-MacBook-Pro.local",
   "reqId":"req-1",
   "req":{
      "method":"GET",
      "url":"/",
      "hostname":"127.0.0.1:3000",
      "remoteAddress":"127.0.0.1",
      "remotePort":54858
   },
   "res":{
      "statusCode":500
   },
   "err":{
      "type":"Error",
      "message":"Boom!",
      "stack":"Error: Boom!\n    at Object..."
   },
   "msg":"Boom!"
}
So we can see that the following fields are added from the Request Logger:
"reqId"
"req"
"res"
"err"
In this section we will see how to customize them one by one.
reqId
The first thing we can customize about the request logger is the "reqId", with the method: genReqId
let currentId = 1

const fastify = Fastify({
  logger: true,
  genReqId: (req) => {
    return `my-custom-id-${currentId++}`
  }
})
{
   "level":30,
   "time":1722580879611,
   "pid":93284,
   "hostname":"Manuels-MacBook-Pro.local",
   "reqId":"my-custom-id-1", // generated by our genReqId
   "msg":"Request logger!"
}
req e res
How do we customize the "req" and "res" objects that are logged? For example, add or remove fields?
You use the serializers object for this:
const fastify = Fastify({
  logger: {
    serializers: {
      req (request) { // in req we only want: method and url
        return {
          method: request.method,
          url: request.url,
        };
      },
      res (reply) { // in res we want: method, url and statusCode
        return {
          method: reply.request.method,
          url: reply.request.url,
          statusCode: reply.statusCode
        }
      },
    }
  }
})
// req now contains only method and url
// instead of the default: method, url, hostname, remoteAddress, remotePort
{
   "level":30,
   "time":1720765071638,
   "pid":38418,
   "hostname":"Manuels-MacBook-Pro.local",
   "reqId":"req-1",
   "req":{
      "method":"GET",
      "url":"/"
   },
   "msg":"incoming request"
}

// this log is not affected by serializers because it contains neither req nor res
{
   "level":30,
   "time":1720765071638,
   "pid":38418,
   "hostname":"Manuels-MacBook-Pro.local",
   "msg":"Fastify logger!"
}

// This log is also not affected by the serializers because it contains neither req nor res
{
   "level":30,
   "time":1720765071638,
   "pid":38418,
   "hostname":"Manuels-MacBook-Pro.local",
   "reqId":"req-1",
   "msg":"Request logger!"
}

// now res contains: method, url, statusCode
// instead of the default: statusCode
{
   "level":30,
   "time":1720765071640,
   "pid":38418,
   "hostname":"Manuels-MacBook-Pro.local",
   "reqId":"req-1",
   "res":{
      "method":"GET",
      "url":"/",
      "statusCode":200
   },
   "responseTime":2.362499952316284,
   "msg":"request completed"
}
err
If an exception is generated inside a route, Fastify handles it and logs it for us automatically, let's see an example.
Let's throw an exception in our route:
fastify.get('/', async function handler (request, reply) {
  throw Error('Boom!') // this will generate the error
  fastify.log.info('Fastify logger!')
  request.log.info('Request logger!')
  return { hello: 'world' }
})
If we try to make the HTTP call to GET "/" we will see this log generated:
{
   "level":50,
   "time":1720766398542,
   "pid":40069,
   "hostname":"Manuels-MacBook-Pro.local",
   "reqId":"req-1",
   "req":{
      "method":"GET",
      "url":"/",
      "hostname":"127.0.0.1:3000",
      "remoteAddress":"127.0.0.1",
      "remotePort":54858
   },
   "res":{
      "statusCode":500
   },
   // fastify by default logs an err object, with inside: type, message and stack
   "err":{
      "type":"Error",
      "message":"Boom!",
      "stack":"Error: Boom!\n    at Object.handler (/Users/manuelsalinardi/..."
   },
   "msg":"Boom!"
}
We see that for the error, Fastify generates a log with the object "err" inside.
What if we don't want to log the stack for security reasons?
Again, we can customize the "err" object as we did with the "req" and "res" objects, using the serializers object:
const fastify = Fastify({
  logger: {
    serializers: {
      req (request) {
        return {
          method: request.method,
          url: request.url,
        };
      },
      res (reply) {
        return {
          method: reply.request.method,
          url: reply.request.url,
          statusCode: reply.statusCode
        }
      },
      // here we customize the err object
      err (error) {
        return {
          type: error.name,
          message: error.message,
        }
      }
    }
  }
})
This is the log generator:
{
   "level":50,
   "time":1720767139181,
   "pid":40774,
   "hostname":"Manuels-MacBook-Pro.local",
   "reqId":"req-1",
   "req":{
      "method":"GET",
      "url":"/"
   },
   "res":{
      "method":"GET",
      "url":"/",
      "statusCode":500
   },
   // now stack is no longer present
   "err":{
      "type":"Error",
      "message":"Boom!"
   },
   "msg":"Boom!"
}
How to add new fields to the Request Logger
Fastify helps us to correlate all the logs of a specific request with each other via the "reqId" field.
We have seen that we can also customize "reqId", but how do we add another field similar to "reqId", but chosen to our liking?
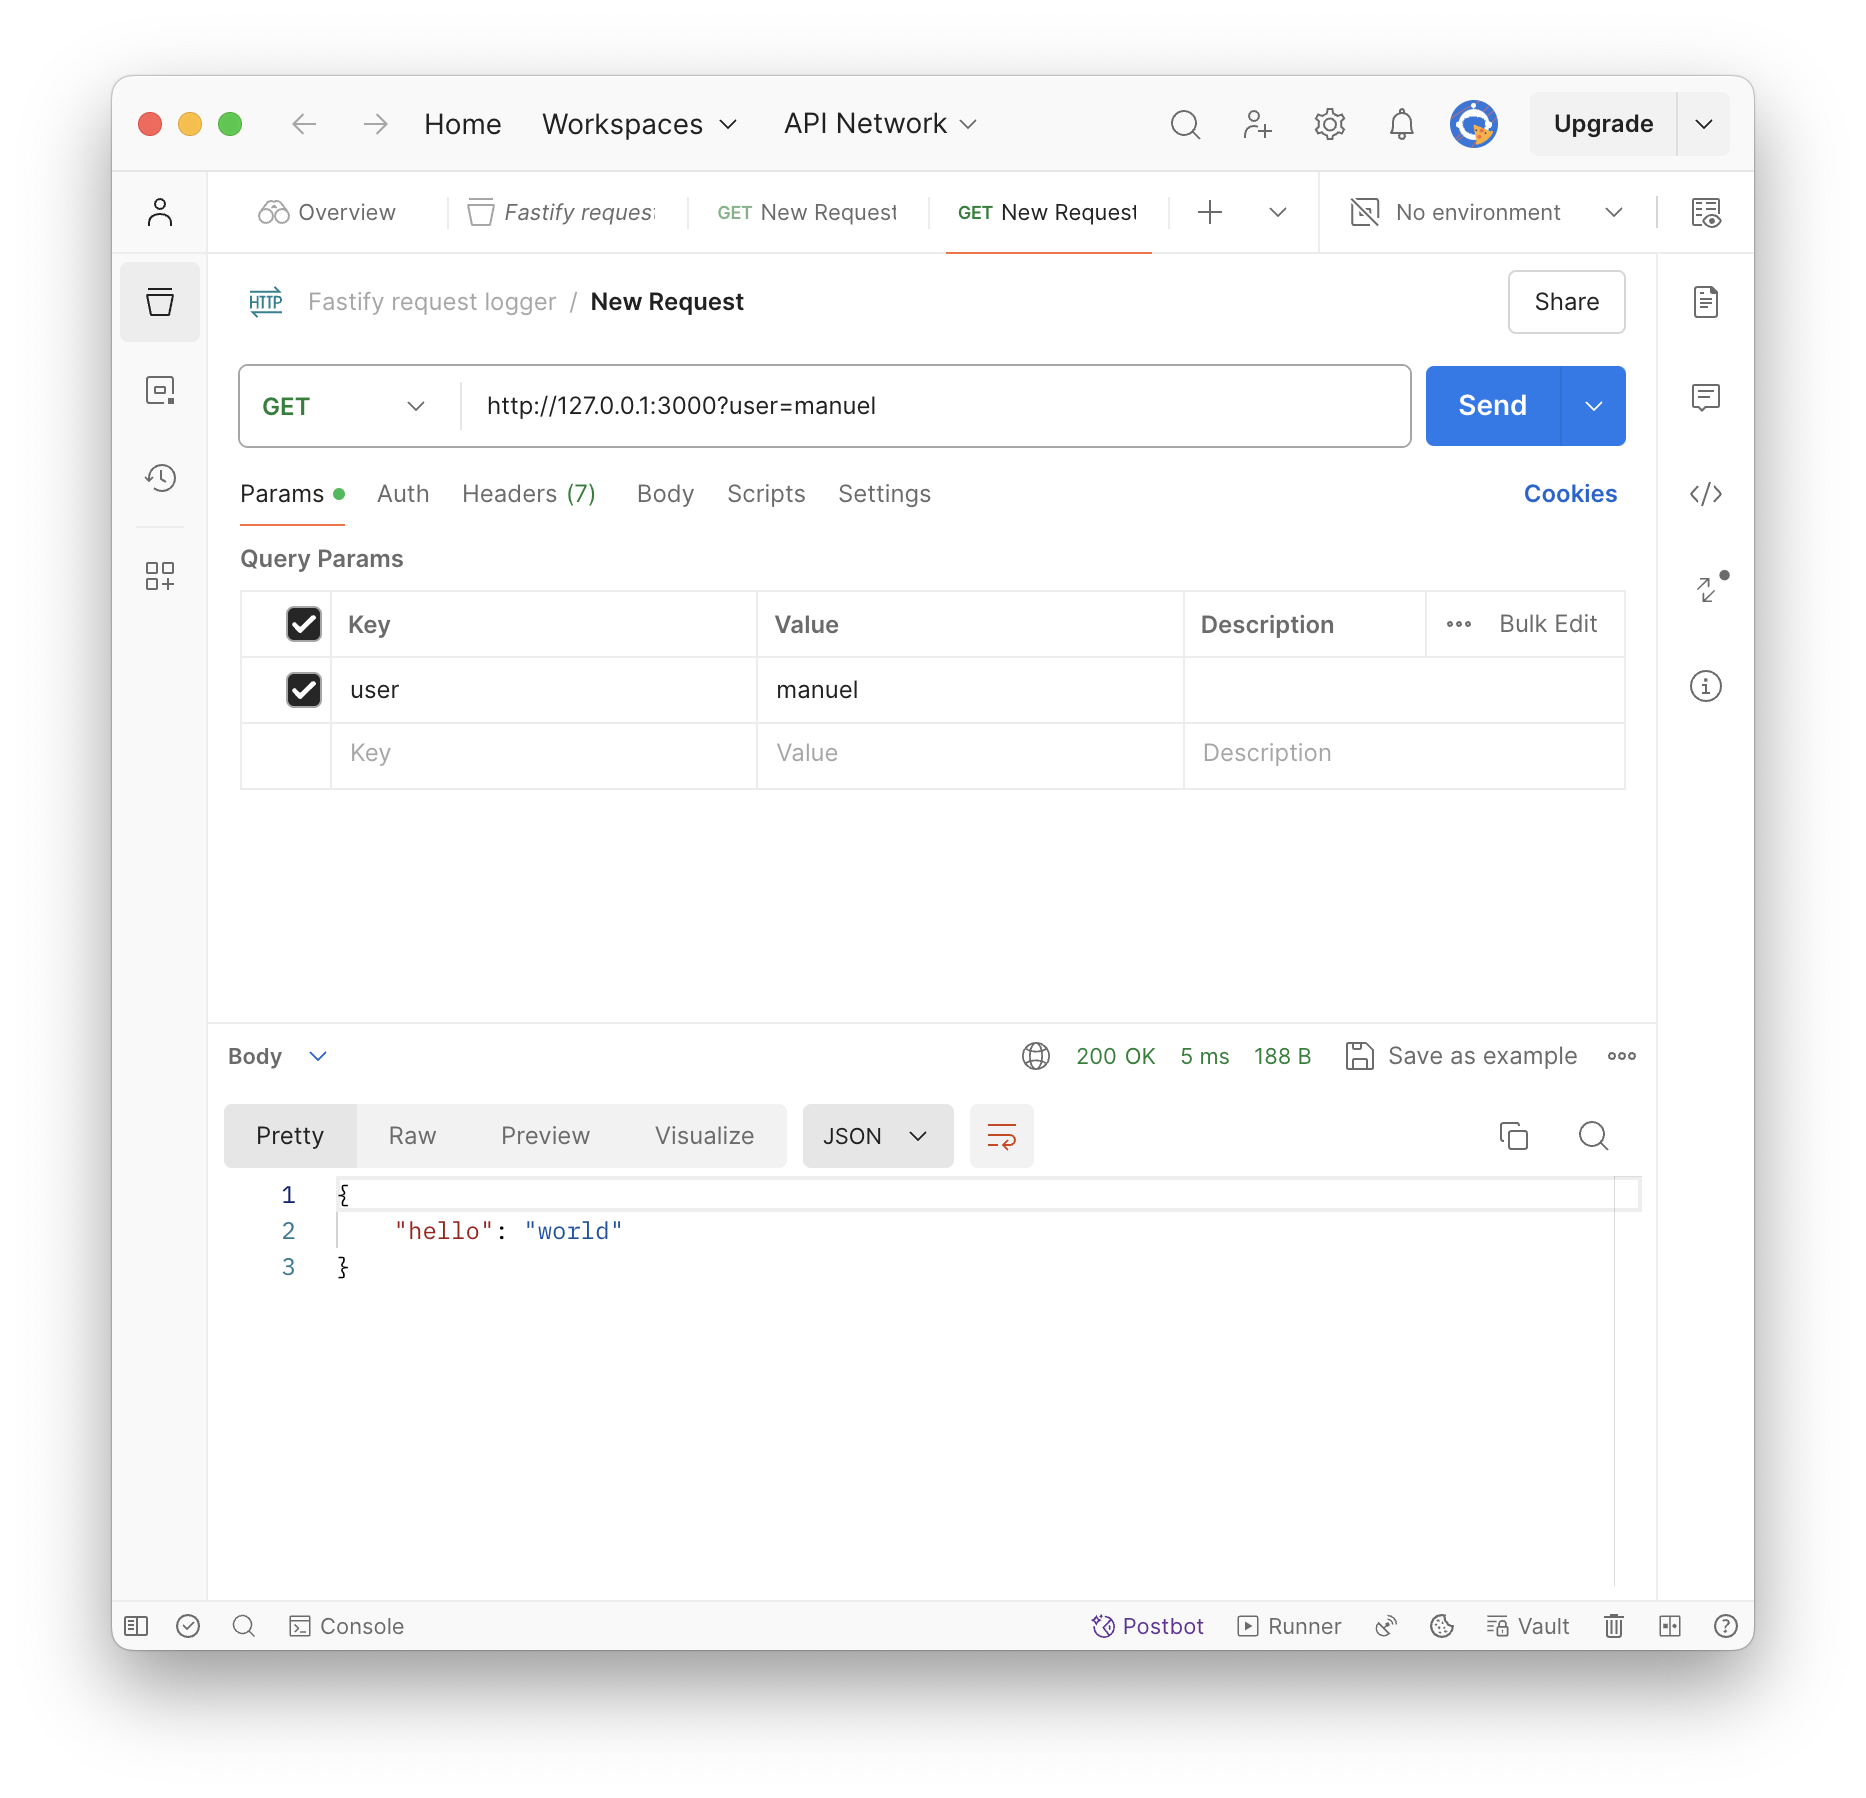
For example, we want to add the "user" field to the request logger, which is passed to us as a parameter in the URL by the person making the HTTP call.
To do this you need to call the Fastify method setChildLoggerFactory:
const Fastify = require('fastify')

const fastify = Fastify({
  logger: true,
})

// adds fields to the Request Logger
fastify.setChildLoggerFactory((logger, bindings, opts, rawReq) => {

  // retrieve user from URL
  const urlString = rawReq.url || ''
  const queryString = urlString.split('?')[1]
  const searchParams = new URLSearchParams(queryString)
  const user = searchParams.get('user')

  // adds user to bindings
  bindings.user = user

  return logger.child(bindings, opts)
})

// declare the route
fastify.get('/', async function handler (request, reply) {
  request.log.info('Request logger!')
  return { hello: 'world' }
})

// start the server
fastify.listen({ port: 3000 }, (err) => {
  if (err) {
    fastify.log.error(err)
    process.exit(1)
  }
})
Now let's make an HTTP call with the user query URL parameter:

We will see logs like this:
{
   "level":30,
   "time":1722583839646,
   "pid":95780,
   "hostname":"Manuels-MacBook-Pro.local",
   "reqId":"req-2",
   "user":"manuel", // new field: user
   "req":{
      "method":"GET",
      "url":"/?user=manuel",
      "hostname":"127.0.0.1:3000",
      "remoteAddress":"127.0.0.1",
      "remotePort":52098
   },
   "msg":"incoming request"
}{
   "level":30,
   "time":1722583839646,
   "pid":95780,
   "hostname":"Manuels-MacBook-Pro.local",
   "reqId":"req-2",
   "user":"manuel", // new field: user
   "msg":"Request logger!"
}{
   "level":30,
   "time":1722583839648,
   "pid":95780,
   "hostname":"Manuels-MacBook-Pro.local",
   "reqId":"req-2",
   "user":"manuel", // new field: user
   "res":{
      "statusCode":200
   },
   "responseTime":1.4203753471374512,
   "msg":"request completed"
}
Now the Request Logger will have the new field "user" in addition to the "reqId".
Manuel Salinardi
Subscribe to my newsletter
Read articles from Manuel Salinardi directly inside your inbox. Subscribe to the newsletter, and don't miss out.
Written by
