Data Analytics for Small Businesses: Tools and Strategies
 Shrey Dikshant
Introduction
In today's digital age, data isn't just for the tech giants. Small businesses, too, can harness the power of data analytics to drive growth, improve operations, and make smarter decisions. You don't need a team of data scientists or a huge budget to start reaping the benefits of data analytics. With the right tools and strategies, even the smallest businesses can turn data into actionable insights. Let's dive into how you can get started!
Why Data Analytics Matters for Small Businesses

Informed Decision-Making: Data analytics helps you make decisions based on facts rather than intuition. Whether it's choosing the right product to stock or understanding customer behavior, data provides the evidence you need.
Improved Efficiency: By analyzing operational data, you can identify bottlenecks, streamline processes, and reduce waste. This leads to cost savings and better resource management.
Better Customer Understanding: Knowing your customers' preferences, buying habits, and feedback can help you tailor your offerings and improve customer satisfaction.
Competitive Advantage: Using data analytics can give you an edge over competitors who rely on guesswork. You'll be able to spot trends and opportunities before they do.
Essential Tools for Small Businesses
Google Analytics
Purpose: Website traffic analysis
Features: Tracks website visitors, their behavior, and conversion rates.
Why Use It: It's free and provides valuable insights into how people find and use your website.
![The Ultimate Beginner's Guide to Google Analytics [2024]](https://entail-assets.com/mayple/631ee15f68f33521ce232688_googleanalyticsbeginnersguide_c9306a507f58bf4369b914de1bd4d429_2000-1699775565283.jpg)
Excel and Google Sheets
Purpose: Data organization and basic analysis
Features: Spreadsheets for storing data, performing calculations, and creating charts.
Why Use It: Easy to use and highly accessible for small business owners.
![Google Sheets vs. Excel: Which is right for you? [2024] | Zapier](https://images.ctfassets.net/lzny33ho1g45/1axzhgm4thtZi42OxsNeZk/8414378ccb84bbb5586dc9f56315731c/Google_Sheets_vs_Excel_hero.jpg?w=1520&fm=jpg&q=30&fit=thumb&h=760)
Tableau
Purpose: Data visualization
Features: Converts data into interactive, shareable dashboards.
Why Use It: Helps you visualize complex data in an understandable format, making it easier to identify trends and patterns.

QuickBooks
Purpose: Financial analysis
Features: Manages finances, tracks expenses, and generates financial reports.
Why Use It: Simplifies financial management and provides insights into your business’s financial health.

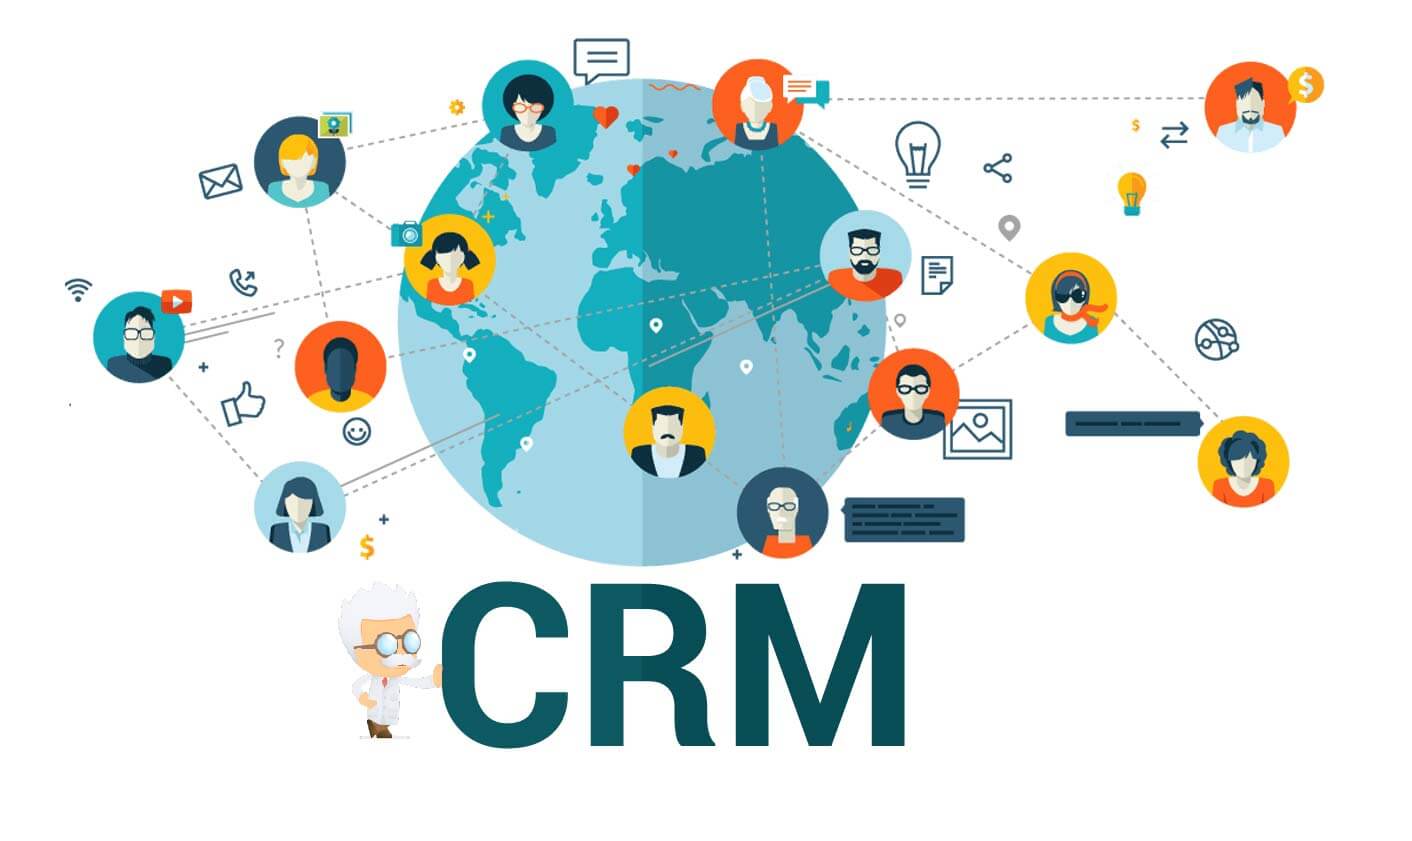
Customer Relationship Management (CRM) Systems
Examples: HubSpot, Zoho CRM
Purpose: Customer data management
Features: Tracks customer interactions, sales, and service requests.
Why Use It: Helps you manage and analyze customer data to improve relationships and sales strategies.

Effective Strategies for Data Analytics
Start Small
- Begin with a specific problem or question. For example, "Why are sales declining in the summer months?" This focused approach makes data analysis more manageable and actionable.
Collect Relevant Data
- Ensure you're collecting data that's relevant to your business objectives. This might include sales data, customer feedback, website traffic, or social media engagement.
Use Dashboards
- Create dashboards that provide a snapshot of your key metrics. Tools like Tableau and Google Data Studio can help you build visual dashboards that are easy to interpret.
Regularly Review and Act
- Make data review a regular part of your routine. Weekly or monthly reviews can help you stay on top of trends and respond promptly. More importantly, use the insights to make informed decisions and implement changes.
Train Your Team
- Ensure your team understands the importance of data and how to use the tools at their disposal. Even basic training in Excel or Google Analytics can go a long way.
Real-Life Examples
Coffee Shop: By analyzing sales data, a small coffee shop discovered that their seasonal pumpkin spice latte was a huge hit. They decided to extend the offering beyond the usual season and introduced other seasonal flavors based on customer feedback.

E-commerce Store: An online store used Google Analytics to track customer journeys. They noticed a high drop-off rate on the checkout page. By simplifying the checkout process, they reduced cart abandonment and increased sales.

Local Gym: A local gym tracked member attendance and class popularity. They adjusted their class schedule to offer more of the popular sessions and phased out less popular ones, improving member satisfaction and retention.

Subscribe to my newsletter
Read articles from Shrey Dikshant directly inside your inbox. Subscribe to the newsletter, and don't miss out.
Written by

Shrey Dikshant
Shrey Dikshant
Aspiring data scientist with a strong foundation in adaptive quality techniques. Gained valuable experience through internships at YT Views, focusing on operation handling. Proficient in Python and passionate about data visualization, aiming to turn complex data into actionable insights.