Azure Monitor Private Link (AMPL): Enabling Private Monitoring for Kubernetes Clusters
 Mo Abdullah
Introduction
In today's cloud-native environments, security is paramount. Monitoring solutions like Managed Prometheus, Log Analytics, and Managed Grafana are essential for gaining insights into Kubernetes clusters. However, these solutions are publicly accessible by default, which can be a security concern. To adhere to the Zero Trust model, making these services private is crucial. Azure Monitor Private Link Scope (AMPLS) is key to achieving this. This article will explore the workflow, components, and configuration needed to secure your monitoring stack using AMPLS.
AMPLS for Private Monitoring
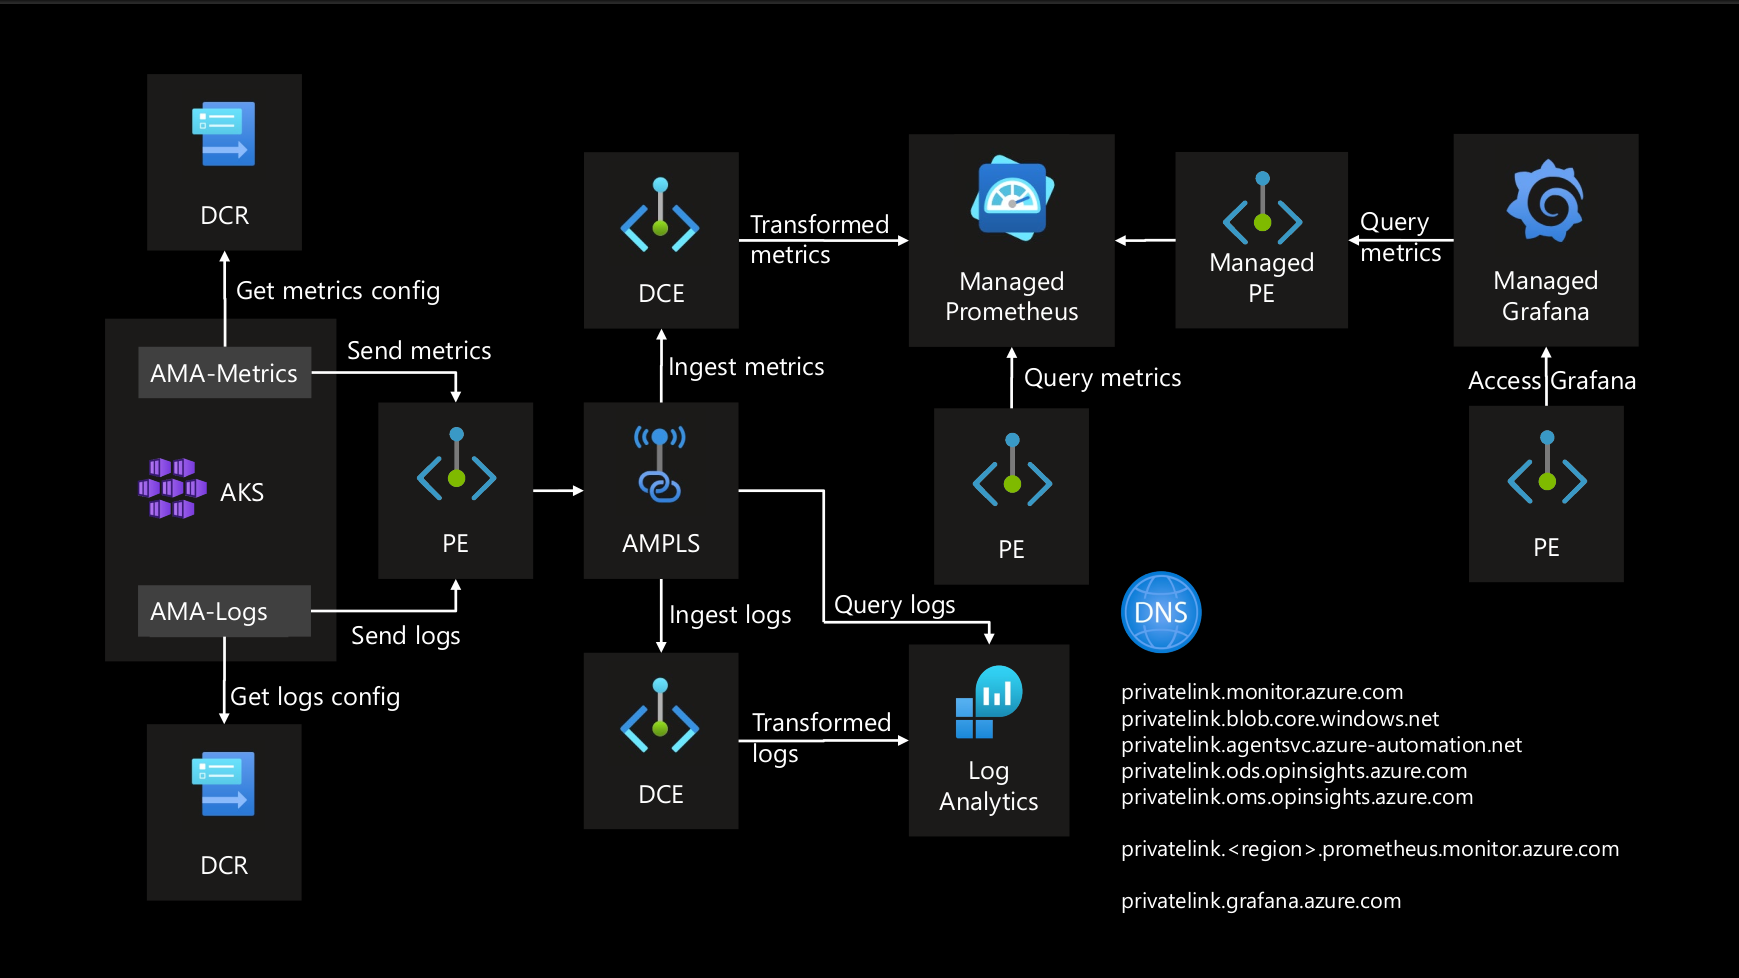
To implement a private monitoring setup, we use AMPLS, which allows secure, private access to monitoring solutions. The main components in this architecture are:
Azure Monitoring Agent (AMA): Collects metrics and logs from the AKS cluster.
Data Collection Endpoint (DCE): Receives and processes data from AMA.
Data Collection Rule (DCR): Applies data transformation rules to include or exclude specific namespaces.
All communication between these components and the monitoring solutions occurs over the Azure Backbone Network, ensuring secure data transfer.
Workflow
Here’s how AMPLS integrates with various monitoring solutions:
Data Collection Configuration:
AMA collects metrics and logs from the AKS cluster.
DCR applies necessary transformations to the collected data.
Data Ingestion:
AMA sends metrics and logs to the DCE's Private Endpoint (PE).
DCE ingests the data and transforms it according to DCR configurations.
Metrics and Logs Processing:
Transformed metrics are sent to Managed Prometheus.
Transformed logs are sent to Log Analytics.
Private Access Configuration:
Managed Prometheus and Log Analytics are configured with private endpoints within their respective VNets.
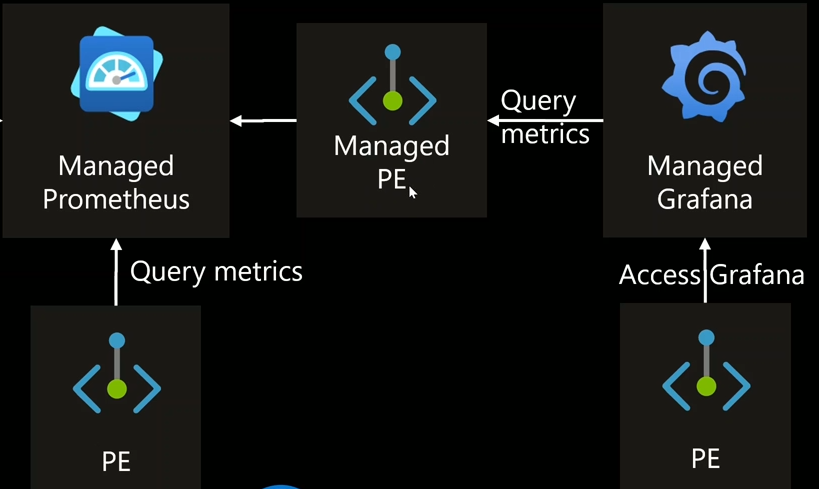
Managed Grafana, which resides outside the VNet, requires a Managed Private Endpoint to connect to Managed Prometheus.
DNS Configuration:
- A Private DNS Zone is created to manage domain names for the private endpoints within the VNet.
Demo
To demonstrate the functionality of AMPLS and the private monitoring setup, we will deploy a VM in the same VNet as AMPLS, DCEs, Managed Prometheus, and Log Analytics. We will verify the accessibility of the monitoring solutions both publicly and privately.
Steps
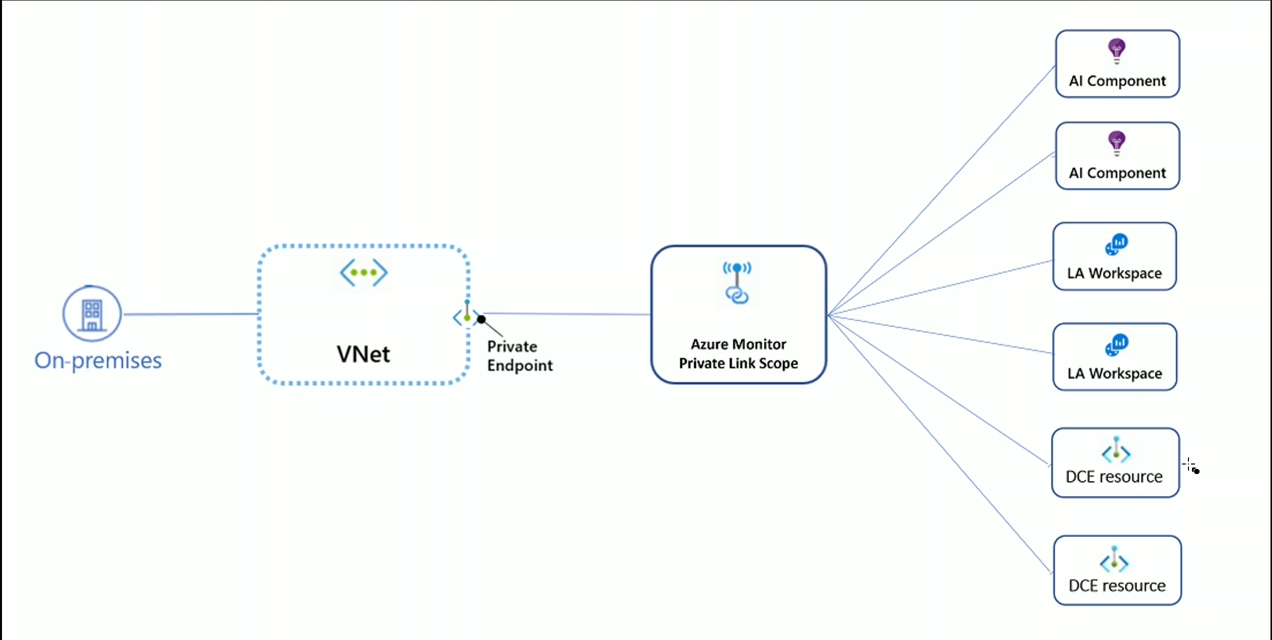
Set up AMPLS, DCEs, Managed Prometheus, Log Analytics, and Managed Grafana.
Configure private endpoints and DNS zones.
The following figure depicts the setup:
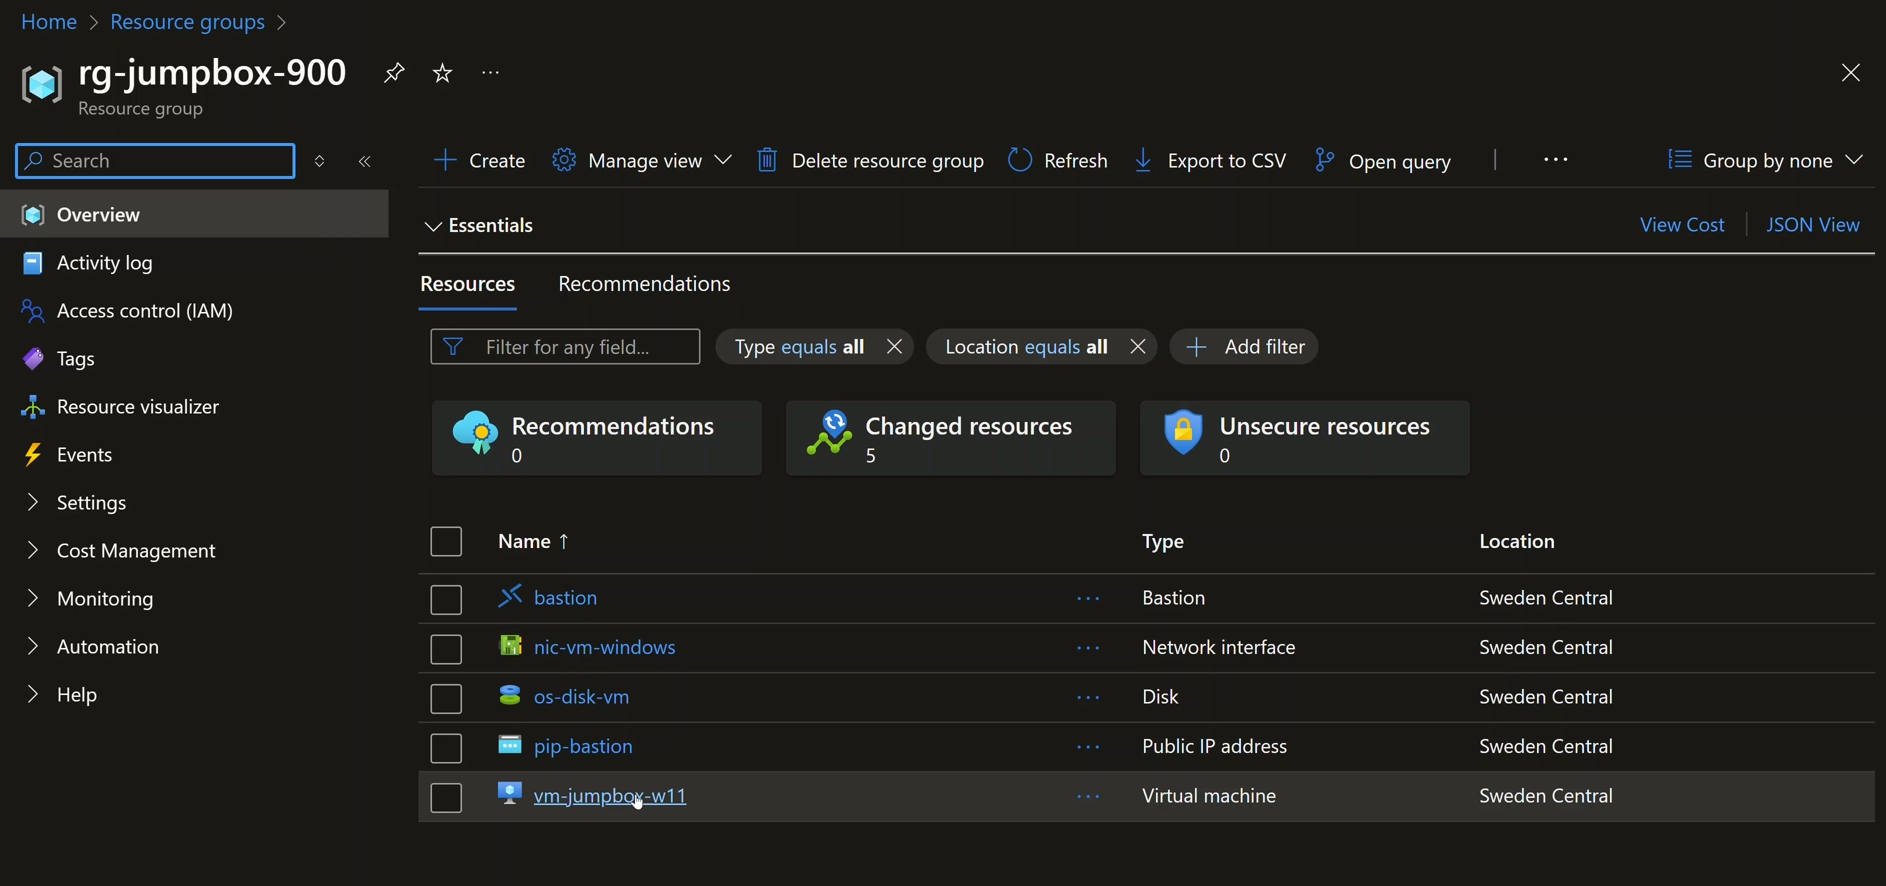
- Provision a resource group having a VM in the same VNet as our AMPLS setup.
Depicts a resource group with a VM provisioned in the same VNet as AMPLS, DCEs, Managed Prometheus, and Log Analytics:
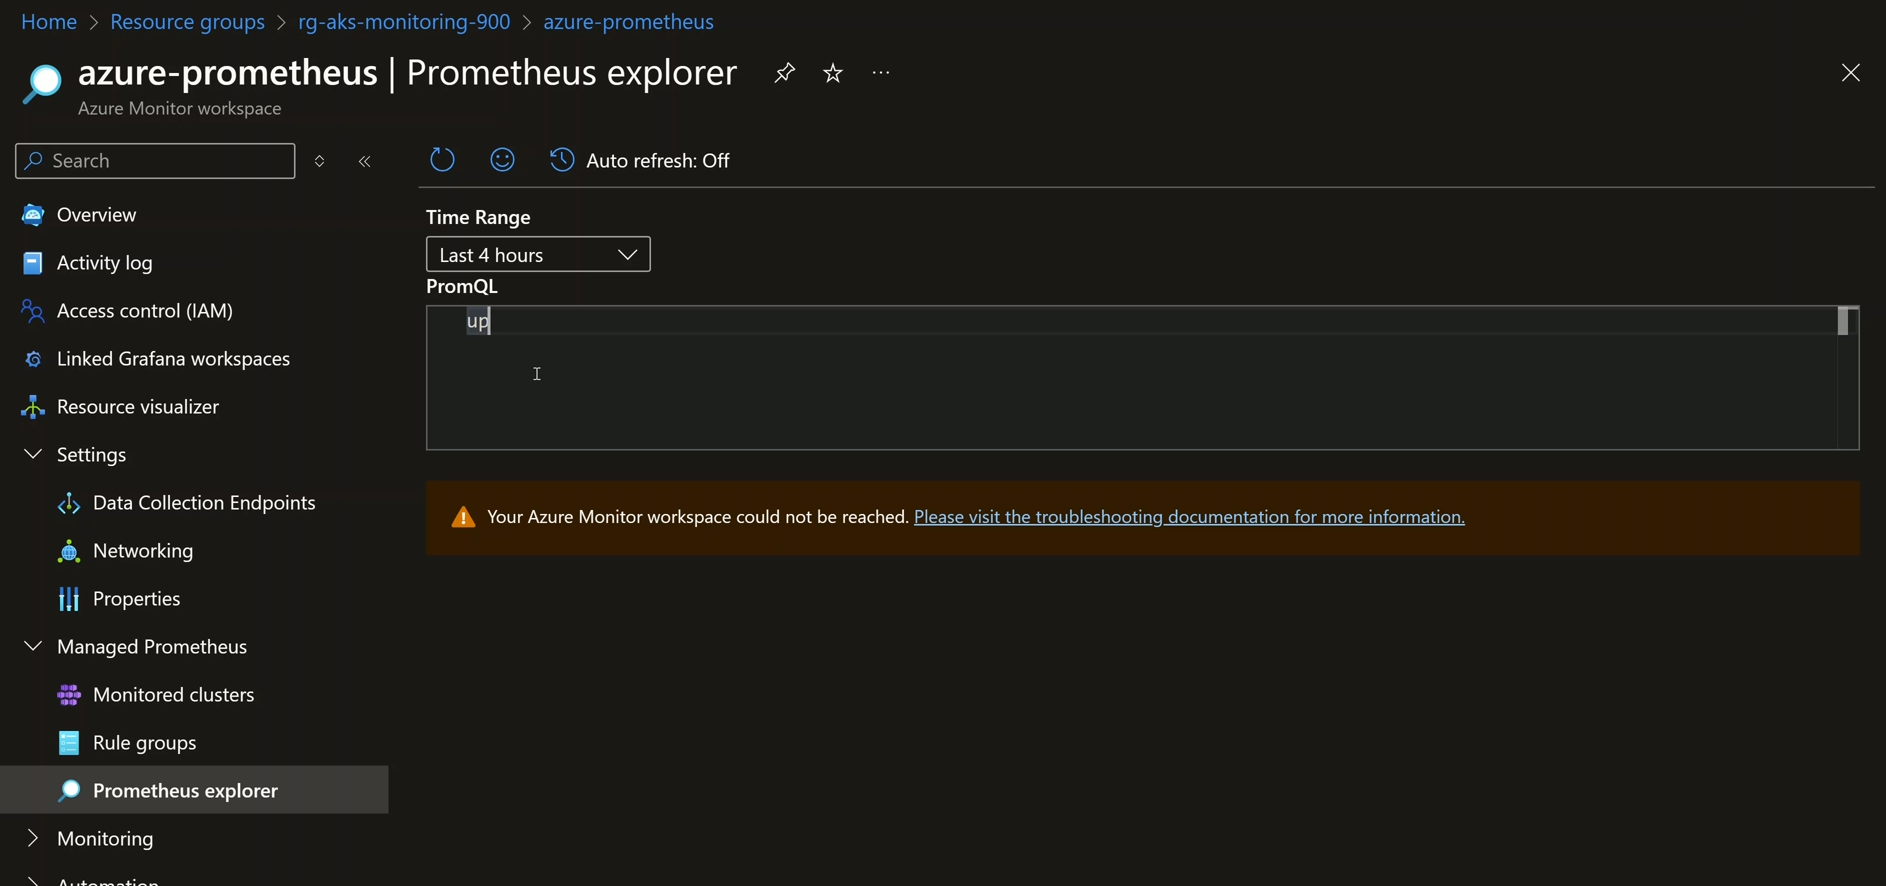
- Attempt to access Managed Prometheus from a public network.
Shows Managed Prometheus not being accessible publicly:
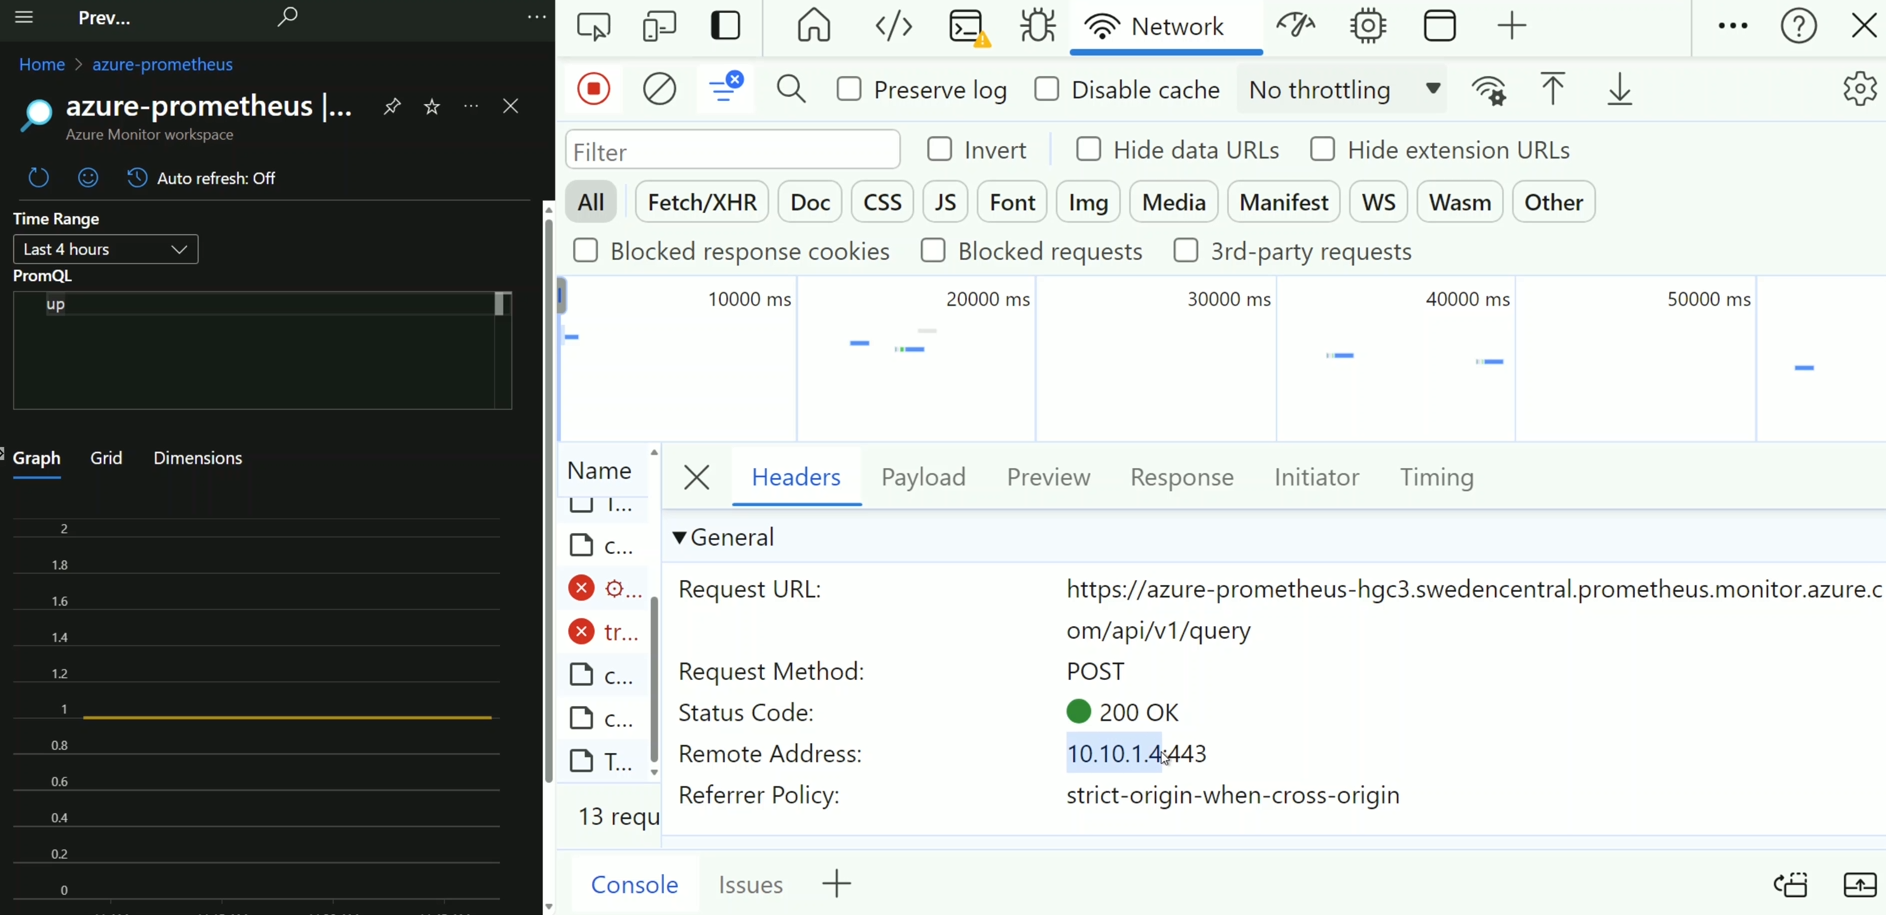
- Access Managed Prometheus from the VM within the VNet and verify private endpoint connectivity.
Illustrates Managed Prometheus being accessible privately through the VM resolving the endpoint of Prometheus to the private IP address of its private endpoint NIC:
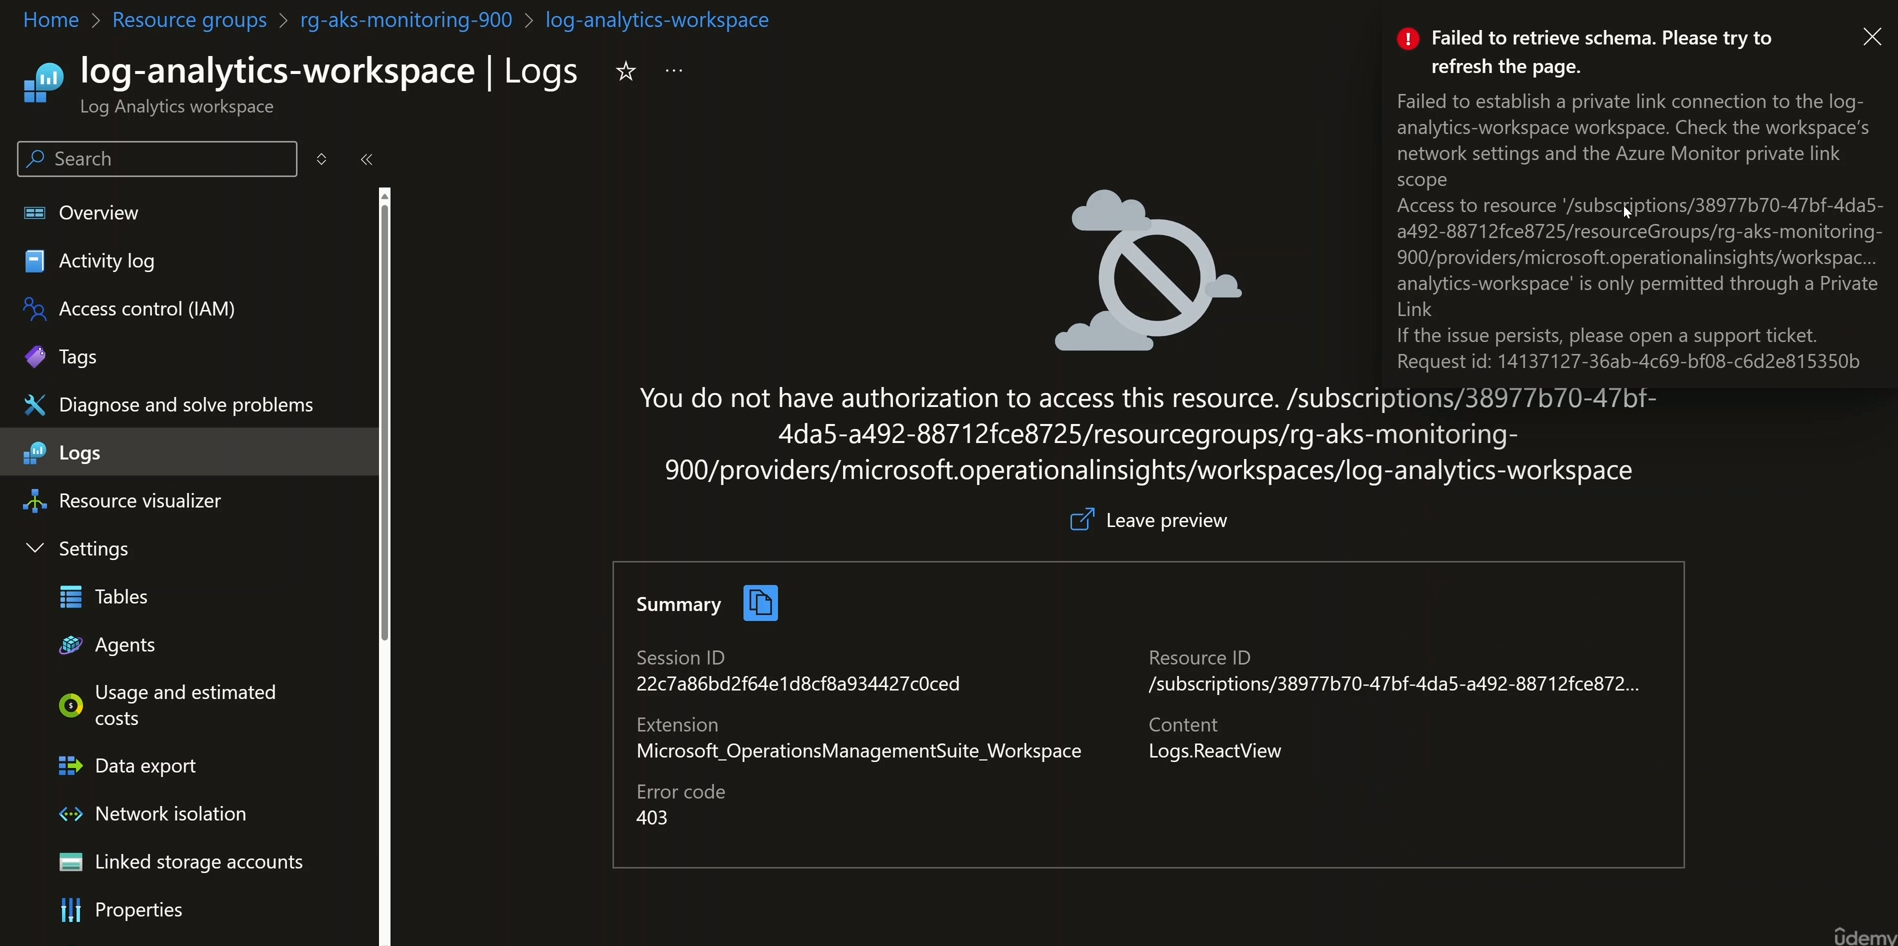
- Attempt to access Log Analytics from a public network.
Shows Log Analytics not being accessible publicly:
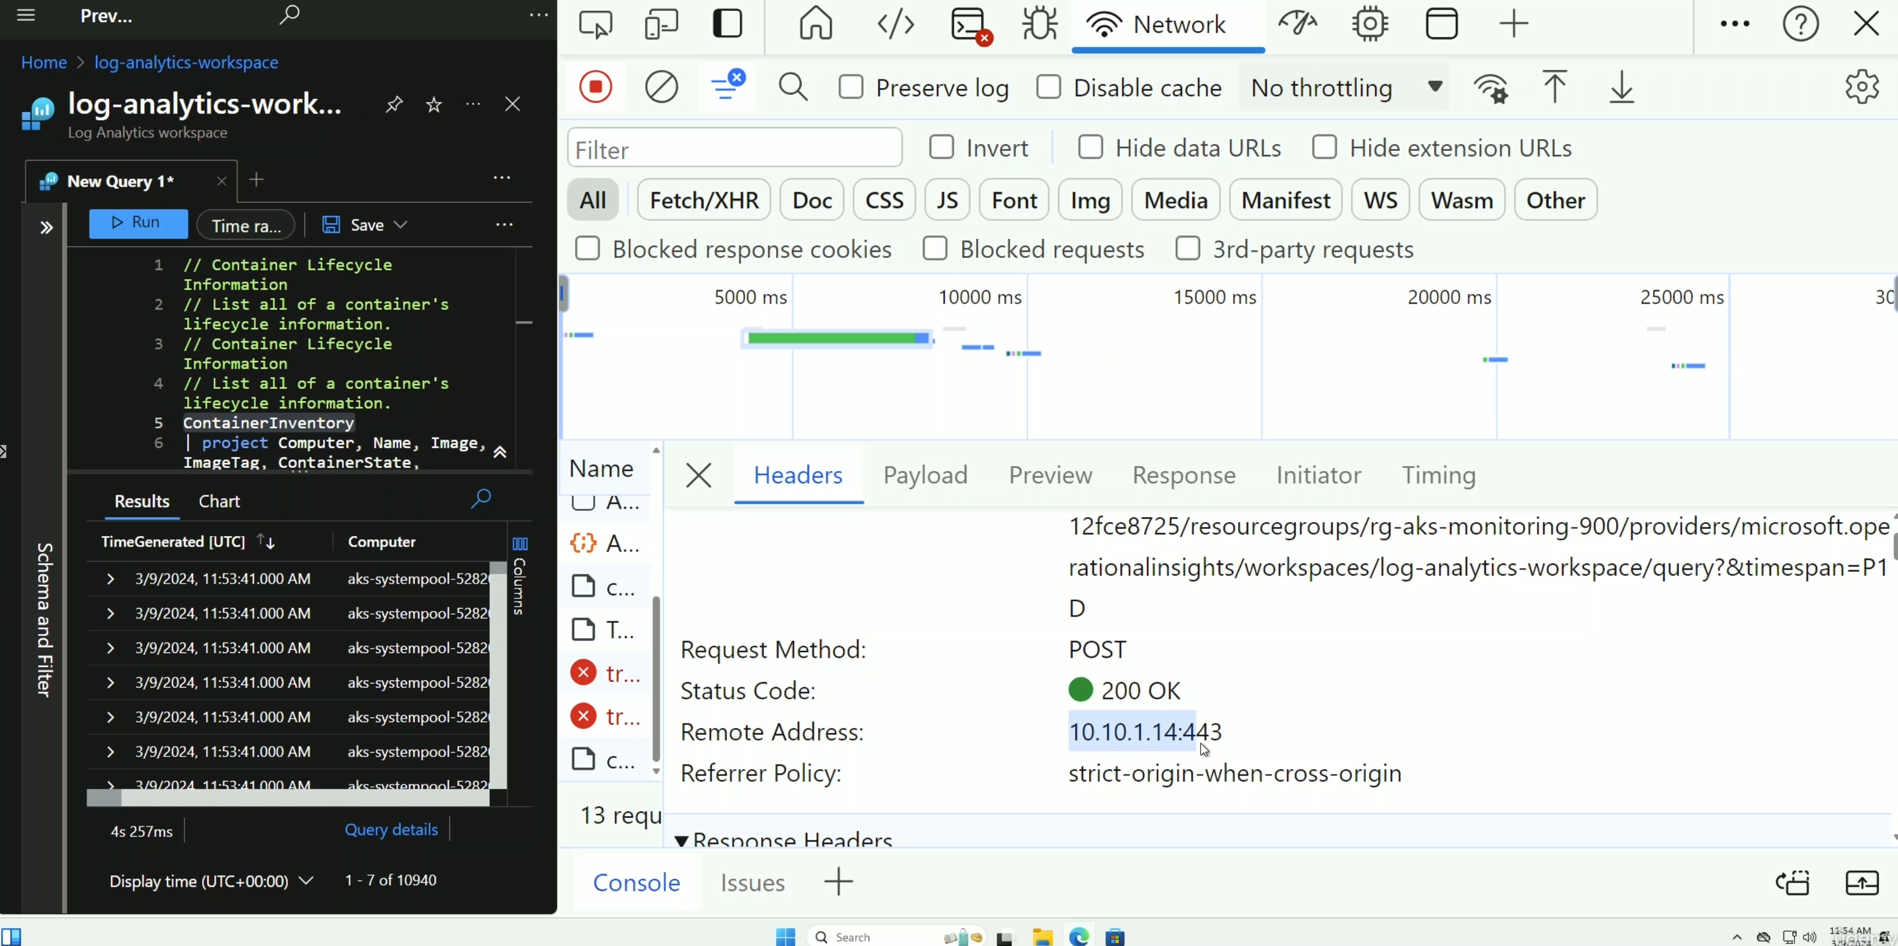
- Access Log Analytics from the VM within the VNet and verify private endpoint connectivity.
Illustrates Log Analytics being accessible privately through the VM resolving the endpoint of Log Analytics to the private IP address of its private endpoint NIC:
- Configure a Managed Private Endpoint for Managed Prometheus to allow Managed Grafana to connect.
Shows the Managed Private Endpoint for Prometheus to allow Grafana to connect to it:
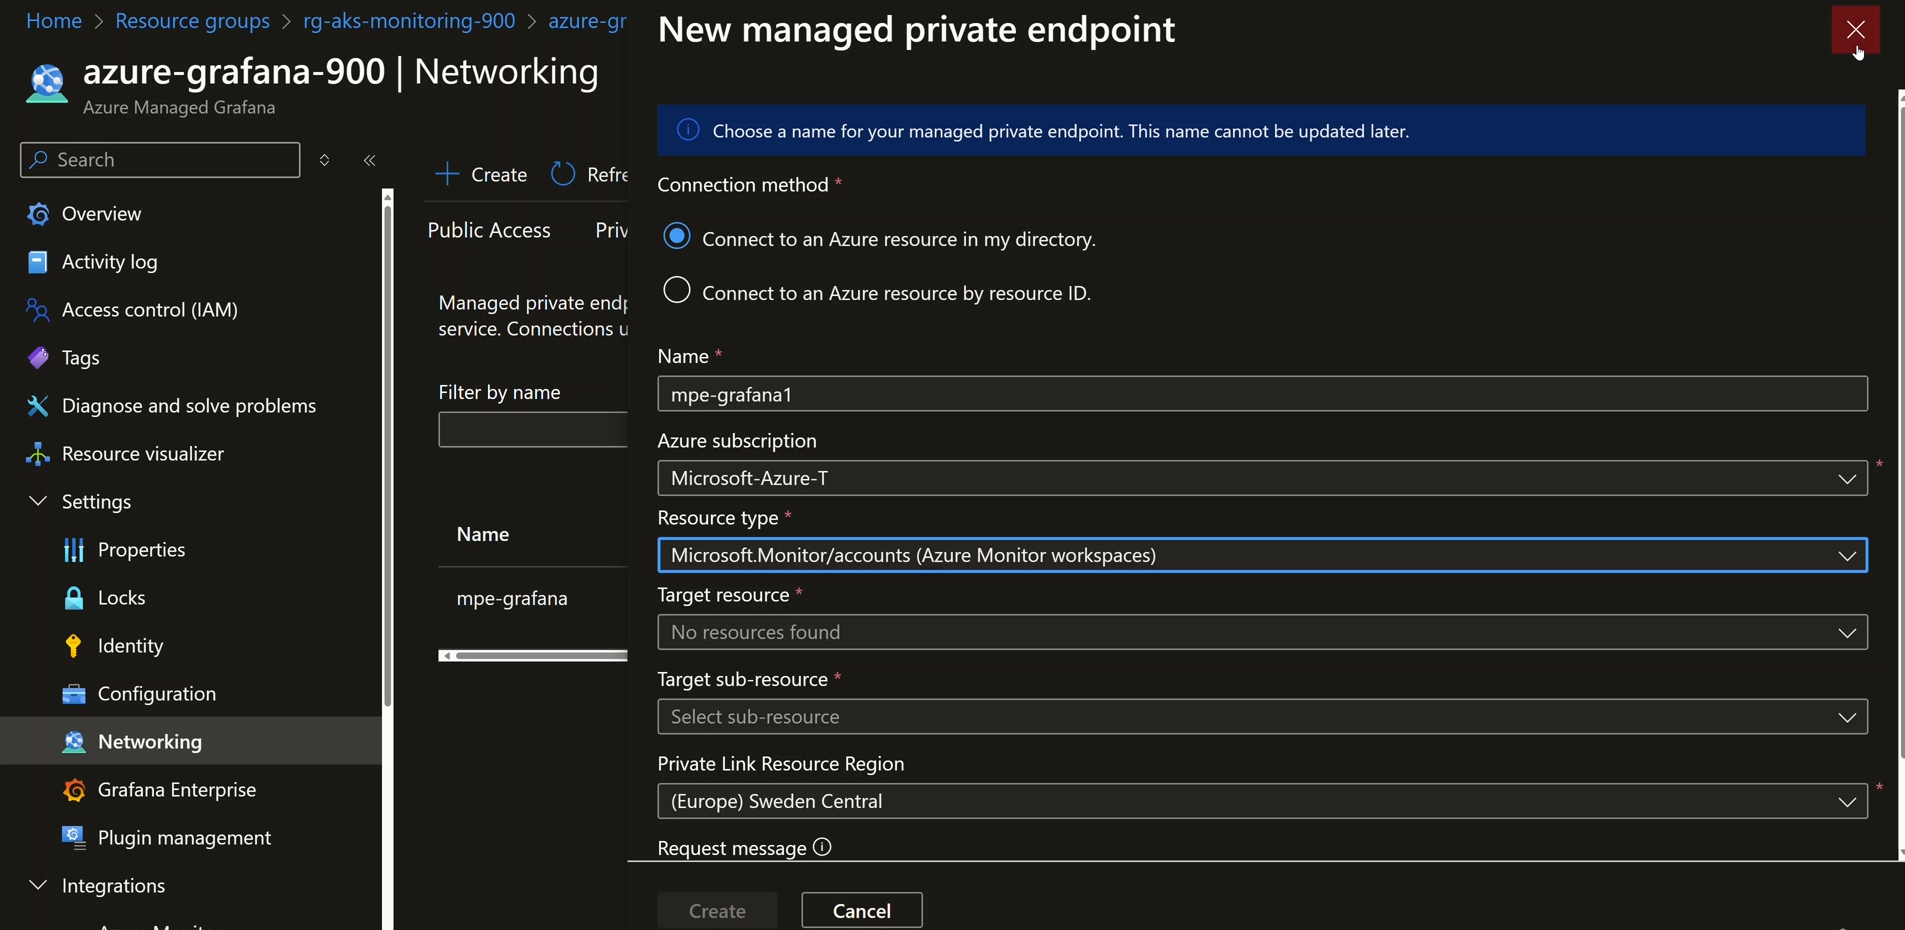
- Add the new Managed Private Endpoint in the Networking tab of Grafana.
Depicts the new Managed Private Endpoint inside the Networking tab of Grafana:
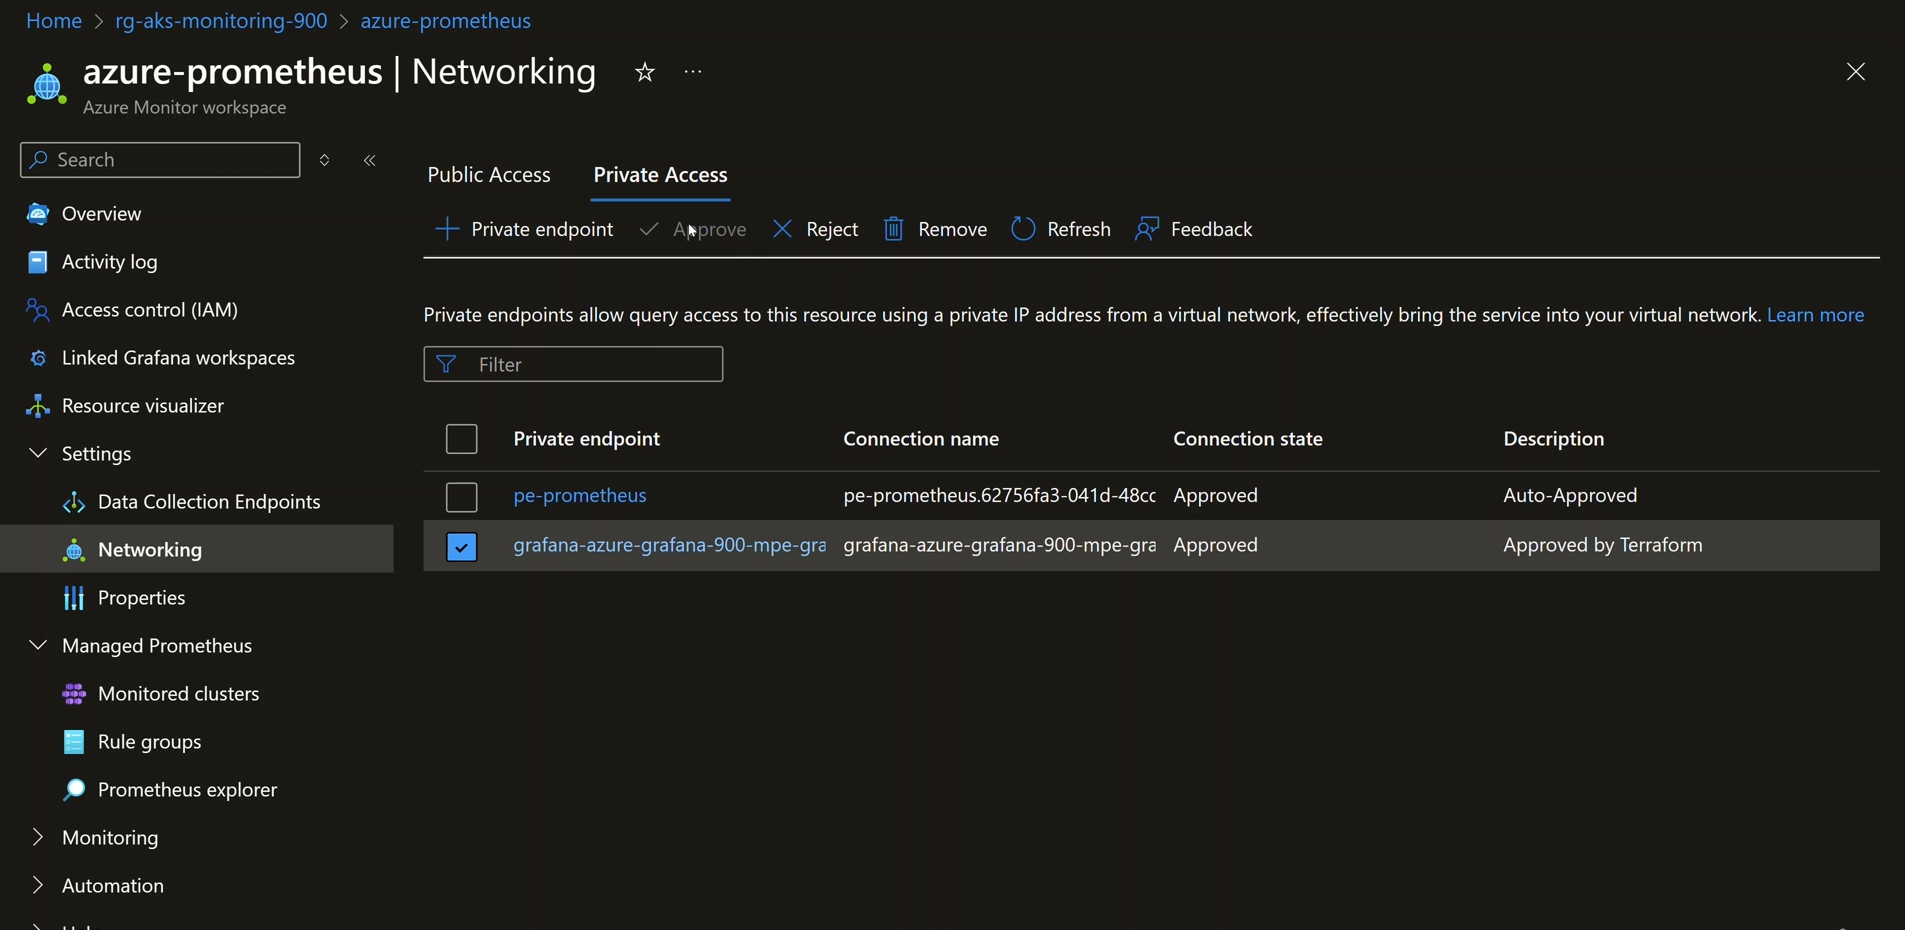
- Create a Private Access Approval in the Prometheus Networking tab to allow Grafana to connect via the newly created Managed Private Endpoint.
Shows the Private Access Approval created in the Prometheus Networking tab to allow Grafana to connect over the newly created Managed Private Endpoint:
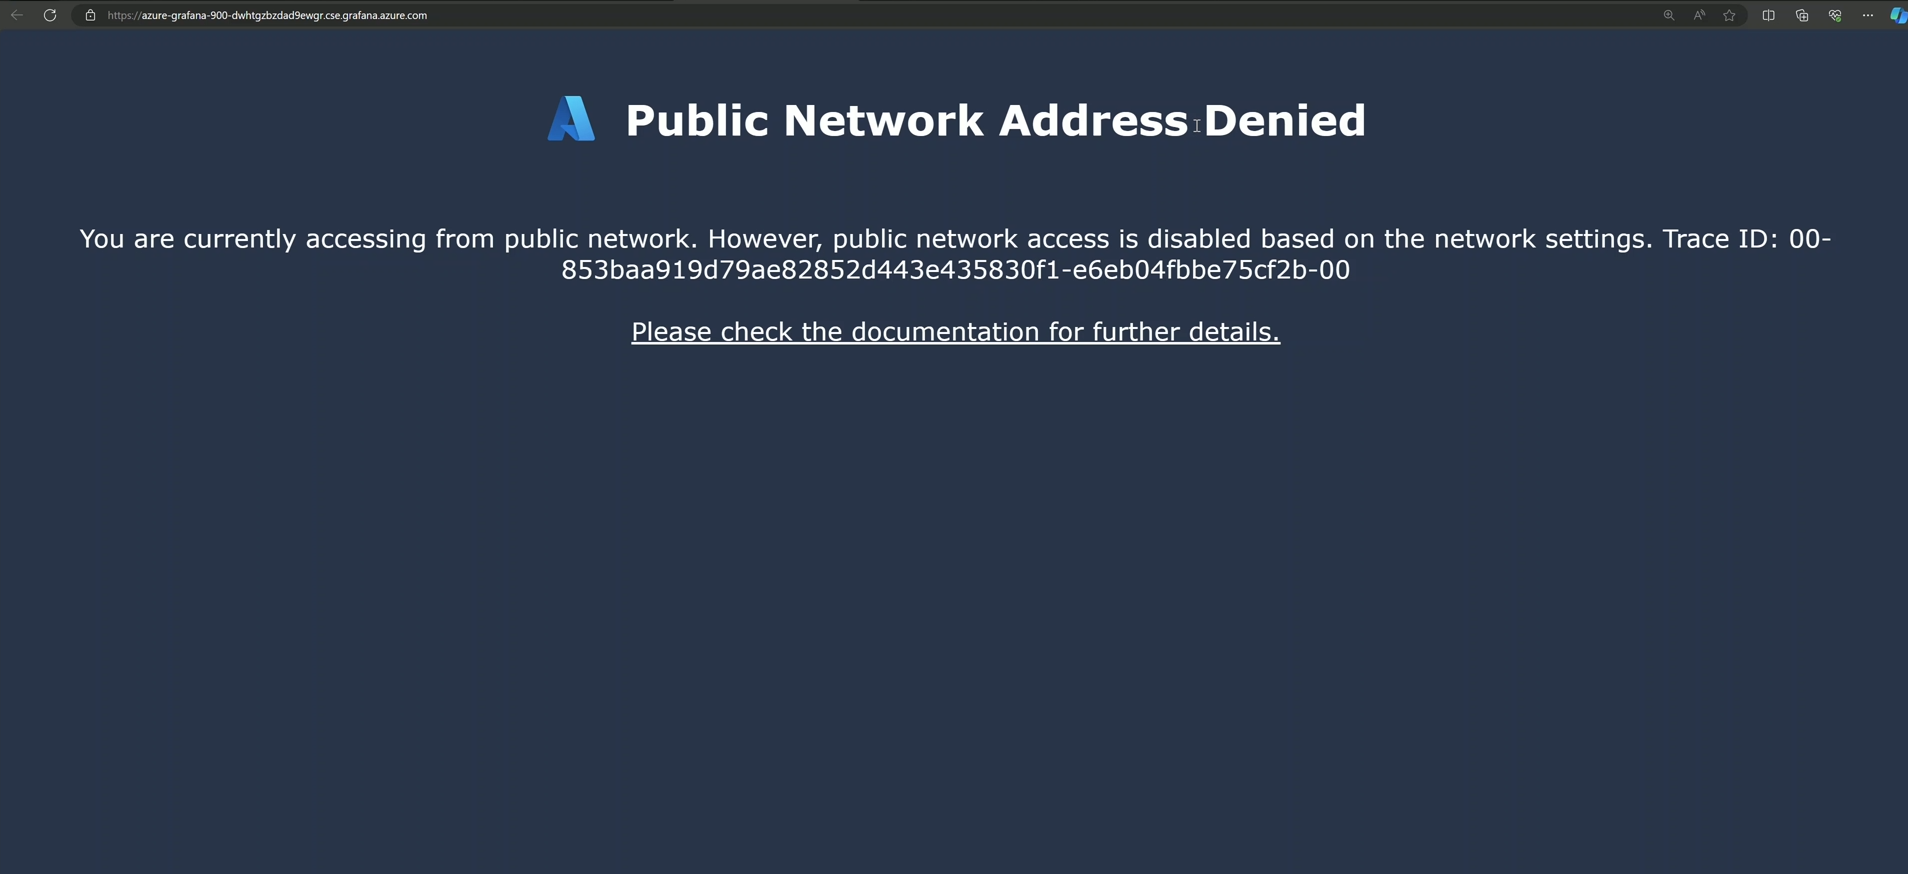
- Ensure Managed Grafana is not accessible from a public network.
Shows Managed Grafana not being accessible publicly:
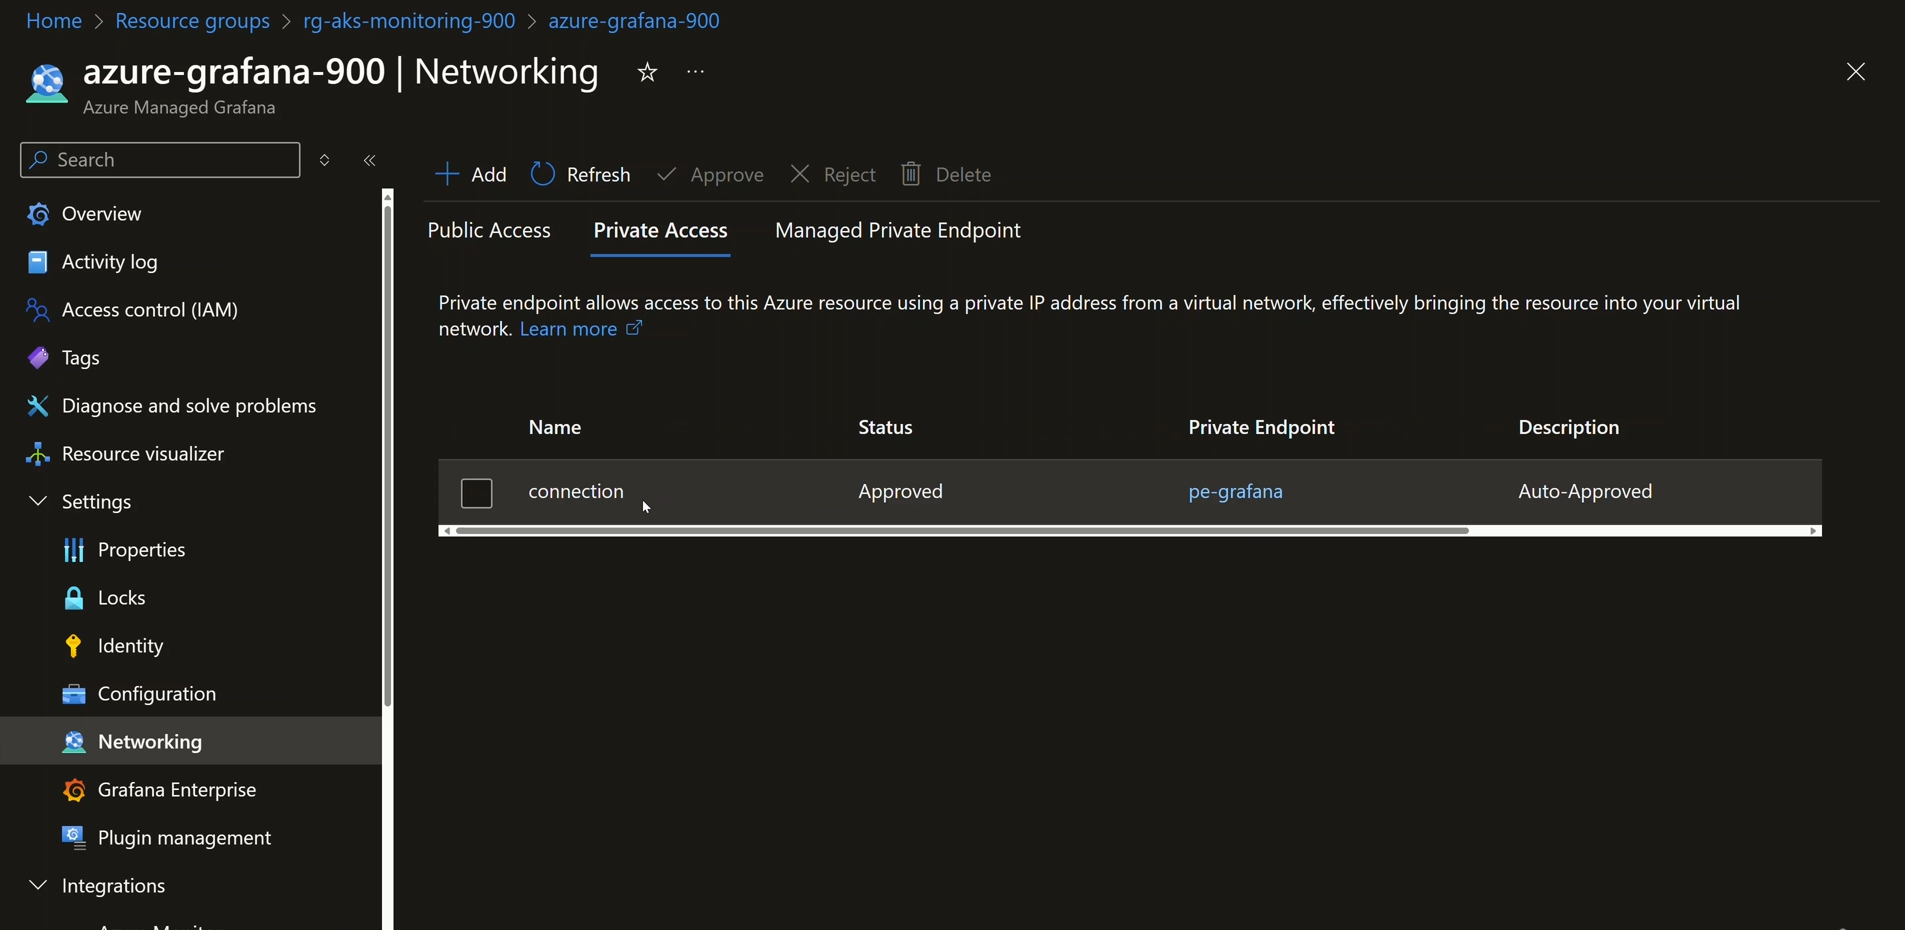
- Grant Private Access approval to Grafana's private endpoint in the Networking tab of Grafana.
Depicts the Networking tab of Grafana, giving Private Access approval to Grafana's private endpoint:
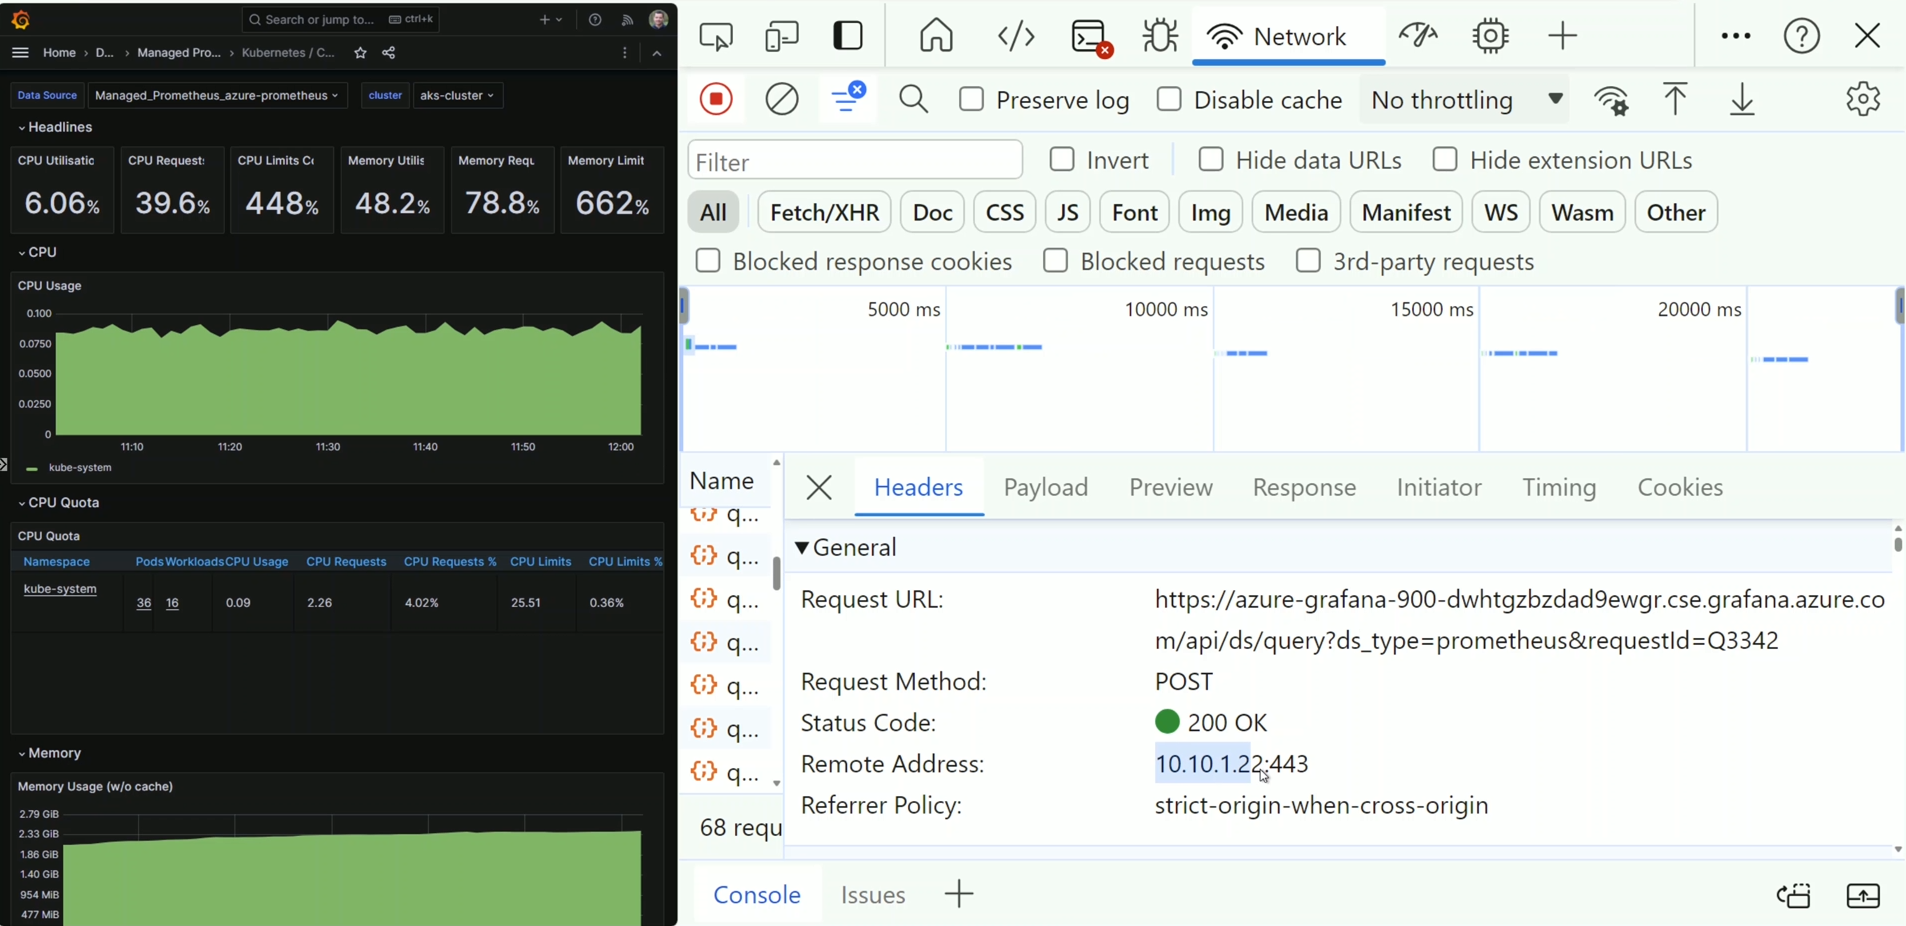
- Access Managed Prometheus from Managed Grafana, ensuring connectivity via the private endpoint.
Illustrates Managed Prometheus being accessible privately through the VM resolving the endpoint of Prometheus to the private IP address of its private endpoint NIC:
Conclusion
Implementing Azure Monitor Private Link Scope (AMPLS) for private monitoring ensures that critical monitoring solutions are securely accessible within a private network. By following the outlined steps, organizations can enhance their security posture and comply with the Zero Trust model. This setup not only safeguards data but also provides robust monitoring capabilities for Kubernetes clusters.
Subscribe to my newsletter
Read articles from Mo Abdullah directly inside your inbox. Subscribe to the newsletter, and don't miss out.
Written by
