Quick Test : Daft With Ray In Fabric
 Sandeep Pawar
Daft is a distributed query engine which is gaining a lot of traction. You can use a Ray cluster to run daft on multiple workers similar to spark. I have no experience with Ray, so this is an attempt to see how it works. Based on my limited understanding, I don't think you can provision a multiple node Ray cluster in Fabric so in my test I am just using a single node with all available CPUs. I used Fabric runtime 1.2 with the default medium size pool.
The dataset is Common Government dataset from Tableau's BI Benchmark which aims to mimic real world data. This dataset as 54 columns and 160M rows. I saved this as a delta table in a lakehouse.

Setup :
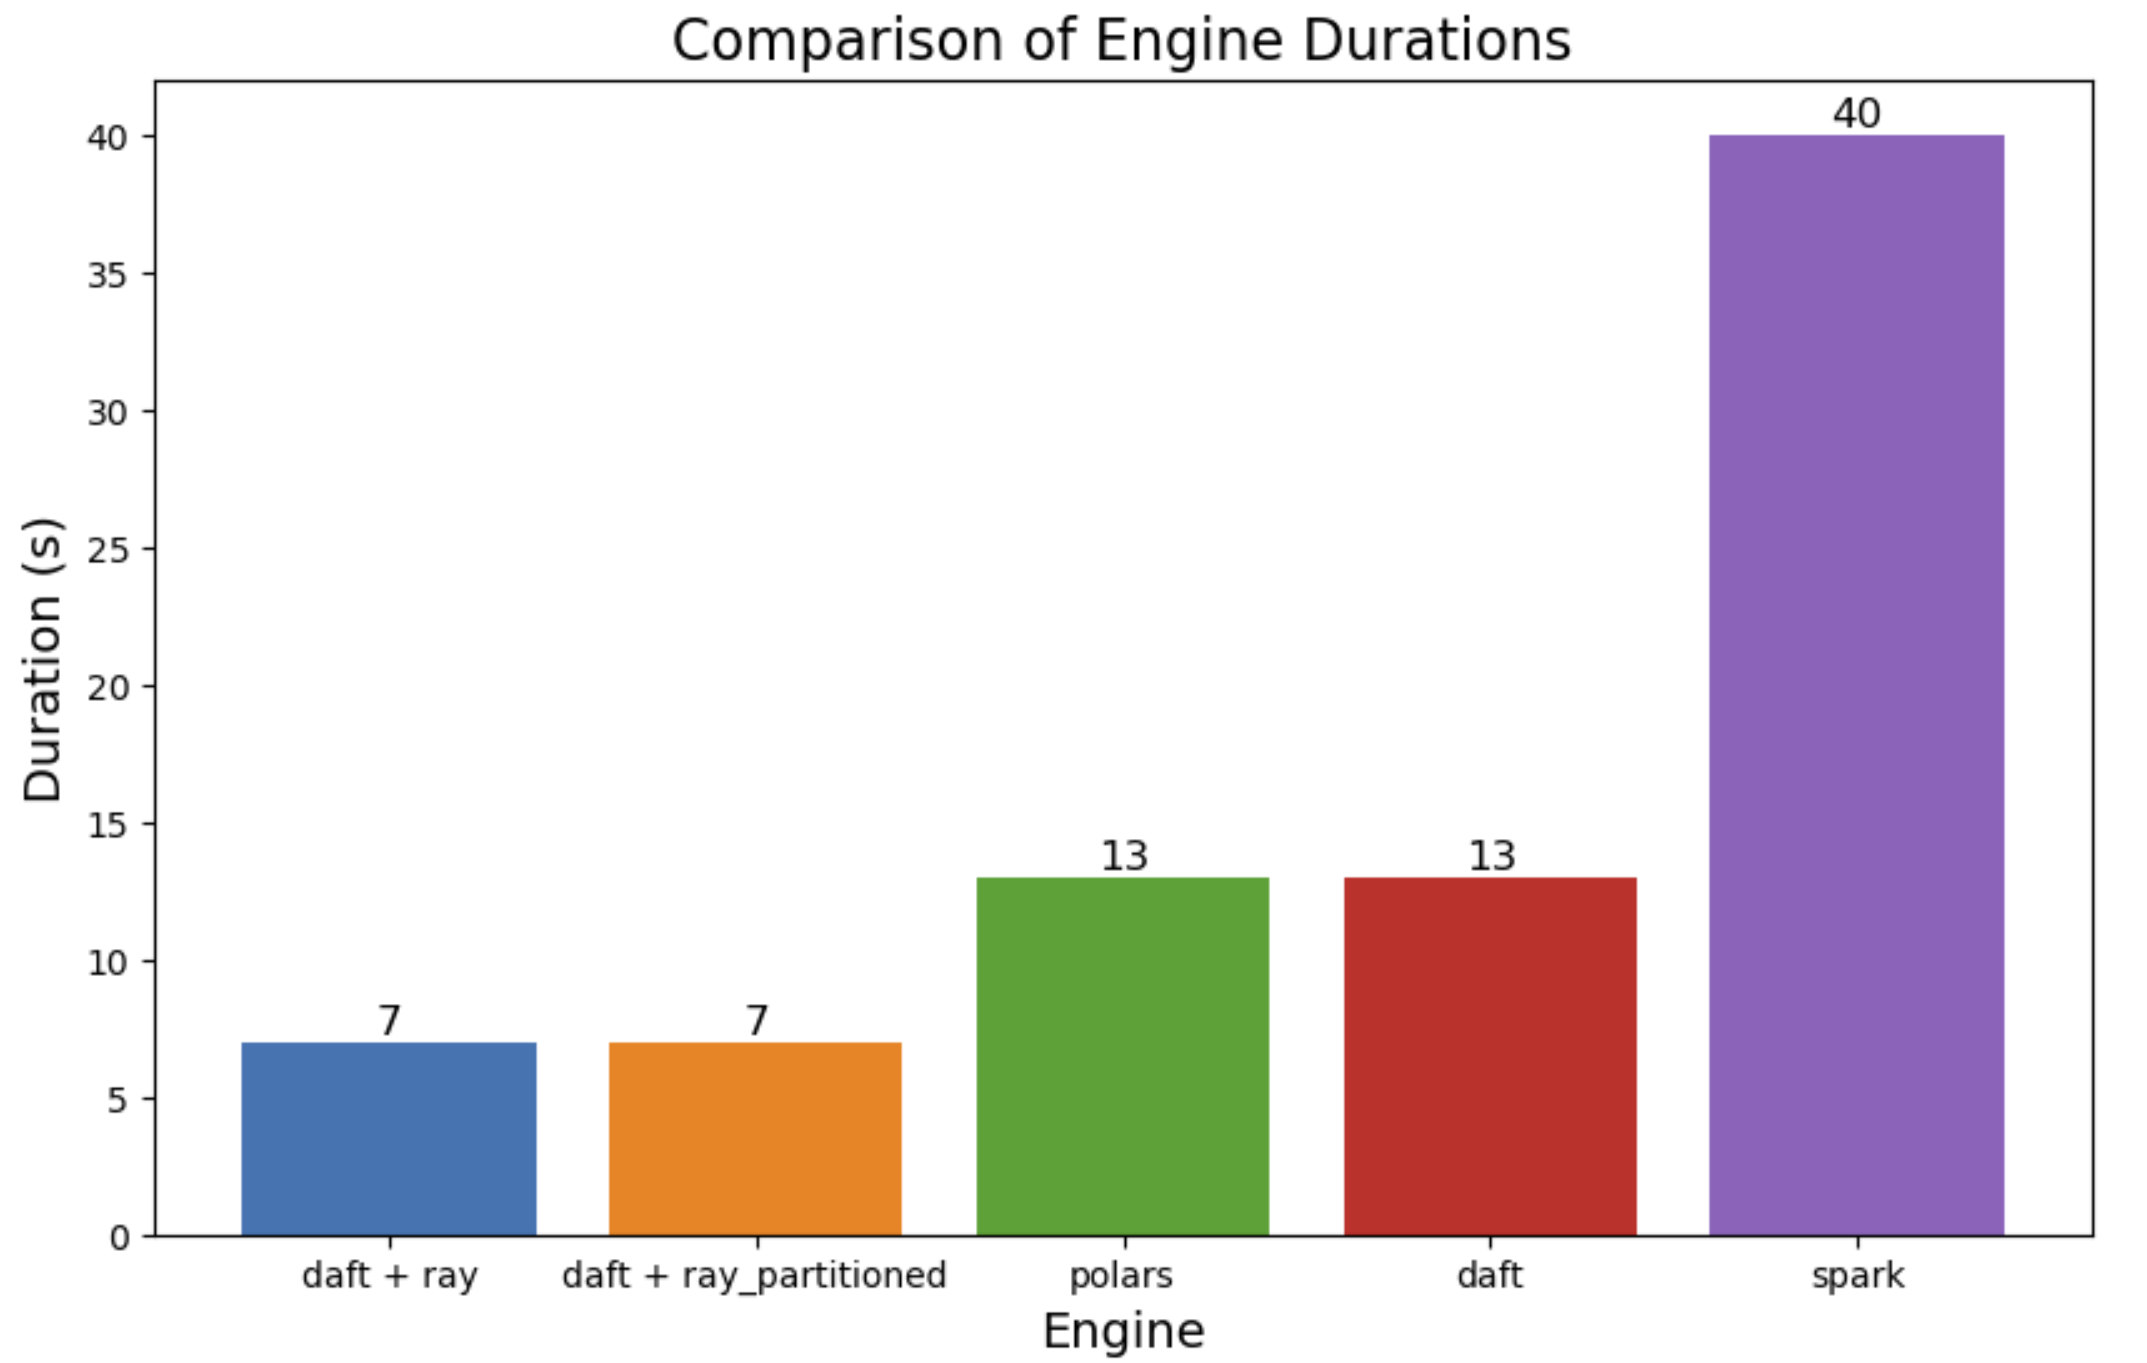
I transformed the data using same filters and aggregations for all engines and recorded the durations. These are all cold cache.
#Fabric runtime 1.2
%pip install getdaft[all] polars deltalake --q

import daft
import ray
import polars as pl
import time
import psutil
import pandas as pd
import matplotlib.pyplot as plt

path = "/lakehouse/default/Tables/commongov"

durations={}
Polars:
start = time.perf_counter()
result=(pl.scan_delta(path)
.filter(pl.col("_c49")=="NAVY")
.filter(pl.col("_c9")<250)
.group_by(["_c3","_c35"])
.agg(pl.col("_c10").sum(), pl.col("_c37").sum())
.collect()
)

durations['polars']=round(time.perf_counter()-start)
Daft (Default):
start = time.perf_counter()
table_uri = (path)
df = daft.read_delta_lake(table_uri)

df_agg = (df
            .where((df["_c55"]==2011) &
                   (df["_c49"]=="NAVY") &
                   (df["_c9"]<250)
                   )
            .groupby(["_c3","_c35"])
            .agg([(df["_c10"],"sum"),(df["_c37"],"sum")])
            .collect()
         )
durations['daft']=round(time.perf_counter()-start)
Daft with Ray: Default
table_uri = (path)

if not ray.is_initialized():
    ray.init(runtime_env={"pip": ["getdaft"]}, num_cpus=8)
resources = ray.cluster_resources()
print("Available resources:", resources)
print("Available CPUs (workers):", resources.get("CPU", "Not available"))

# print CPU usage
def print_cpu_usage():
    cpu_usage = psutil.cpu_percent(interval=1, percpu=True)
    print("CPU Usage per core:", cpu_usage)

# CPU usage
print_cpu_usage()

start = time.perf_counter()
df = daft.read_delta_lake(table_uri)

df_agg = (
    df.where((df["_c55"] == 2011) & (df["_c49"] == "NAVY") & (df["_c9"] < 250))
    .groupby(["_c3", "_c35"])
    .agg([(df["_c10"], "sum"), (df["_c37"], "sum")])
    .collect()
)

durations['daft + ray']=round(time.perf_counter()-start)
Daft with Ray : Partitioned data
I partitioned the data into 8 partitions just to see if that would help with parallelizing the tasks effectively.
#ray.shutdown() #shutdown the previous ray cluster
table_uri = (path)
if not ray.is_initialized():
    ray.init(runtime_env={"pip": ["getdaft"]}, num_cpus=8)
resources = ray.cluster_resources()
print("Available resources:", resources)

print("Available CPUs (workers):", resources.get("CPU", "Not available"))

print_cpu_usage()

start = time.perf_counter()
df = daft.read_delta_lake(table_uri).repartition(num=8) #partitions

df_agg = (
    df.where((df["_c55"] == 2011) & (df["_c49"] == "NAVY") & (df["_c9"] < 250))
    .groupby(["_c3", "_c35"])
    .agg([(df["_c10"], "sum"), (df["_c37"], "sum")])
    .collect()
)

durations['daft + ray_partitioned']=round(time.perf_counter()-start)
Spark:
from pyspark.sql.functions import col, sum as sum_
start = time.perf_counter()
result = (
    spark.table("commongov")
      .filter(col("_c55") == 2011)
      .filter(col("_c49") == "NAVY")
      .filter(col("_c9") < 250)
      .groupBy("_c3", "_c35")
      .agg(sum_("_c10").alias("sum_c10"), sum_("_c37").alias("sum_c37"))
).collect()
durations['spark']=round(time.perf_counter()-start)
Result:
df = pd.DataFrame(list(durations.items()), columns=['engine', 'duration']).sort_values("duration")
plt.figure(figsize=(10, 6))
barplot = plt.bar(df['engine'], df['duration'], color=['#1f77b4', '#ff7f0e', '#2ca02c', '#d62728', '#9467bd'])
plt.title('Comparison of Engine Durations', fontsize=16)
plt.xlabel('Engine', fontsize=14)
plt.ylabel('Duration (s)', fontsize=14)

for bar in barplot:
    yval = bar.get_height()
    plt.text(bar.get_x() + bar.get_width()/2, yval, round(yval, 1), va='bottom', ha='center', fontsize=12)

plt.show()

Notes:
Using the Ray cluster helped compared to polars and default daft - in this case
Like spark, I tried experimenting with various partitioning strategies to balance the load but that didn't seem to improve the performance
I don't know if there are any Ray configs that can be tuned to improve parallelization. I also don't know if these are generalizable.
I don't know how to use Ray for prod workloads and if at all it can be used in Fabric, should be interesting.
You can set up a Ray cluster in databricks.
How Amazon migrated from spark to daft + ray : article
If you spot anything odd or have suggestions, please let me know.
Subscribe to my newsletter
Read articles from Sandeep Pawar directly inside your inbox. Subscribe to the newsletter, and don't miss out.
Written by

Sandeep Pawar
Sandeep Pawar
Principal Program Manager, Microsoft Fabric CAT helping users and organizations build scalable, insightful, secure solutions. Blogs, opinions are my own and do not represent my employer.