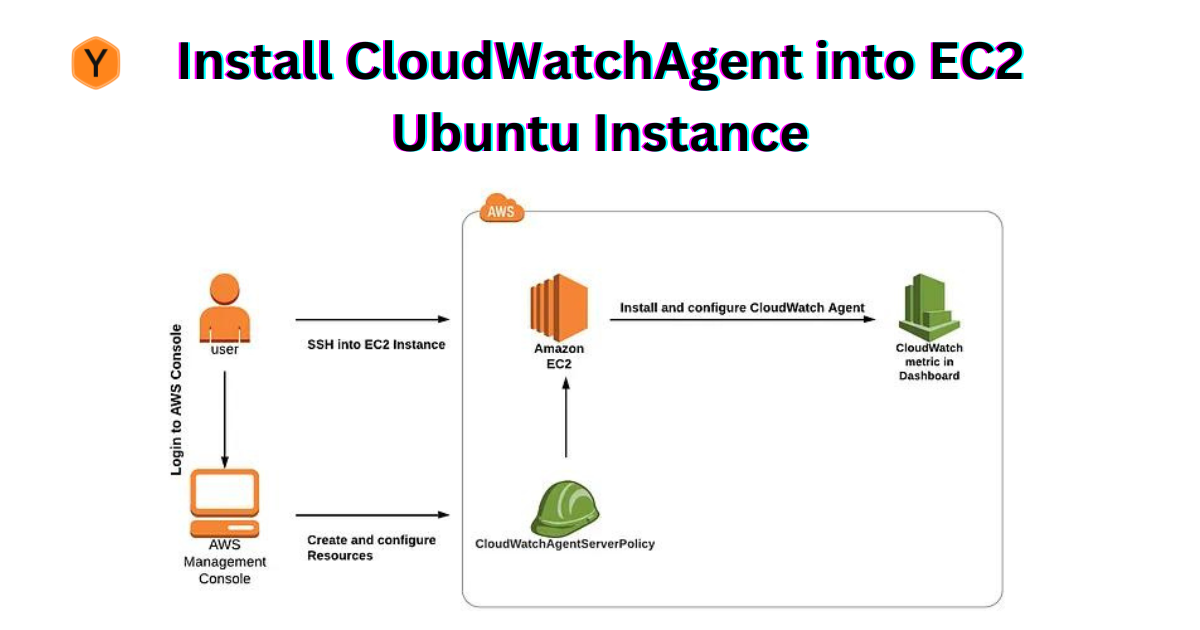
CloudWatch-Agent Install into EC2 Ubuntu Instance
 Yash Babariya
Overview
The Amazon CloudWatch Agent enables you to do the following:
Collect more system-level metrics from Amazon EC2 instances across operating systems. The metrics can include in-guest metrics, in addition to the metrics for EC2 instances. The additional metrics that can be collected are listed in Metrics Collected by the CloudWatch Agent.
Collect system-level metrics from on-premises servers. These can include servers in a hybrid environment and servers not managed by AWS.
Retrieve custom metrics from your applications or services using the StatsD and collectd protocols. StatsD is supported on both Linux servers and servers running Windows Server. collectd is supported only on Linux servers.
Collect logs from Amazon EC2 instances and on-premises servers, running either Linux or Windows Server.
Collect Open Telemetry and AWS X-Ray traces
/Amazon CloudWatch Agent uses open-source projects telegraf and opentelemetry-collector as its dependencies. It operates by starting an opentelemetry collector and can operate pipelines consisting of telegraf and optometry components and customized components.
Setup
Configuring IAM Roles
Installation
Configuring the CloudWatch Agent
1. Setup an IAM User Account and Permissions
The first procedure creates the IAM role that you must attach to each Amazon EC2 instance that runs the CloudWatch agent. This role provides permissions for reading information from the instance and writing it to CloudWatch.
- cloudwatch_agent_custom_policy
{
    "Version": "2012-10-17",
    "Statement": [
        {
            "Sid": "AllowReadingMetricsFromCloudWatch",
            "Effect": "Allow",
            "Action": [
                "cloudwatch:DescribeAlarmsForMetric",
                "cloudwatch:DescribeAlarmHistory",
                "cloudwatch:DescribeAlarms",
                "cloudwatch:ListMetrics",
                "cloudwatch:GetMetricData",
                "cloudwatch:GetInsightRuleReport"
            ],
            "Resource": "*"
        },
        {
            "Sid": "AllowReadingResourceMetricsFromPerformanceInsights",
            "Effect": "Allow",
            "Action": "pi:GetResourceMetrics",
            "Resource": "*"
        },
        {
            "Sid": "AllowReadingLogsFromCloudWatch",
            "Effect": "Allow",
            "Action": [
                "logs:DescribeLogGroups",
                "logs:GetLogGroupFields",
                "logs:StartQuery",
                "logs:StopQuery",
                "logs:GetQueryResults",
                "logs:GetLogEvents"
            ],
            "Resource": "*"
        },
        {
            "Sid": "AllowReadingTagsInstancesRegionsFromEC2",
            "Effect": "Allow",
            "Action": [
                "ec2:DescribeTags",
                "ec2:DescribeInstances",
                "ec2:DescribeRegions"
            ],
            "Resource": "*"
        },
        {
            "Sid": "AllowReadingResourcesForTags",
            "Effect": "Allow",
            "Action": "tag:GetResources",
            "Resource": "*"
        }
    ]
}
create role "cloudwatch-agent-role" and attach the "cloudwatch_agent_custom_policy" policy to the role. then after attaching this role to the ec2 instance.
Note:- If configure cloudwatch-agent into Prometheus-datasource then edit Trust relationships otherwise that's not needed below changes
{
    "Version": "2012-10-17",
    "Statement": [
        {
            "Effect": "Allow",
            "Principal": {
                "Service": "ec2.amazonaws.com",
                "AWS": "arn:aws:iam::562235946272:role/AmazonEKSNodeRole"
            },
            "Action": "sts:AssumeRole"
        }
    ]
}
2. Download and install the Cloudwatch agent in your EC2 instance
wget https://amazoncloudwatch-agent.s3.amazonaws.com/ubuntu/amd64/latest/amazon-cloudwatch-agent.deb
3. Launch the Cloudwatch wizard
sudo /opt/aws/amazon-cloudwatch-agent/bin/amazon-cloudwatch-agent-config-wizard
Choose these settings
  =============================================================
  = Welcome to the AWS CloudWatch Agent Configuration Manager =
  =============================================================
  On which OS are you planning to use the agent?
  1. linux
  2. windows
  default choice: [1]:

  Trying to fetch the default region based on ec2 metadata...
  Are you using EC2 or On-Premises hosts?
  1. EC2
  2. On-Premises
  default choice: [1]:

  Which user are you planning to run the agent?
  1. root
  2. cwagent
  3. others
  default choice: [1]:

  Do you want to turn on StatsD daemon?
  1. yes
  2. no
  default choice: [1]:

  Which port do you want StatsD daemon to listen to?
  default choice: [8125]

  What is the collect interval for StatsD daemon?
  1. 10s
  2. 30s
  3. 60s
  default choice: [1]:3

  What is the aggregation interval for metrics collected by StatsD daemon?
  1. Do not aggregate
  2. 10s
  3. 30s
  4. 60s
  default choice: [4]:4

  Do you want to monitor metrics from CollectD?
  1. yes
  2. no
  default choice: [1]:2

  Do you want to monitor any host metrics? e.g. CPU, memory, etc.
  1. yes
  2. no
  default choice: [1]:1

  Do you want to monitor cpu metrics per core? Additional CloudWatch charges may apply.
  1. yes
  2. no
  default choice: [1]:2

  Do you want to add ec2 dimensions (ImageId, InstanceId, InstanceType, AutoScalingGroupName) into all of your metrics if the info is available?
  1. yes
  2. no
  default choice: [1]:1

  Would you like to collect your metrics at high resolution (sub-minute resolution)? This enables sub-minute resolution for all metrics, but you can customize for specific metrics in the output json file.
  1. 1s
  2. 10s
  3. 30s
  4. 60s
  default choice: [4]:4

  Which default metrics config do you want?
  1. Basic
  2. Standard
  3. Advanced
  4. None
  default choice: [1]:1

  Current config as follows:
  {
      "agent": {
          "metrics_collection_interval": 60,
          "run_as_user": "root"
      },
      "metrics": {
          "metrics_collected": {
              "disk": {
                  "measurement": [
                      "used_percent"
                  ],
                  "metrics_collection_interval": 60,
                  "resources": [
                      "*"
                  ]
              },
              "mem": {
                  "measurement": [
                      "mem_used_percent"
                  ],
                  "metrics_collection_interval": 60
              },
              "statsd": {
                  "metrics_aggregation_interval": 60,
                  "metrics_collection_interval": 60,
                  "service_address": ":8125"
              }
          }
      }
  }

  Are you satisfied with the above config? Note: it can be manually customized after the wizard completes to add additional items.
  1. yes
  2. no
  default choice: [1]: 1

  Do you have any existing CloudWatch Log Agent (http://docs.aws.amazon.com/AmazonCloudWatch/latest/logs/AgentReference.html) configuration file to import for migration?
  1. yes
  2. no
  default choice: [2]: 2

  Do you want to monitor any log files?
  1. yes
  2. no
  default choice: [1]:
  2
  Saved config file to /opt/aws/amazon-cloudwatch-agent/bin/config.json successfully
4. Start the Cloudwatch agent
sudo /opt/aws/amazon-cloudwatch-agent/bin/amazon-cloudwatch-agent-ctl -a fetch-config -m ec2 -s -c file:/opt/aws/amazon-cloudwatch-agent/bin/config.json
5. Command to check the status of the Cloudwatch agent
systemctl start amazon-cloudwatch-agent
systemctl status amazon-cloudwatch-agent
Note :- If you want to "mem_used" metrics then you can edit the config.json file.
    {
        "agent": {
            "metrics_collection_interval": 60,
            "run_as_user": "root"
        },
        "metrics": {
            "metrics_collected": {
                "disk": {
                    "measurement": [
                        "used_percent"
                    ],
                    "metrics_collection_interval": 60,
                    "resources": [
                        "*"
                    ]
                },
                "mem": {
                    "measurement": [
                        "mem_used"
                    ],
                    "metrics_collection_interval": 60
                },
                "statsd": {
                    "metrics_aggregation_interval": 60,
                    "metrics_collection_interval": 60,
                    "service_address": ":8125"
                }
            }
        }
    }
sudo /opt/aws/amazon-cloudwatch-agent/bin/amazon-cloudwatch-agent-ctl -a fetch-config -m ec2 -s -c file:/opt/aws/amazon-cloudwatch-agent/bin/config.json
systemctl restart amazon-cloudwatch-agent
systemctl status amazon-cloudwatch-agent
Subscribe to my newsletter
Read articles from Yash Babariya directly inside your inbox. Subscribe to the newsletter, and don't miss out.
Written by

Yash Babariya
Yash Babariya
I'm a DevOps engineer. I'm an AWS-certified solution architect - associate & CKA certified. I have strong experience with these tools. AWS, GCP, Kubernetes, docker, Gitlab, Jenkins, Prometheus, grafana, terraform, helm, Linux, scripting, database migration, Nginx