Peer-observer: Monitor your Bitcoin Peers
 Yuvraj Chhetri
Bitcoin is a decentralized currency system governed by a peer-to-peer network. It was introduced by a group or person known as Satoshi Nakamoto in their white paper SatsNaka. Value is transferred on the network by sending transactions. Bitcoin uses a gossip protocol to relay messages across the network. When a user creates a transaction, they send it to their directly connected peers. These peers assess whether the transaction is valid. If it is, they relay it to their peers, and the transaction is propagated through the rest of the network. If it is not valid, it is ignored.
Peer-observer is a tool that helps monitor your peers(nodes that you are connected to) in real-time, and it also helps identify p2p anomalies and attacks. Peer-observer uses the tracepoints in Bitcoin Core to extract, for example, the p2p messages exchanged between a node and its peers.
Components of Peer-observer
The peer-observer consists of various components, with extractor being the primary one. The extractor extracts multiple events from the Bitcoin Core Tracepoints by leveraging the libbpf library. If you look at the extractor file, the build.rs file creates the skeleton file - which generates a Rust file to interact with eBPF components, Ring-buffers are created on the eBPF side and in main.rs, we attach handler functions for events. The handler functions in main.rs convert events to protobuf messages and publish the nanomsg messages to the subscribers(tools here).
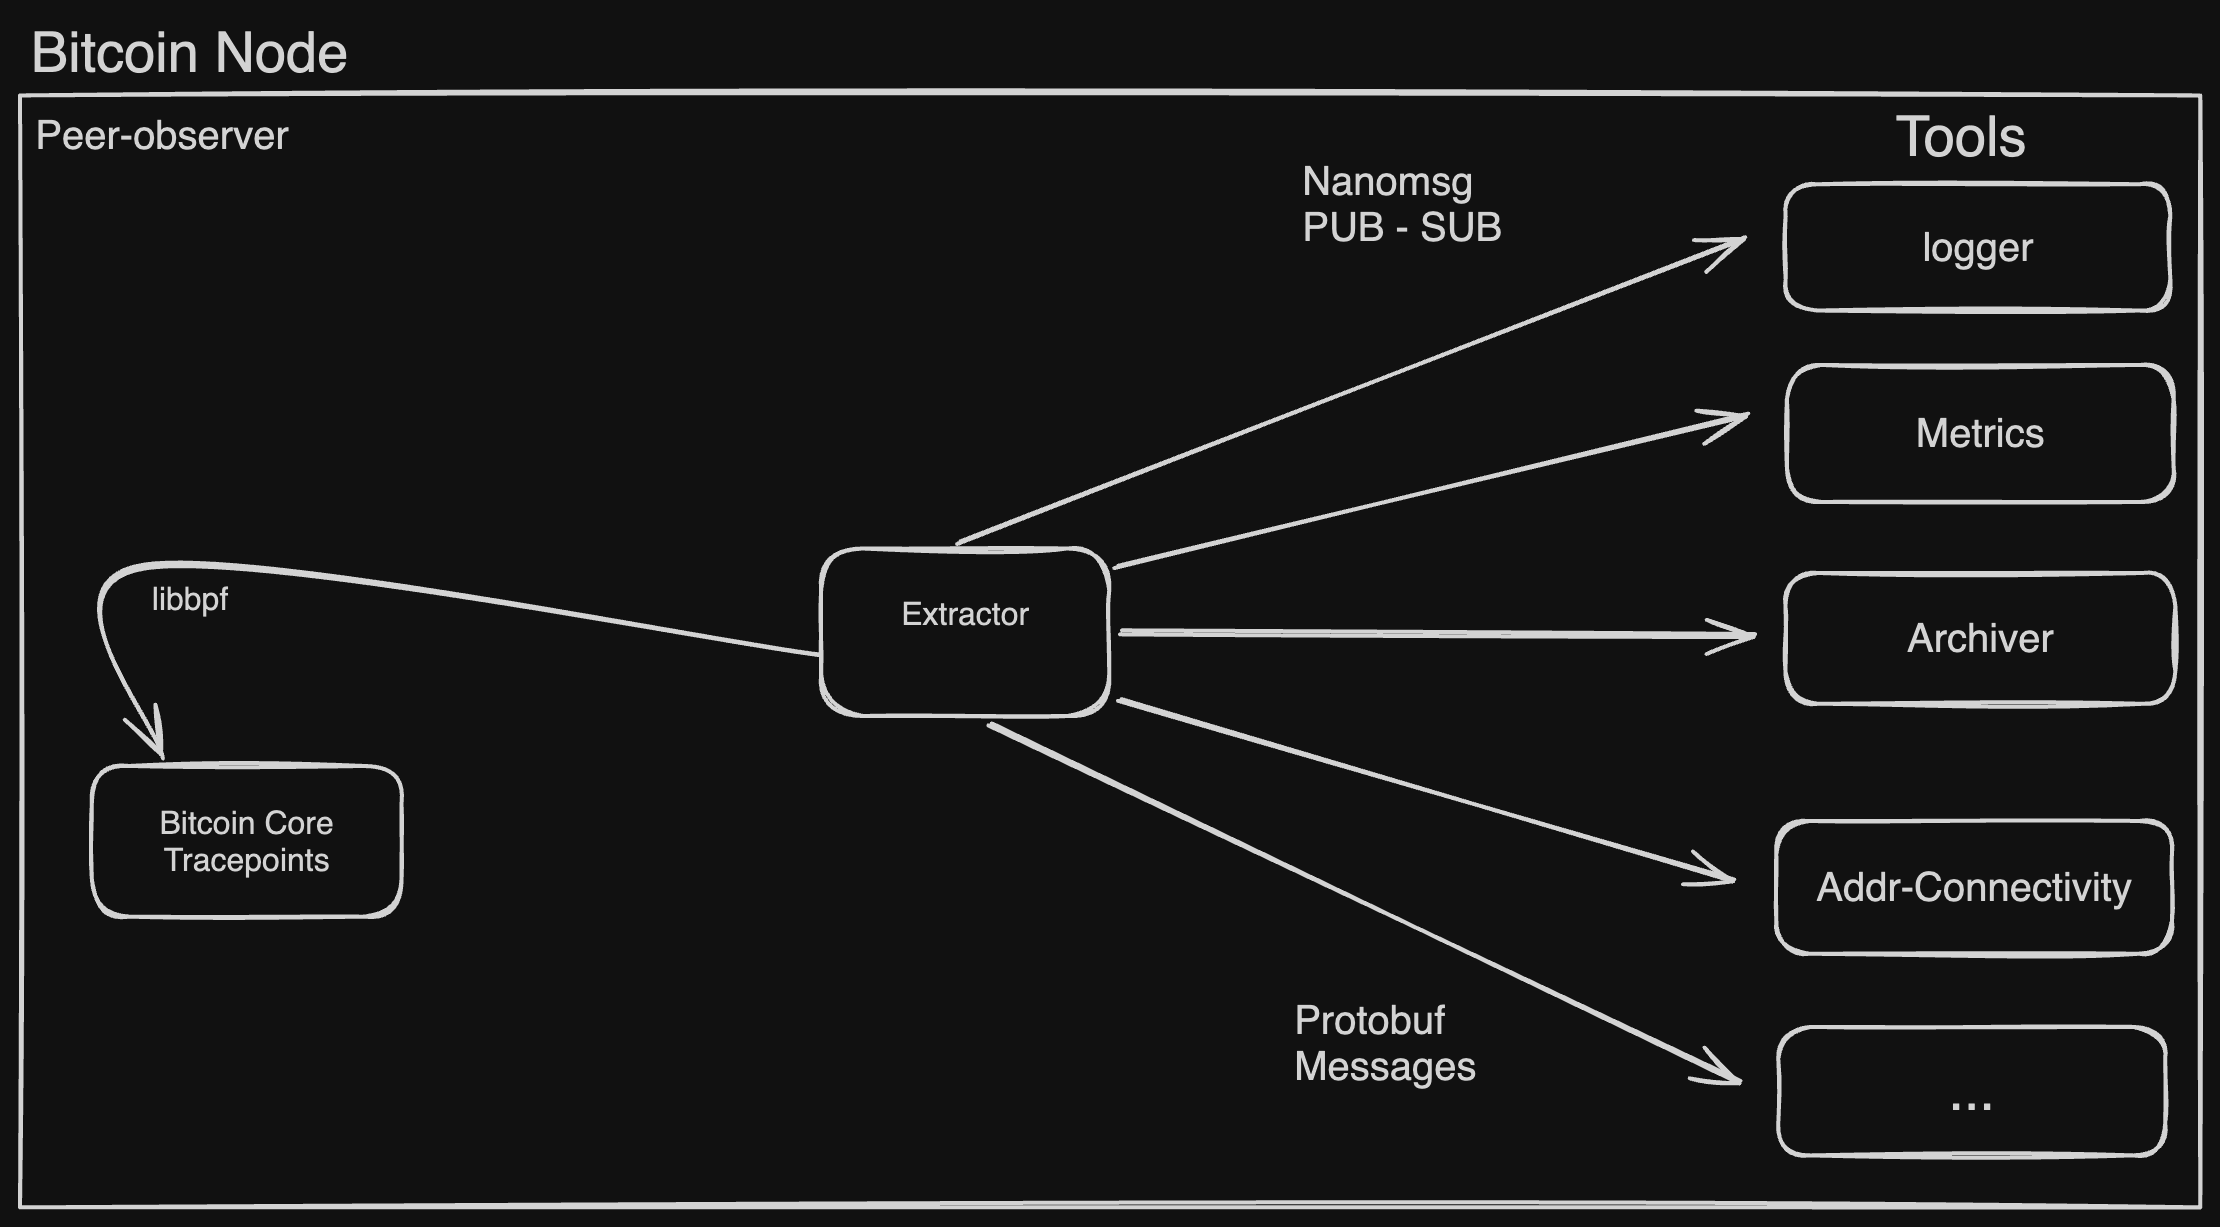
The tools are written in Rust except ping-recorder-py which is written in Python, both of them support protobuf and nanomsg. The tools are the subscriber whereas the extractor is the publisher. The logger tool simply prints all the messages it receives from the extractor. The metrics converts messages to Prometheus metrics so that we can leverage these metrics for visualization and anomaly detection.
Pre-requisites for running peer-observer
Linux System with root privileges
Clone this custom Bitcoin Repo from here
Install Cargo
Clone peer-observer
Note: We must build the custom bitcoind from the cloned repo for the peer-observer to work.
Building and Running Peer-observer
After installing cargo and cloning both the peer-observer and custom bitcoin repo. Now we need to build bitcoind and run it before we run the peer-observer. If you are having trouble building Bitcoin Core, I have already published an article to make life easier. A pruned node will also do the work.
Now it's time to run the peer-observer 🚀
Install dependencies
  sudo apt update -y
  sudo apt-get install -y \
  protobuf-compiler \
  libelf-dev \
  clang \
  llvm \
  llvm-14 \
  zstd \
  binutils-dev \
  elfutils \
  gcc-multilib
cdinto the peer-observer directorycd ./<path to cloned peer-observer>/peer-observercargo buildthe programcargo build .Run the
extractorwith sudo as we are hooking into Bitcoin Core tracepoints which requires root privilegessudo ./target/debug/extractor ./<path to cloned custom bitcoin repo>/bitcoin/src/bitcoindNote: Make sure the bitcoind path is the path to custom built bitcoind
Run the
loggerto see the p2p messages exchanged between the peer./target/debug/logger
The output should look something similar to this:
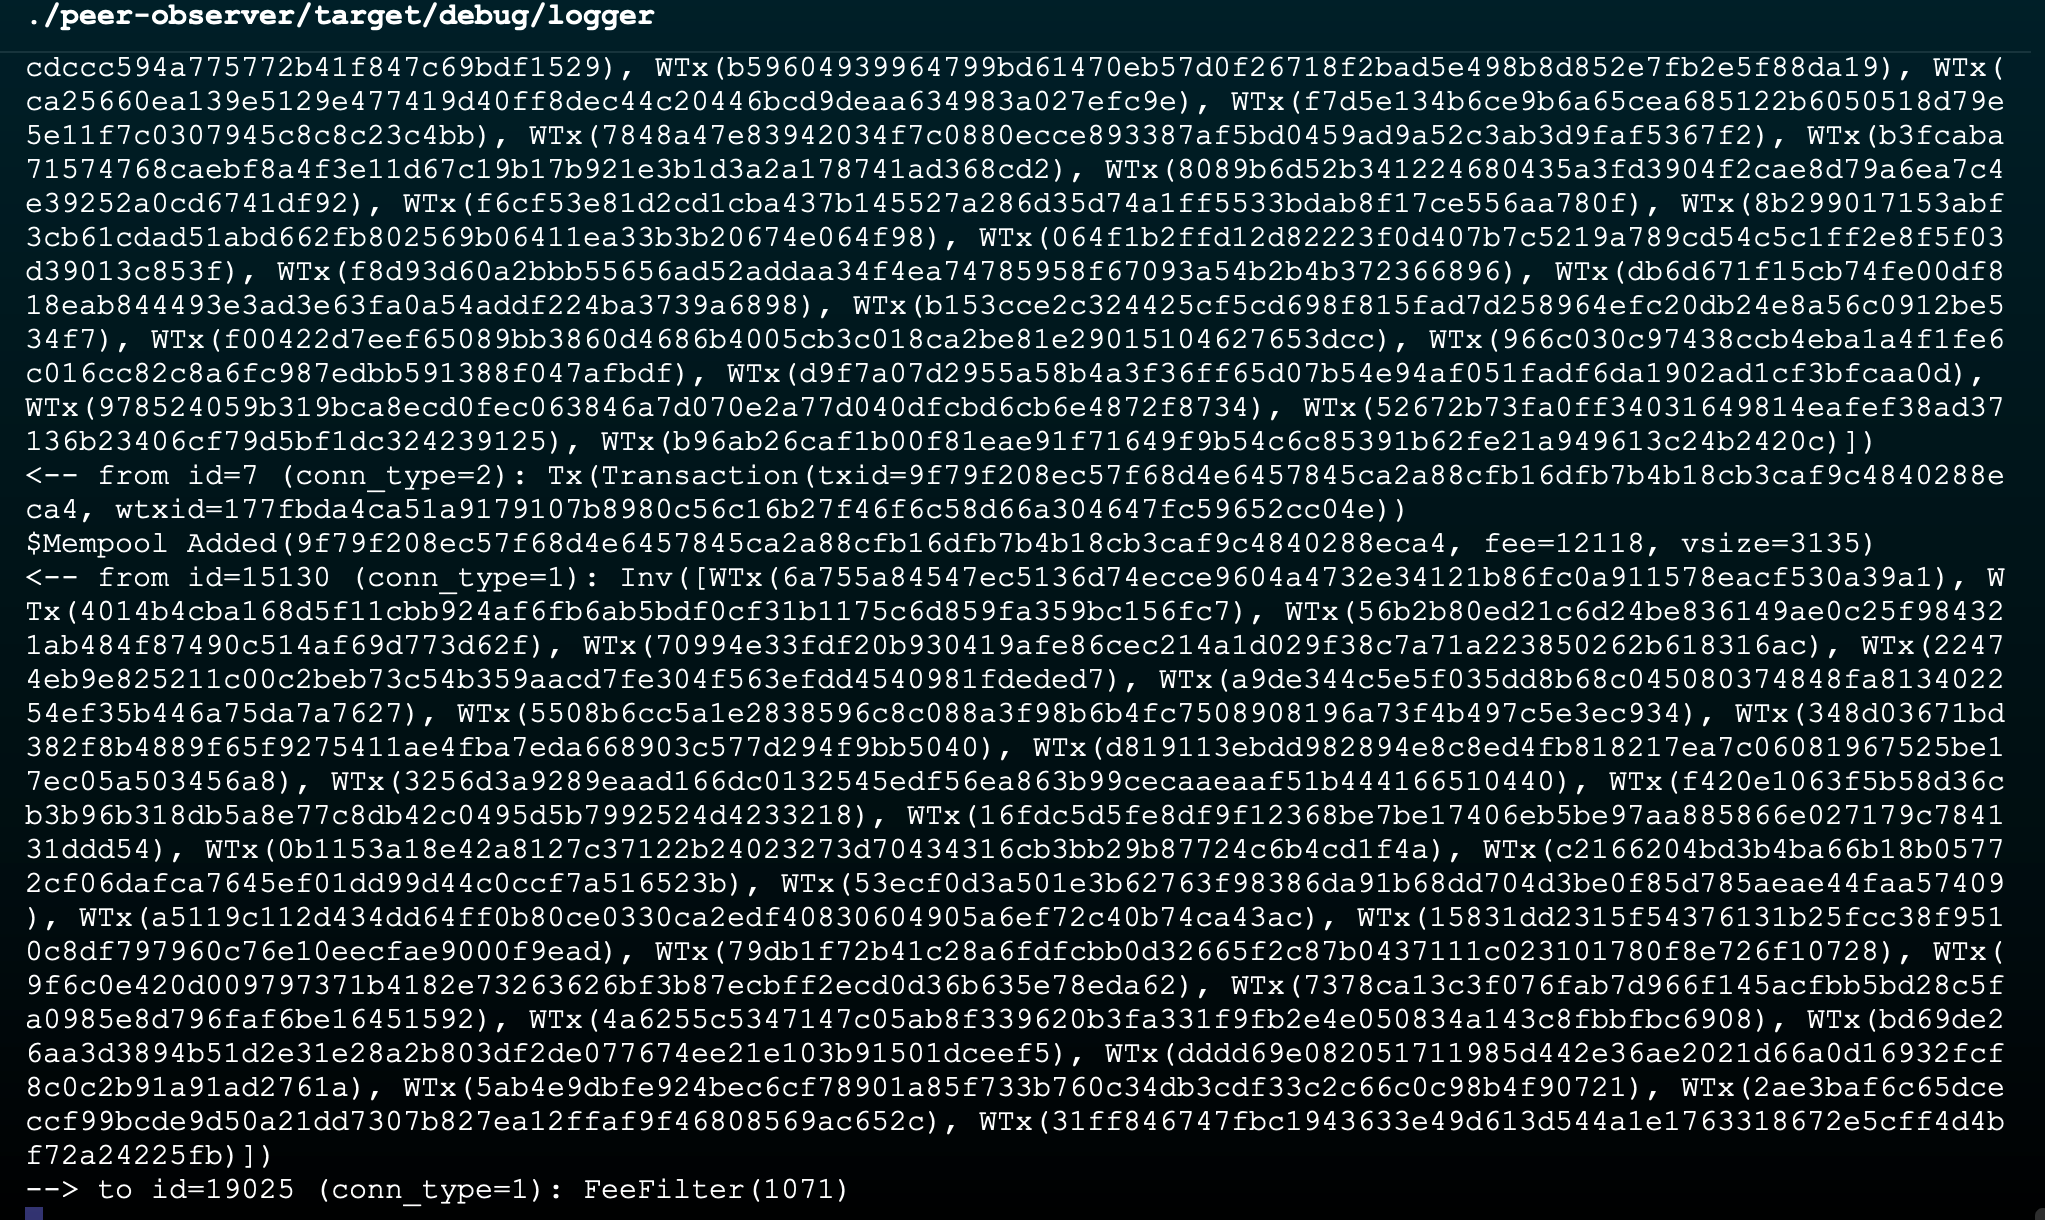
The logger displays all the p2p(inv, tx, addr, etc) messages between your node and the peers.
Visualising using Prometheus and Grafana
Let us use the metrics tool that converts messages to Prometheus metrics and visualizes using Prometheus and Grafana Dashboard.
- Run the
metricstool
<path-to-peer-observer>/target/debug/metrics localhost:8282
Note: if port 8282 is already occupied then feel free to use any other port
- Install and configure Prometheus
Update the Prometheus configuration with:
scrape_configs:
  - job_name: metrics-server
    honor_timestamps: true
    track_timestamps_staleness: false
    scrape_interval: 15s
    scrape_timeout: 10s
    scrape_protocols:
      - OpenMetricsText1.0.0
      - OpenMetricsText0.0.1
      - PrometheusText0.0.4
    metrics_path: /metrics
    scheme: http
    enable_compression: true
    follow_redirects: true
    enable_http2: true
    http_headers: null
    static_configs:
      - targets:
        - localhost:8282         #specify the port you have used
Now, restart your Prometheus server so that the new configuration is applied.
sudo systemctl restart prometheus
- Install and run Grafana
You should see your Grafana running at the URL localhost:3000
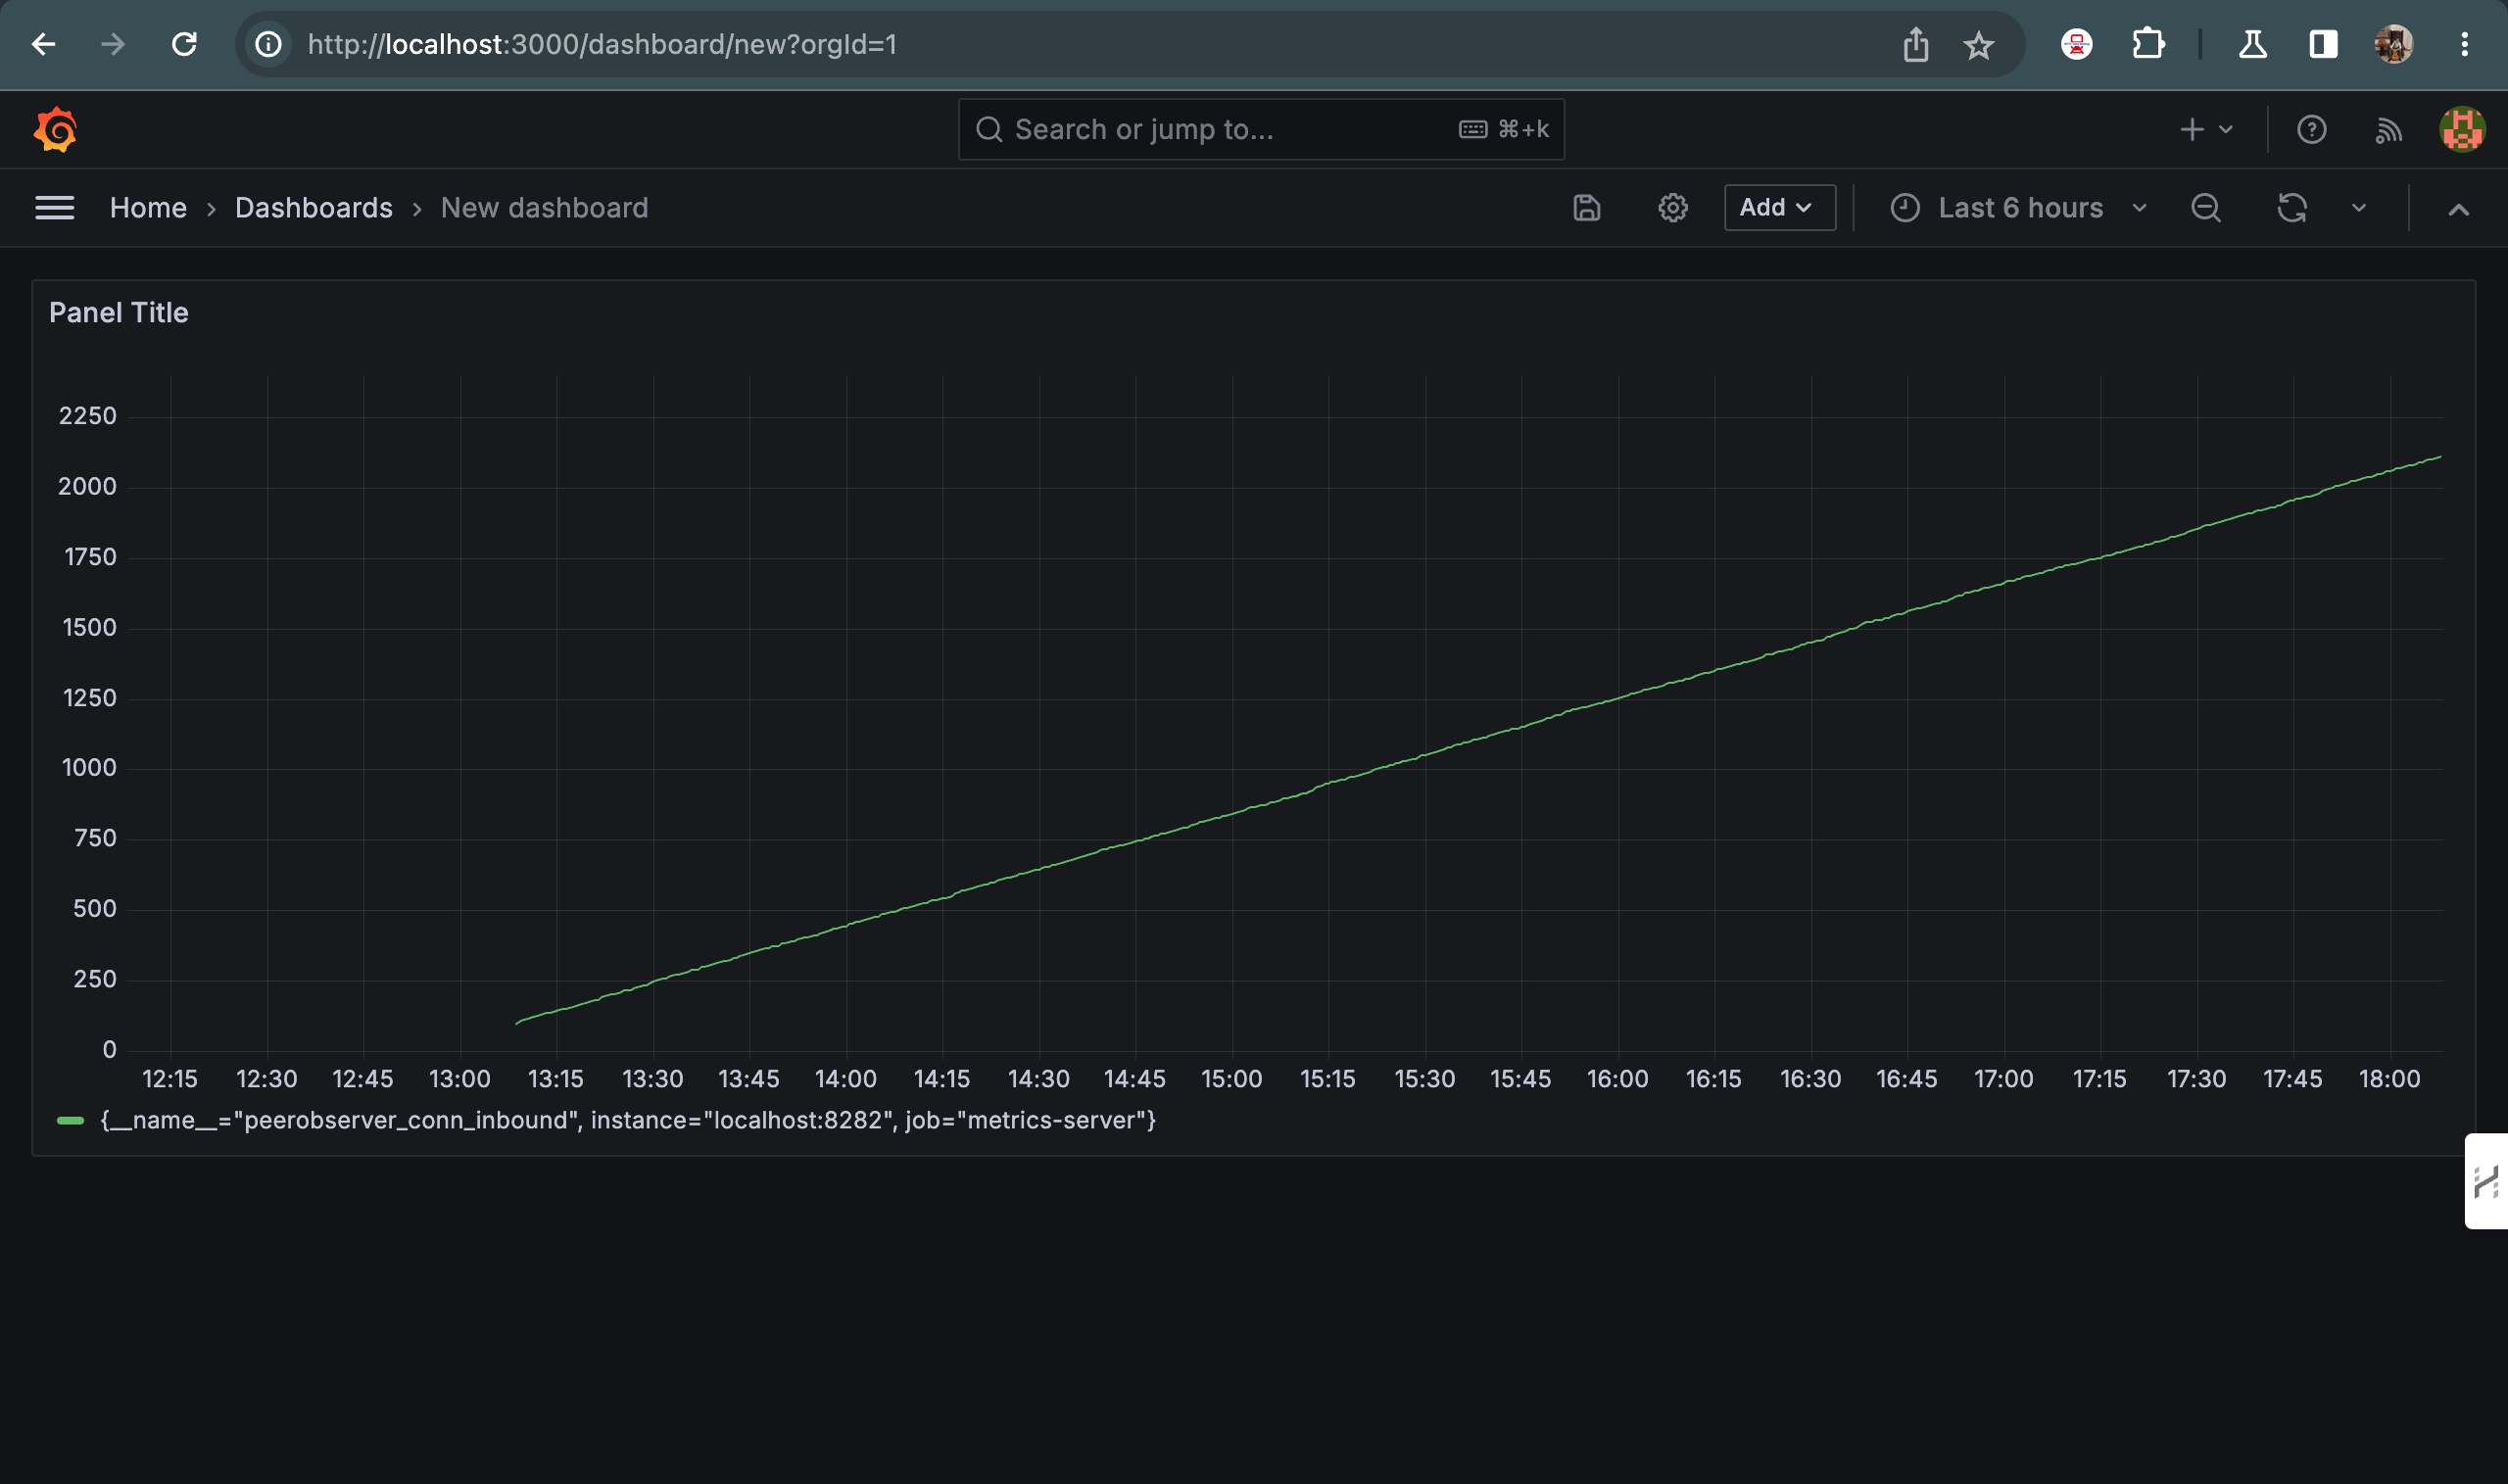
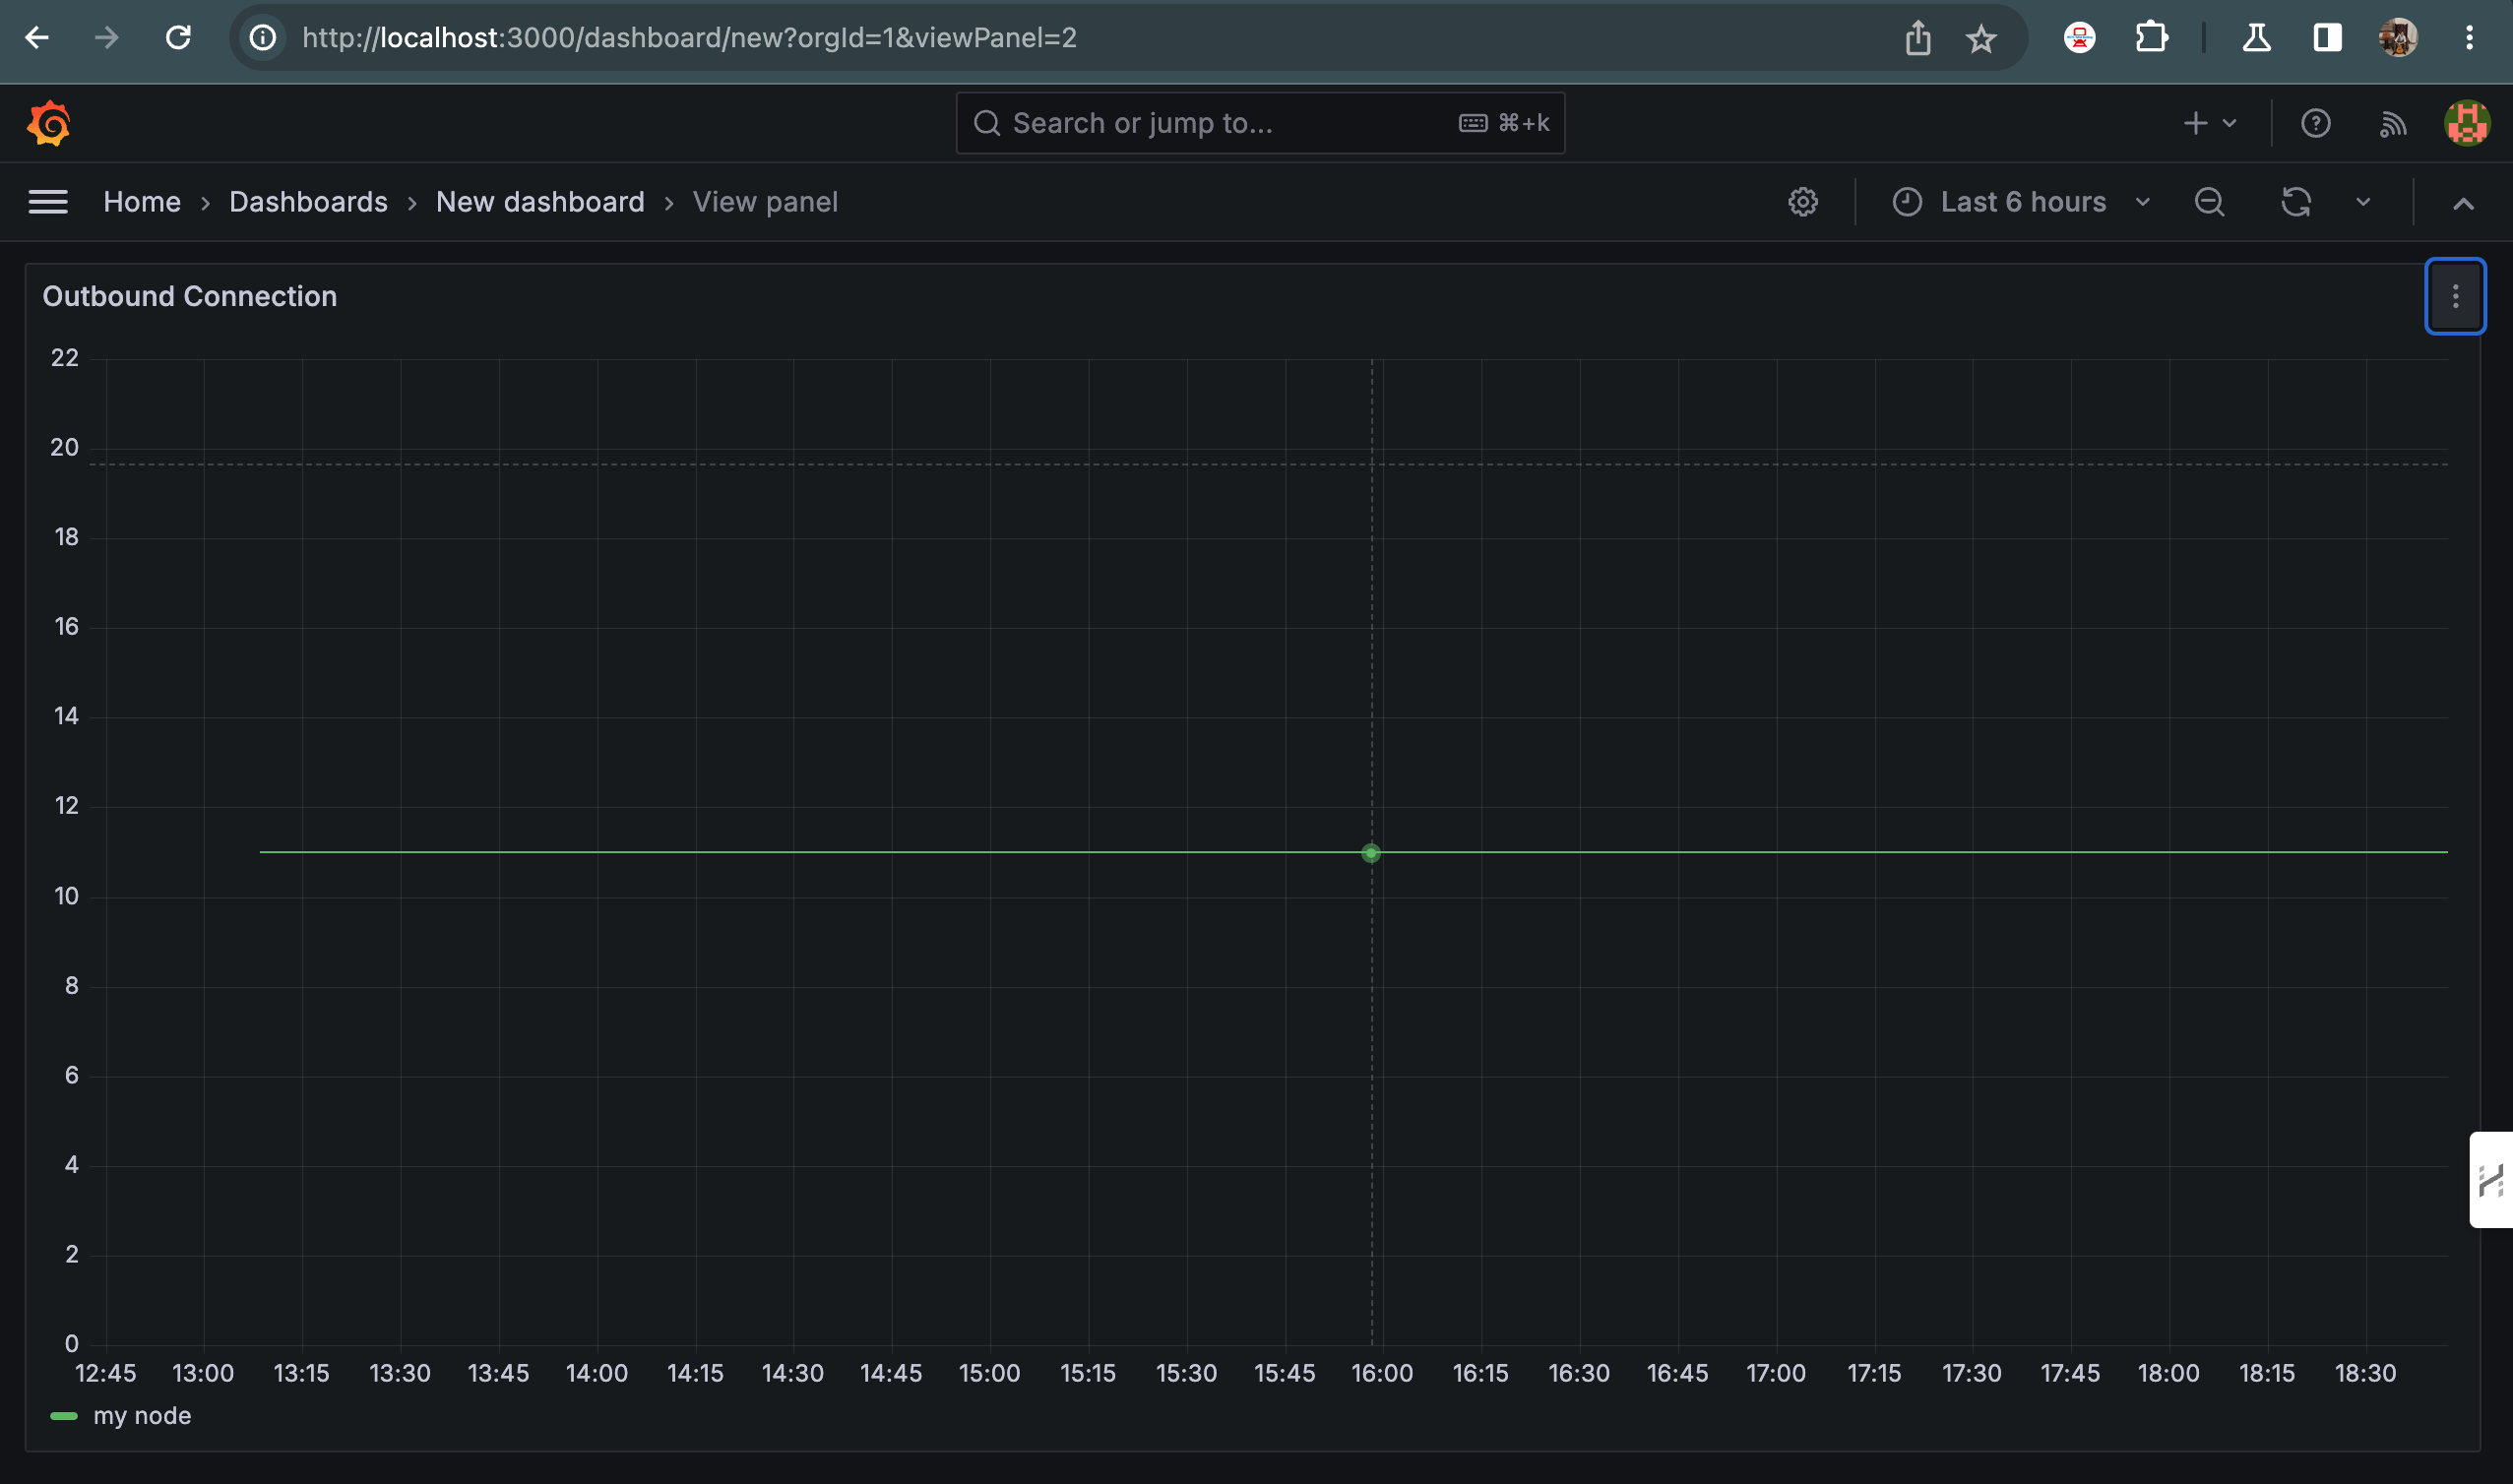
Use the metric peerobserver_conn_outbound_current to visualize the current outbound connection i.e. 10 of the node.
Let's hook into some real-world scenarios
Peer-observer has a lot of different use-cases such as monitoring your node's p2p messages received and sent. Identifying the anomaly in the network, e.g. we can have multiple nodes(let's say 10-15) that we have initialized for detecting anomalies in the Bitcoin p2p network which is done by the metrics tool that converts the traces to Prometheus metrics which Prometheus and Grafana later use for visualisation. Some of the data that I have collected during my Summer Of Bitcoin for Bitcoin Core under 0xB10C can be seen here.
On 28th May 2024 we saw an anomaly affecting one of our nodes, Alice had 100% CPU usage in the "b-msghand" thread. Alice has peerblockfilters and peerbloomfilters enabled. Turns out that after announcing its new IP with support for NODE_BLOOM, a bunch of "Schildbach's Bitcoin Wallets" (/bitcoinj:0.16.2/Bitcoin Wallet:10.14/) decided to connect and request merkleblocks from Alice. Bloom filters/BIP37 is known to be expensive and a DoS vector which is cool to see happening and getting picked up by the monitoring(Prometheus + grafana).
In Bitcoin Core v21, there was a bug where an attacker could spam addr messages which could lead to a crash. This was fixed by Sipa in this PR implements a token bucket-based rate limiter, allowing an average of 0.1 addr/s per connection, with bursts up to 1000 addresses at once. Whitelisted peers as well as responses to GETADDR requests are exempt from the limit. Such an addr spam attack could also be picked up by the peer-observer as the peer-observer can keep track of addr and addrv2 messages received from the peers, later an alerting can be set if it exceeds the threshold.

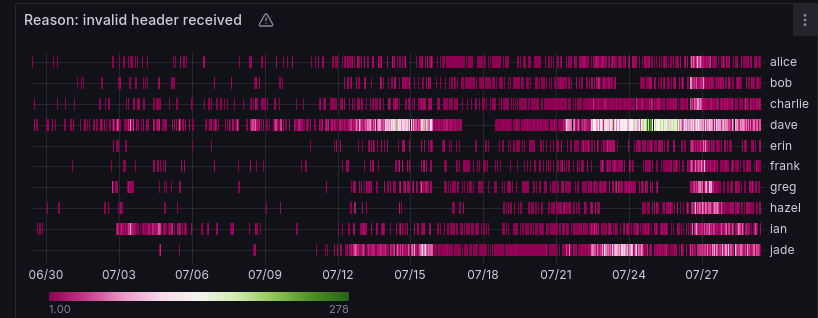
In another report on Twitter where two Bitcoin Clients serving invalid headers, one of the failures always correlates to: /Satoshi:24.0.1/ (Height: 28719) And the other always to: /Satoshi:24.0.1/ (Height: 129509) which could also be seen in peer-observer peer misbehaviour metric invalid header sync
Subscribe to my newsletter
Read articles from Yuvraj Chhetri directly inside your inbox. Subscribe to the newsletter, and don't miss out.
Written by

Yuvraj Chhetri
Yuvraj Chhetri
India