Fine Tuning Llama 3.1-8B and Debugging Issues with Doctor Droid
 Shubham Bhardwaj
Are you trying to leverage Open Source AI models like Meta's latest release of LlaMa 3.1 over proprietary models (GPT-4o and Claude 3.5 Sonnet)?
Obviously, open source models have a variety of challenges: from deployment & reliability, accuracy to low latency, to optimising GPU costs. I have been working on these problems ever since LlaMa 2 was released, and in this blog, have discussed how we can navigate some of the problems and debug issues with LLMs, illustrating the same with fine-tuning of a 4-bit quantized model of Llama 3.1-8B.
1. Llama 3.1-8B - RAG vs Fine-tuning
I have found LlaMa 3-8B good enough for general use cases (text summarization, classification, sentiment analysis and language translation) and the trend continues with Llama 3.1-8B. However, most production use cases are domain oriented and the model's knowledge/accuracy on these cases is relatively much lower.
While retrieval augmented generation (RAG) certainly helps in using domain data with LLMs, using a fine-tuned model can be more effective in terms of quality, cost and latency depending on the use case and associated token usage. It helps incorporating brand voice and creating personalized LLMs.
Why Quantization?
However, when it comes to latency, LlaMa 3.1-8B can take tens of seconds for inference, if not minutes. Quantization has been found quite effective in terms of improving the inference speed (the 4-bit quantized version can infer in 2-3 seconds). This comes at the expense of accuracy, but the latter can be enhanced with Fine Tuning.
I now present the different stages of the Fine-Tuning pipeline for 4-bit quantized Llama 3.1-8B. The model is fine-tuned on documents associated with medical research and issues with the fine-tuned model are debugged with Dr Droid Playbooks.
2. Fine-Tuning 4-bit quantized Llama 3.1-8B on Research Papers
The following steps were involved in the process -
1. Extracting attributes related to Research Papers using 8-bit quantized Llama 8.1B and storing them in a database.
2. Generating a fine-tuning dataset using the information in the database.
3. Fine Tuning a 4-bit quantized model of Llama 3.1-8B in Unsloth (using Colab Reference)

3. Testing the Fine Tuned Model and Debugging Issues
While testing the model, samples were chosen from the fine-tuning dataset and the model outputs were evaluated against the desired outputs.
These are some issues that I had to debug repeatedly when the model output was different from the desired output:
Is it a pipeline issue or a model issue? Whether the difference was due to the randomness in the model or due to issues with the data loading in the pipeline.
Why did the pipeline fail? The reasons behind pipeline failure (database connectivity issues, GPU memory constraints, pipeline stuck due to space issues, etc)
Processing issues: Any issues with how data was getting processed in the pipeline (whether the variables were being maintained and transformed correctly and necessary sanity checks were done).
The initial approach was to manually check the entries in the database for the corresponding record, by referring to all the associated tables and then investigate the server logs and ETL scripts to debug the reasons behind pipeline failure.
However, doing this was a cumbersome exercise and involved significant redundancy for couple of reasons:
For every incorrect response, I had to refer to the tables involved in the query for generating the fine tuning dataset and come up with queries to explore the discrepancies. This involved connecting to the respective database server frequently, and writing queries to do integrity/sanity checks on the columns that were returned as outputs. Further, when sanity issues were observed, the initial point of failure had to be located by tracking back the steps in the pipeline, and checking the values of attributes at different stages. While doing this, I had to keep different tabs open, and it was a great pain navigating between them.
Similarly, I had to connect to the database and job servers through Putty frequently and explore any logs/run a bunch of commands from my notepad that would help me locate any connectivity, memory or space issues. It was time consuming to locate the logs/details for the respective date and time.
I was exploring a solution where I could codify the different scenarios, and then just access the desired results when needed instead of having to connect to servers and databases every now and then and manually run the queries and commands. I tried Dr Droid Playbooks (learnt about the tool via some of their interesting content on Linkedin) which were solving the same problem -- diving deeper into it below.
4. Doctor Droid Playbooks
PlayBooks is an open source tool to codify and automate investigations. It enables automating execution of queries/commands for fetching all relevant information to an incident from different sources, thus avoiding the need to connect to different environments and debug from scratch. By allowing engineers to invoke the Playbook workflows based on conditions specified by them, Dr Droid makes the results of investigation readily available to developers in case of any incident, enabling them to debug issues faster.
This blog on Playbooks is a good reference - Spend 10x less time Debugging with Playbooks.
5. How Playbooks enabled Faster Debugging
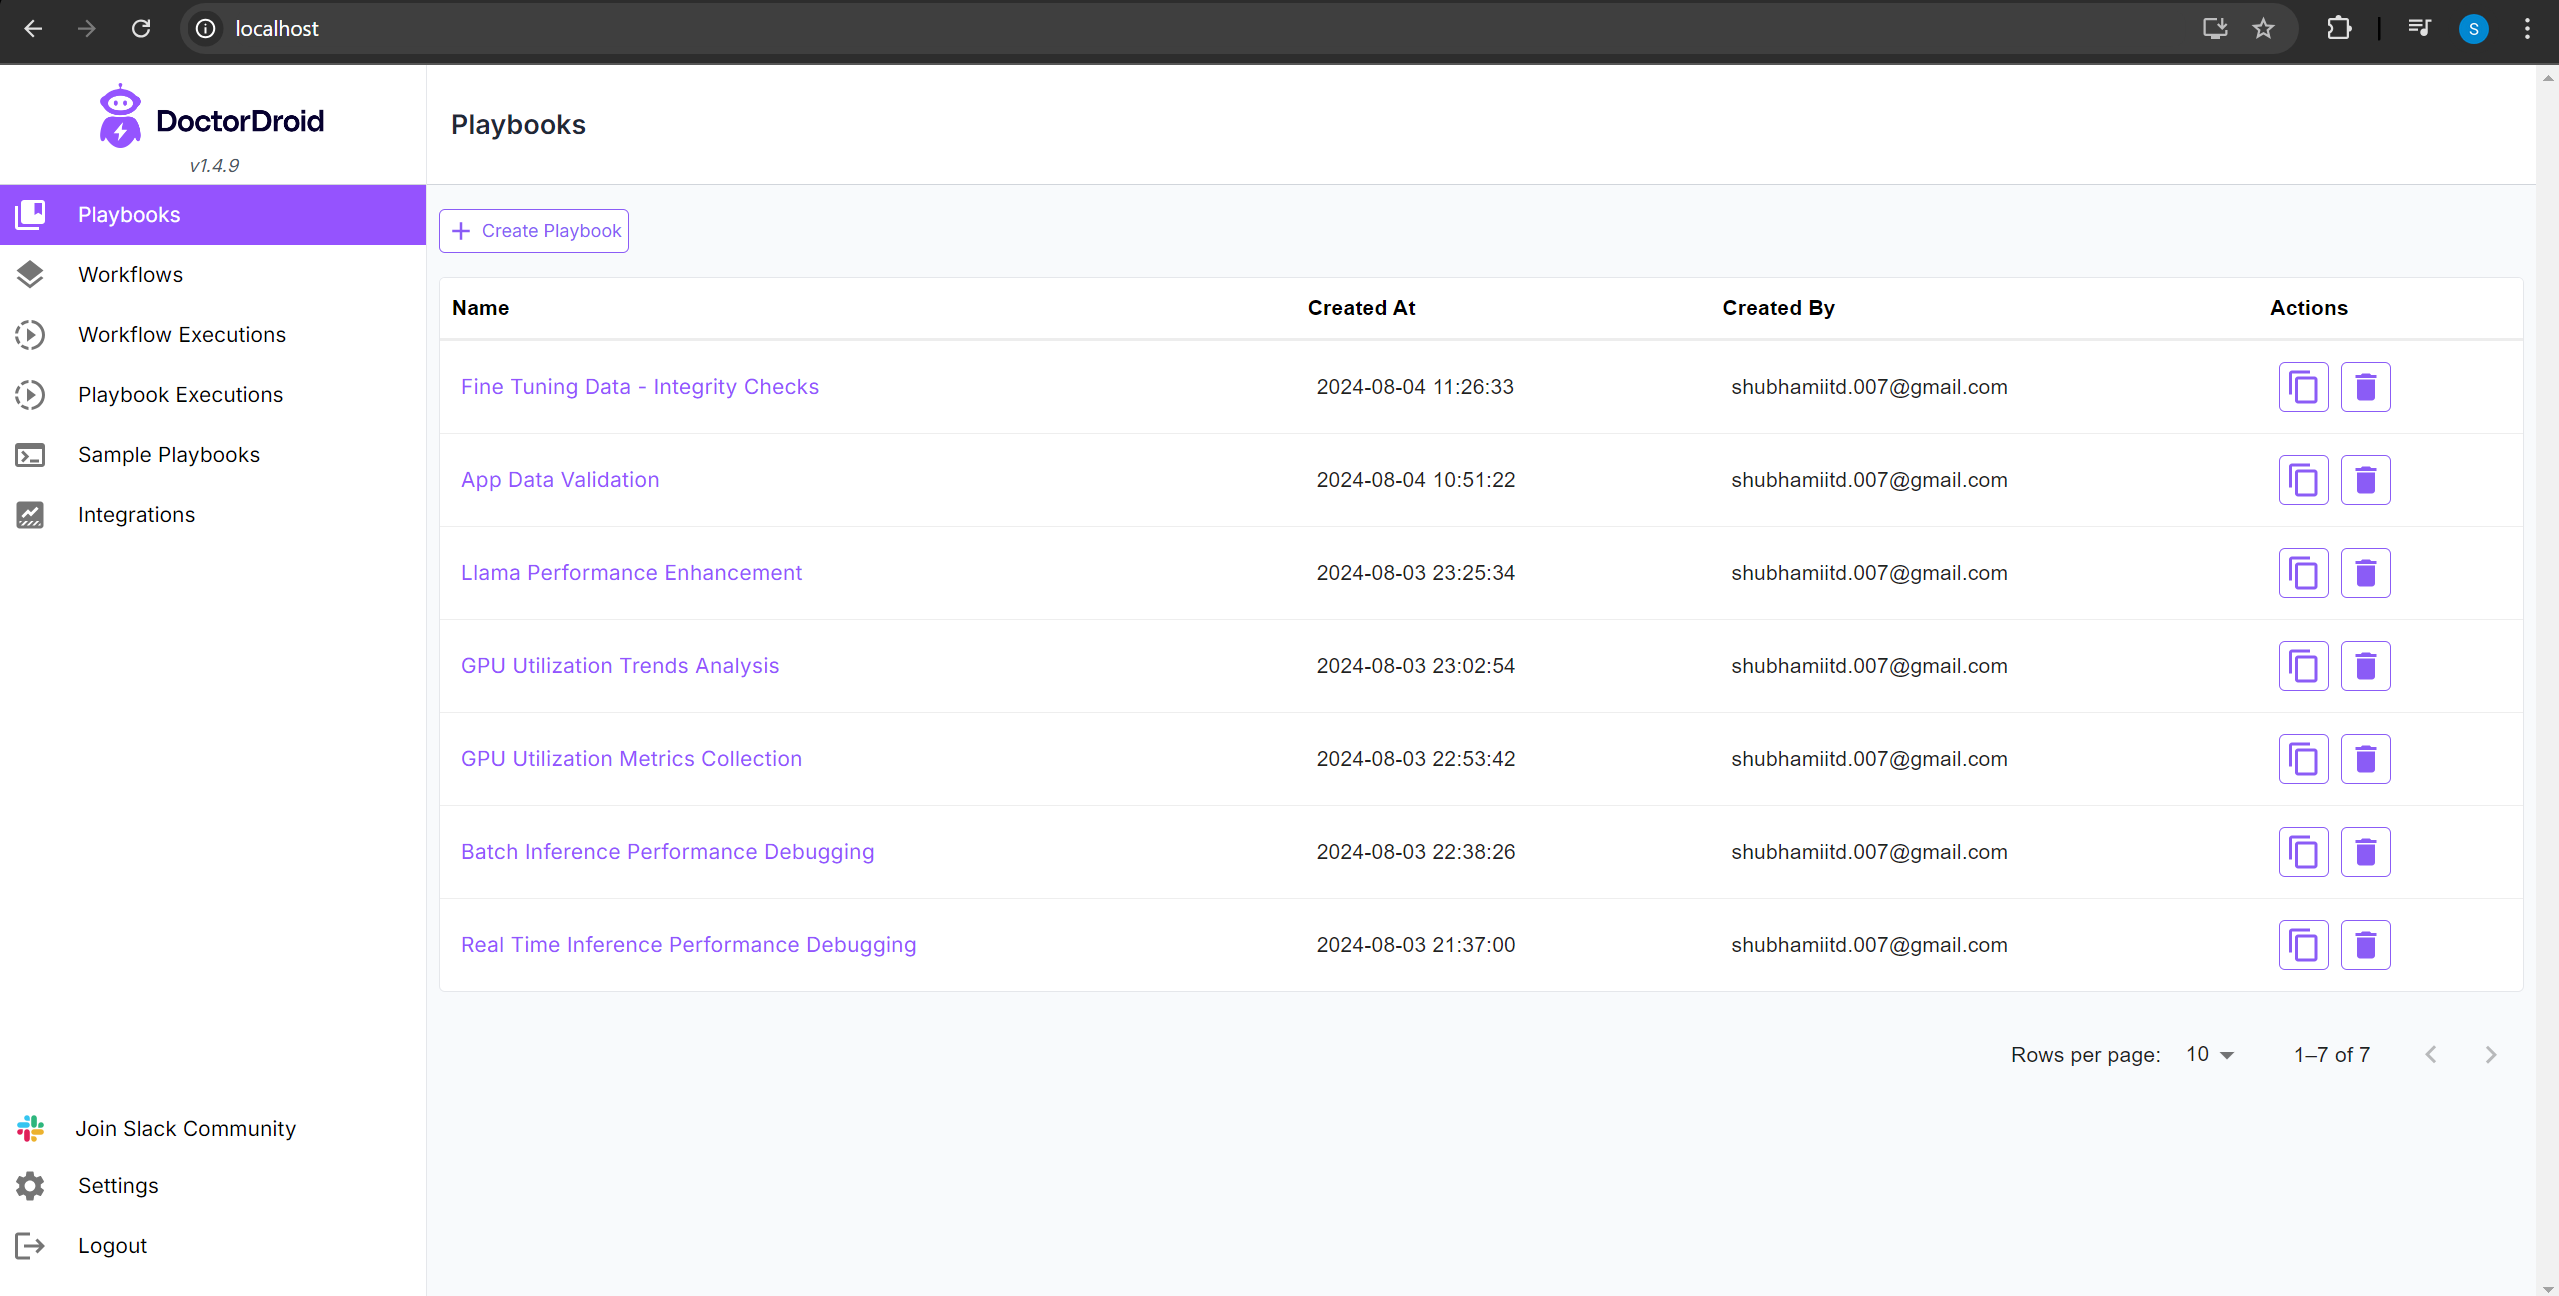
I created a handful of Playbooks for all my common issues.
Over time, as I started to debug issues, I kept saving frequently used queries in my scratch pad (Notepad++). These are for data integrity, sanity checks related to different scenarios for my use case, and commands I need to run to debug any GPU memory /space constraints on the servers. I used these queries (and some more new ones) while creating the Playbooks.
Also, since I had been facing issues with GPU memory utilization, I investigated the best practices for efficient handling of batch and real time requests and efficient utilization of all available GPUs, and documented them through Playbooks for the respective use cases, for enabling a quick reference when incidents occur.
Automated investigations in Slack
Playbooks have an option to be auto-triggered via API calls. I created workflows for invoking respective playbooks through that option.
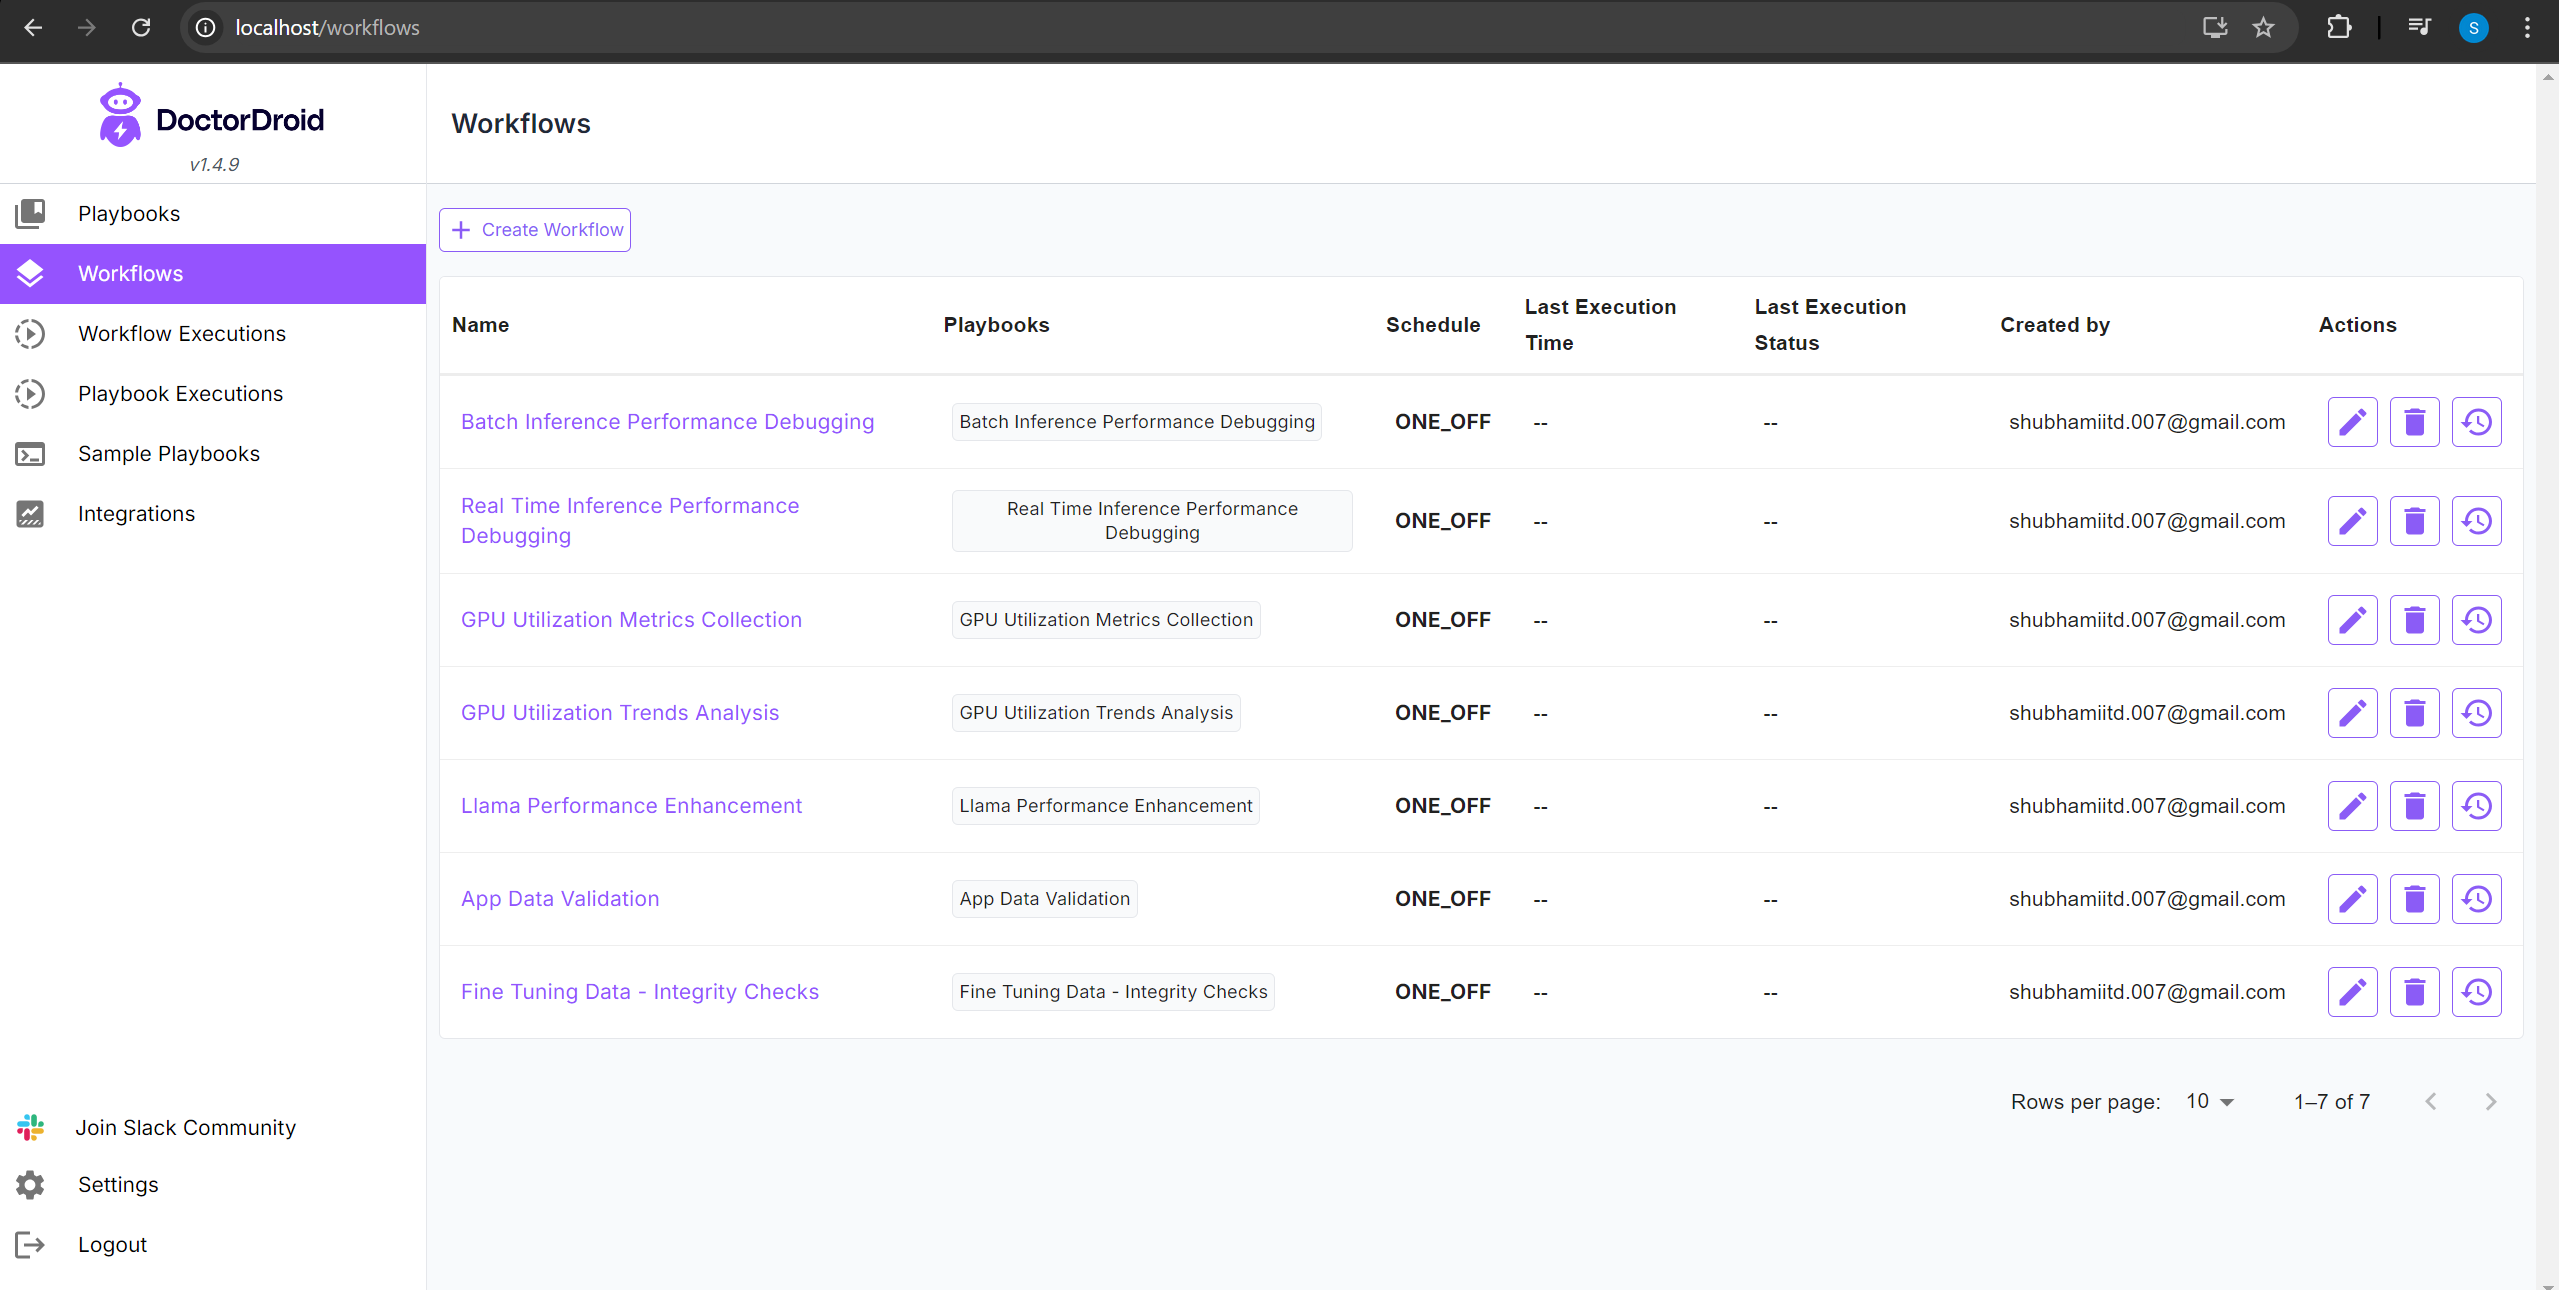
Finally, I updated my fine-tuned model validation code to invoke the workflows whenever the model output is found different from the desired output. Sharing screenshots below of Pipeline Execution Summary over Slack.
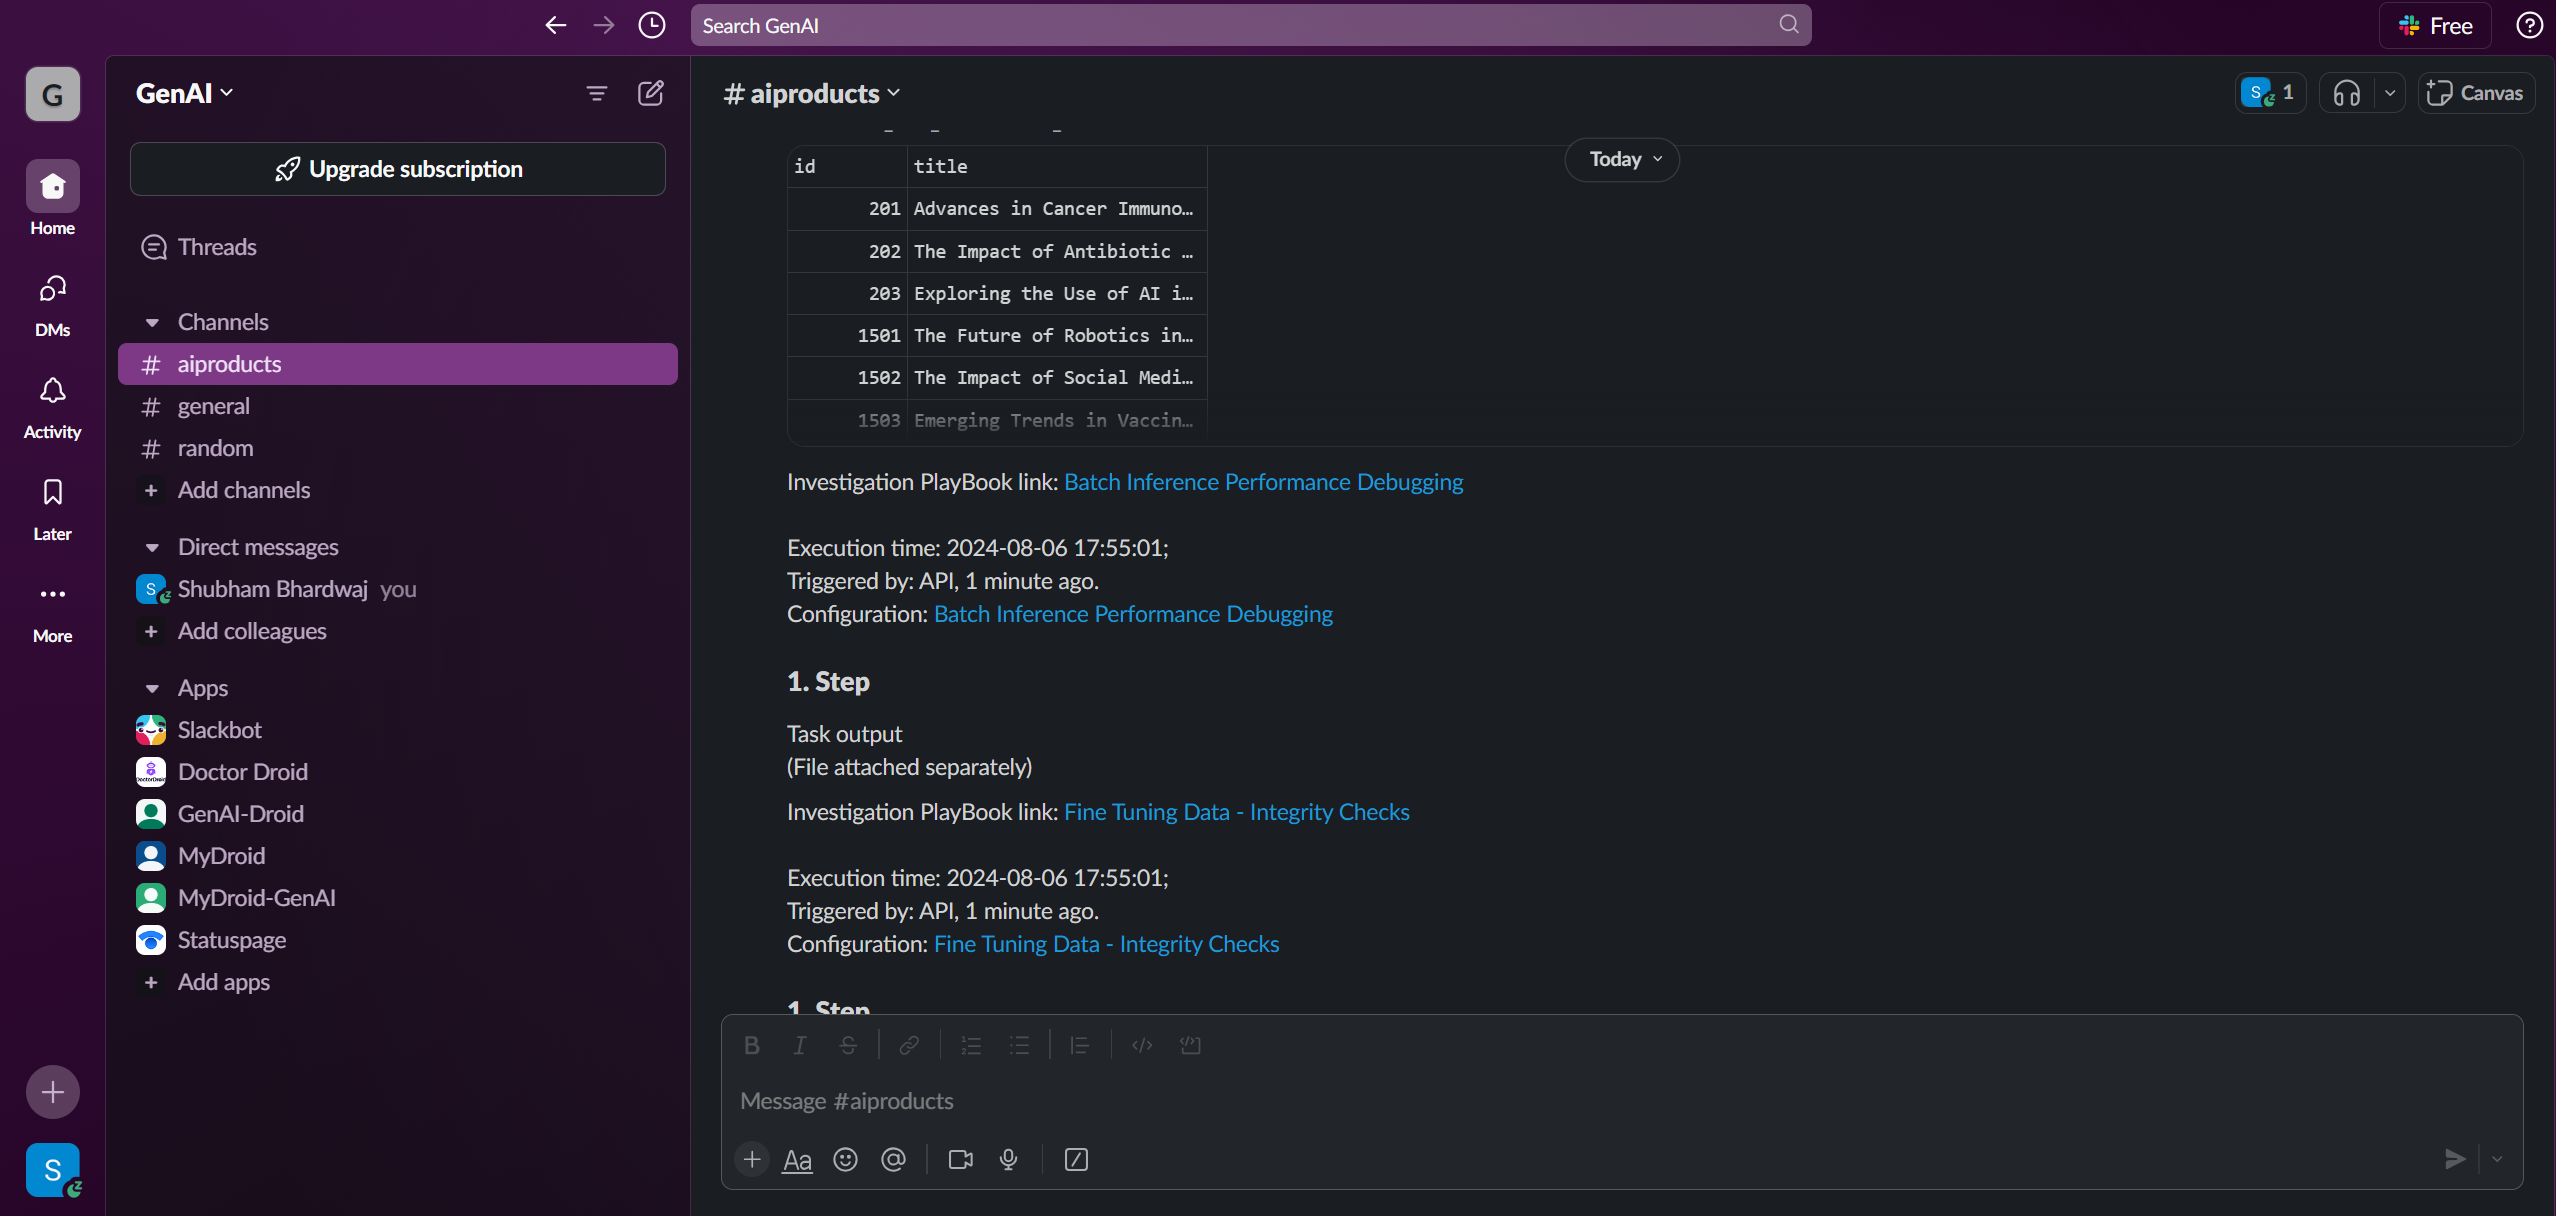
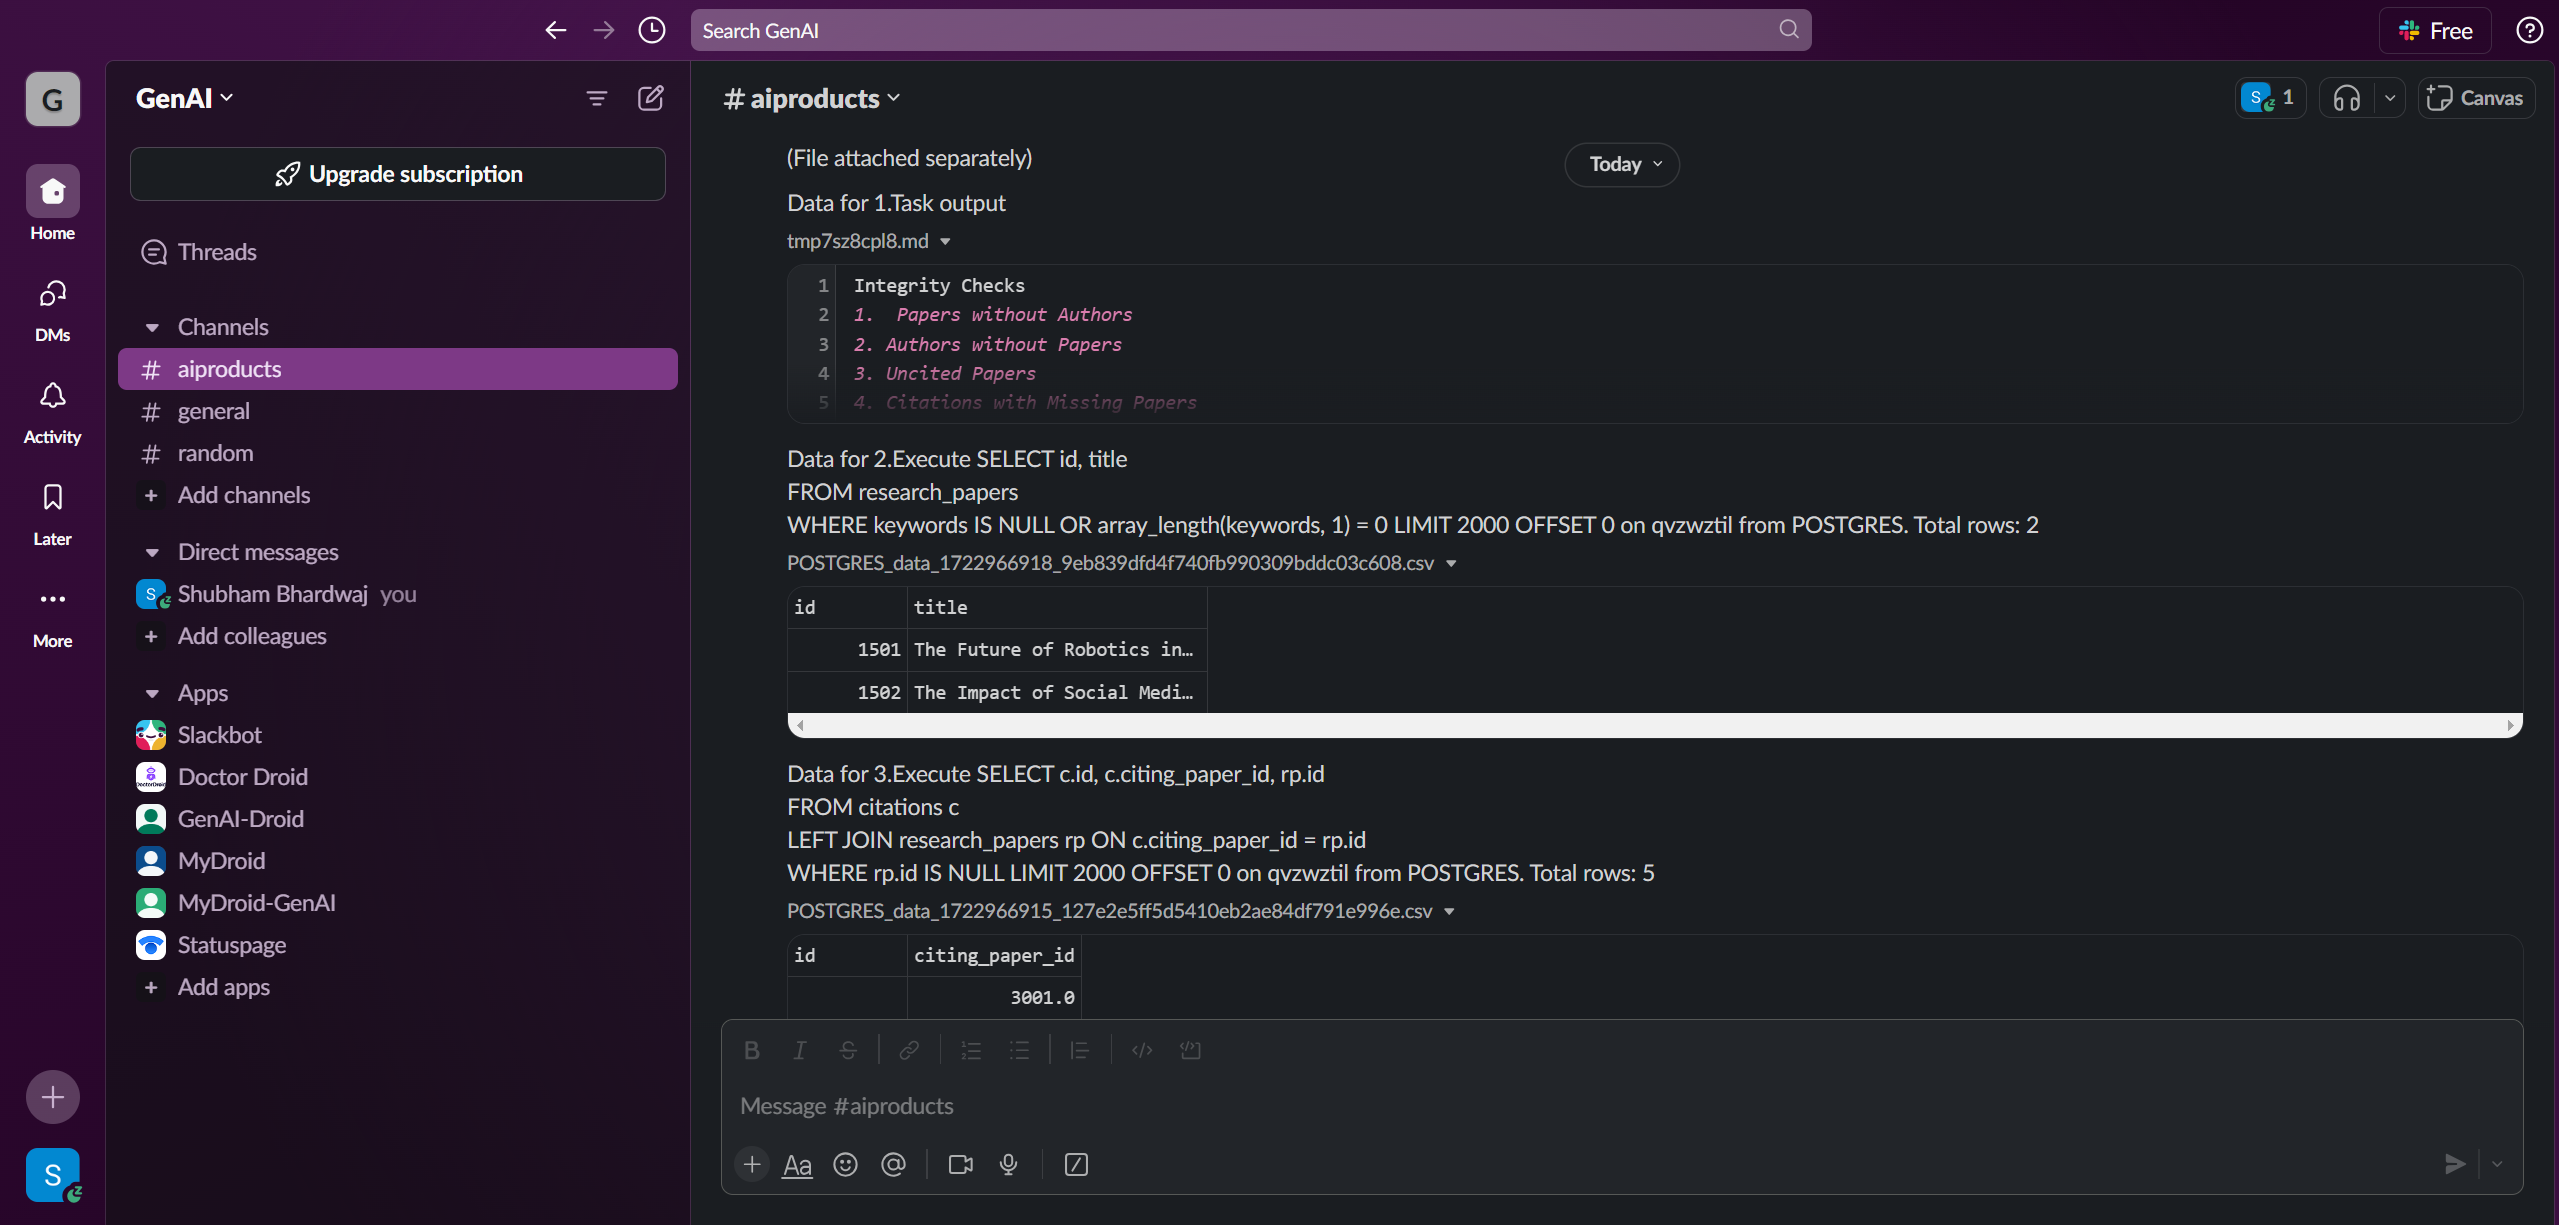
All data in a single view:
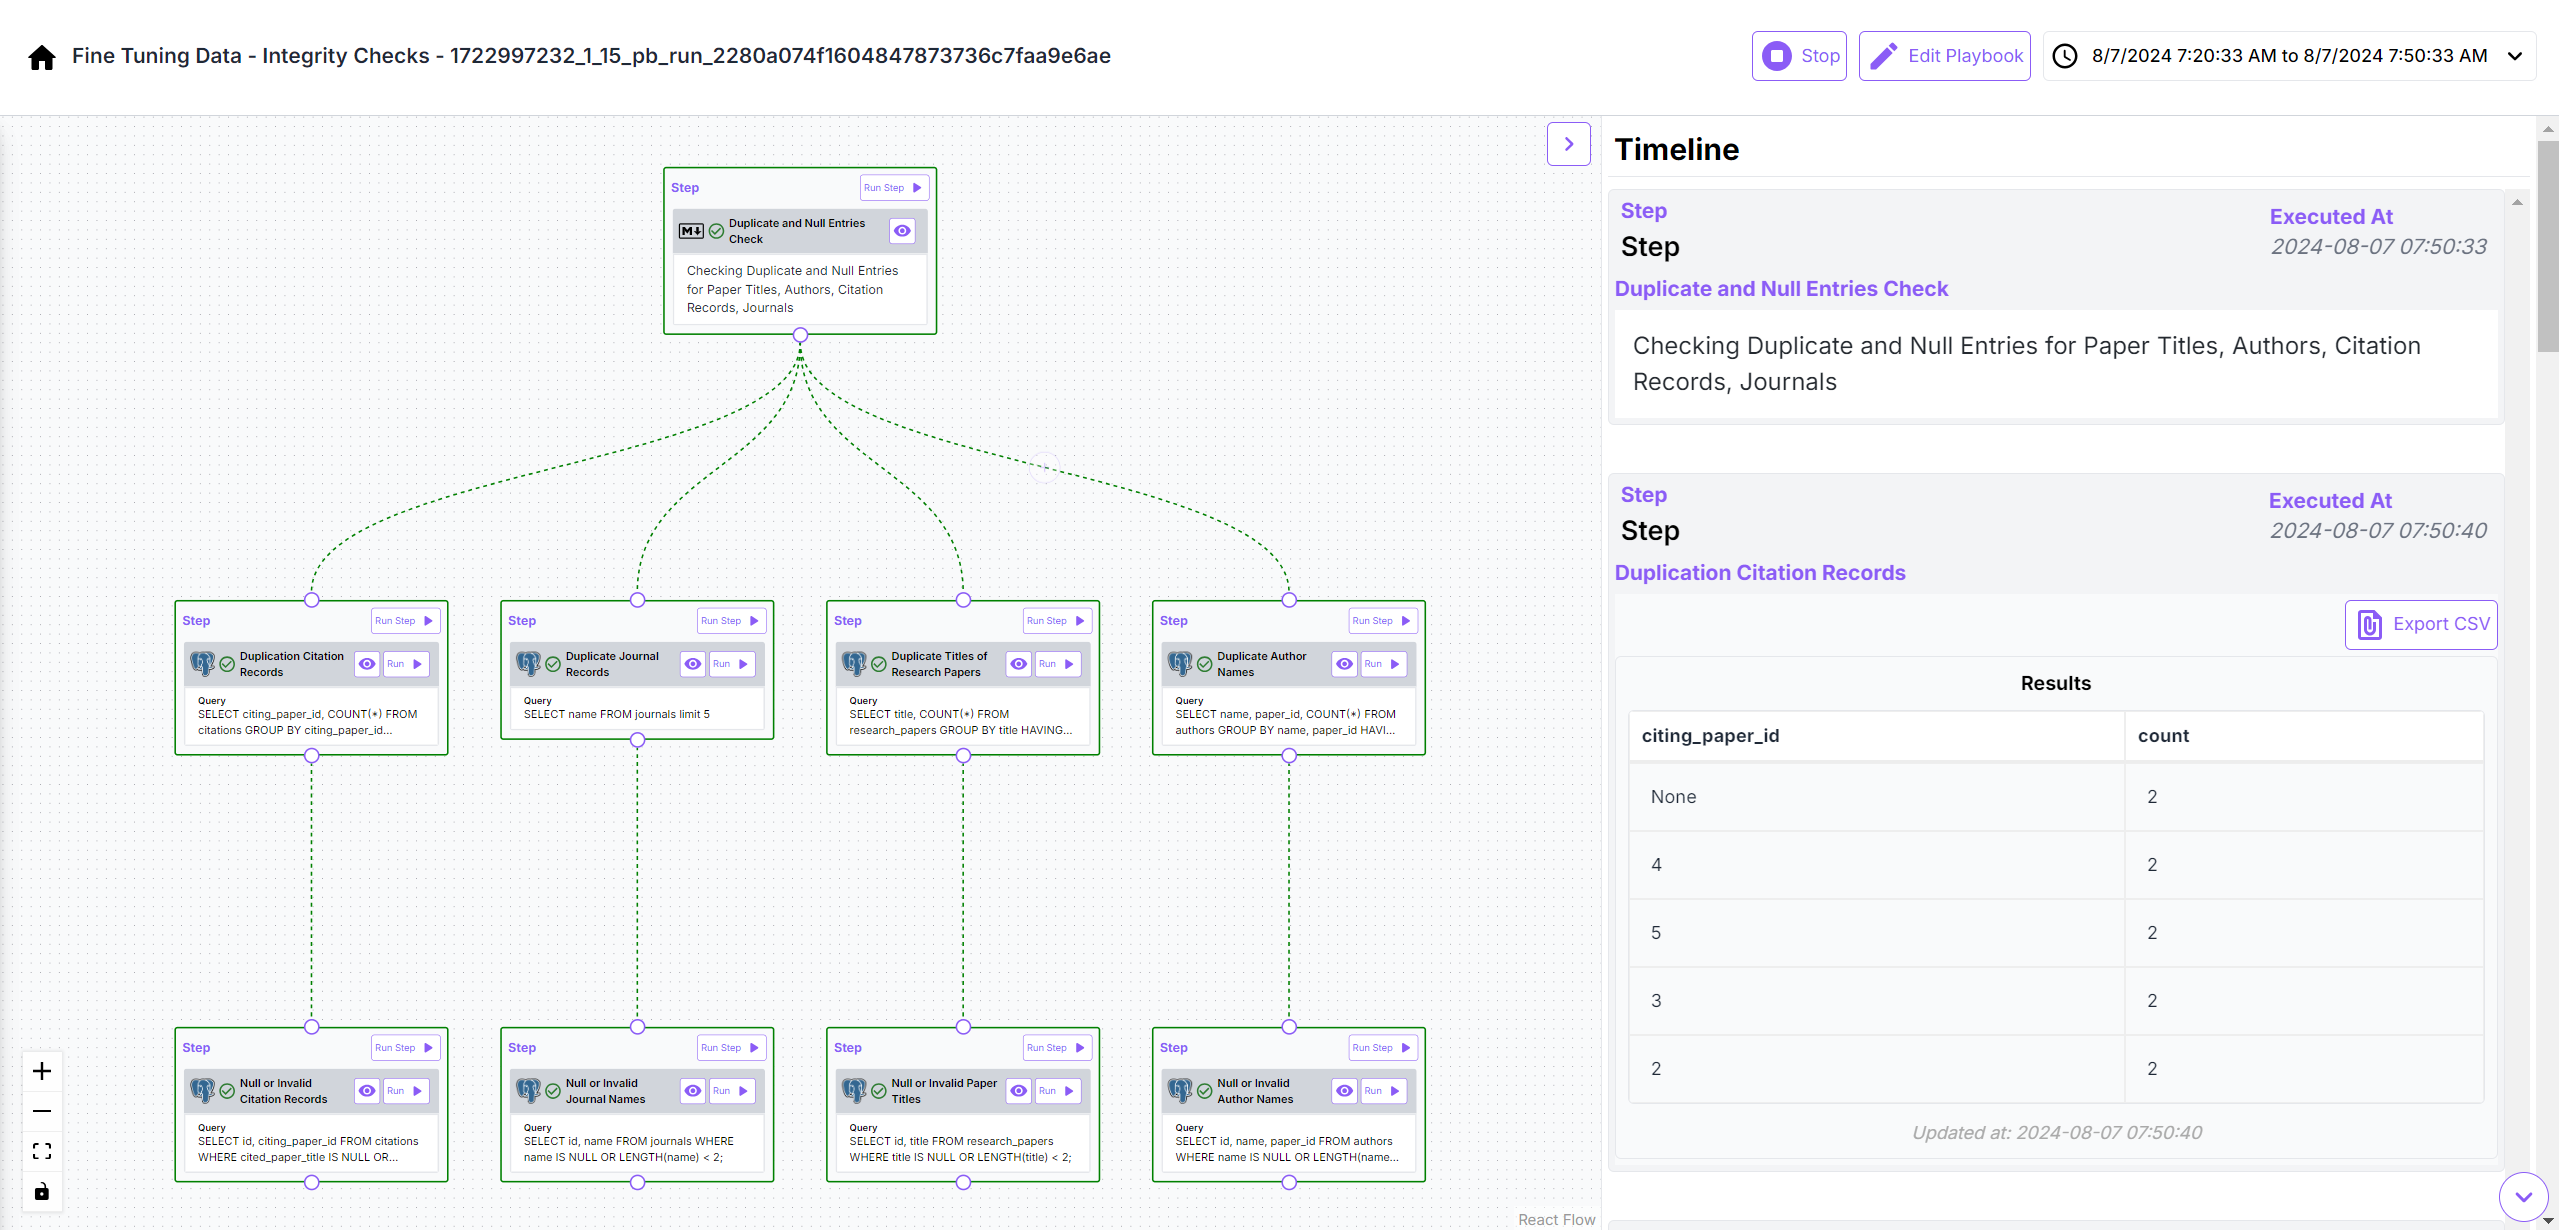
Sanity Checks for Fine Tuning related Data
Quickly, I observed that a lot of incorrect responses generated by the model were due to mistakes in records loaded in the database. Not only did some research papers were missing the desired attributes, but the ETL pipeline/LlaMa 3.1 -8B based agentic workflow was also not executing smoothly owing to GPU memory constraints arising out of inefficient handling of batch requests and poor GPU utilization. This insight helped me move ahead faster. Sharing some more of my playbooks below:
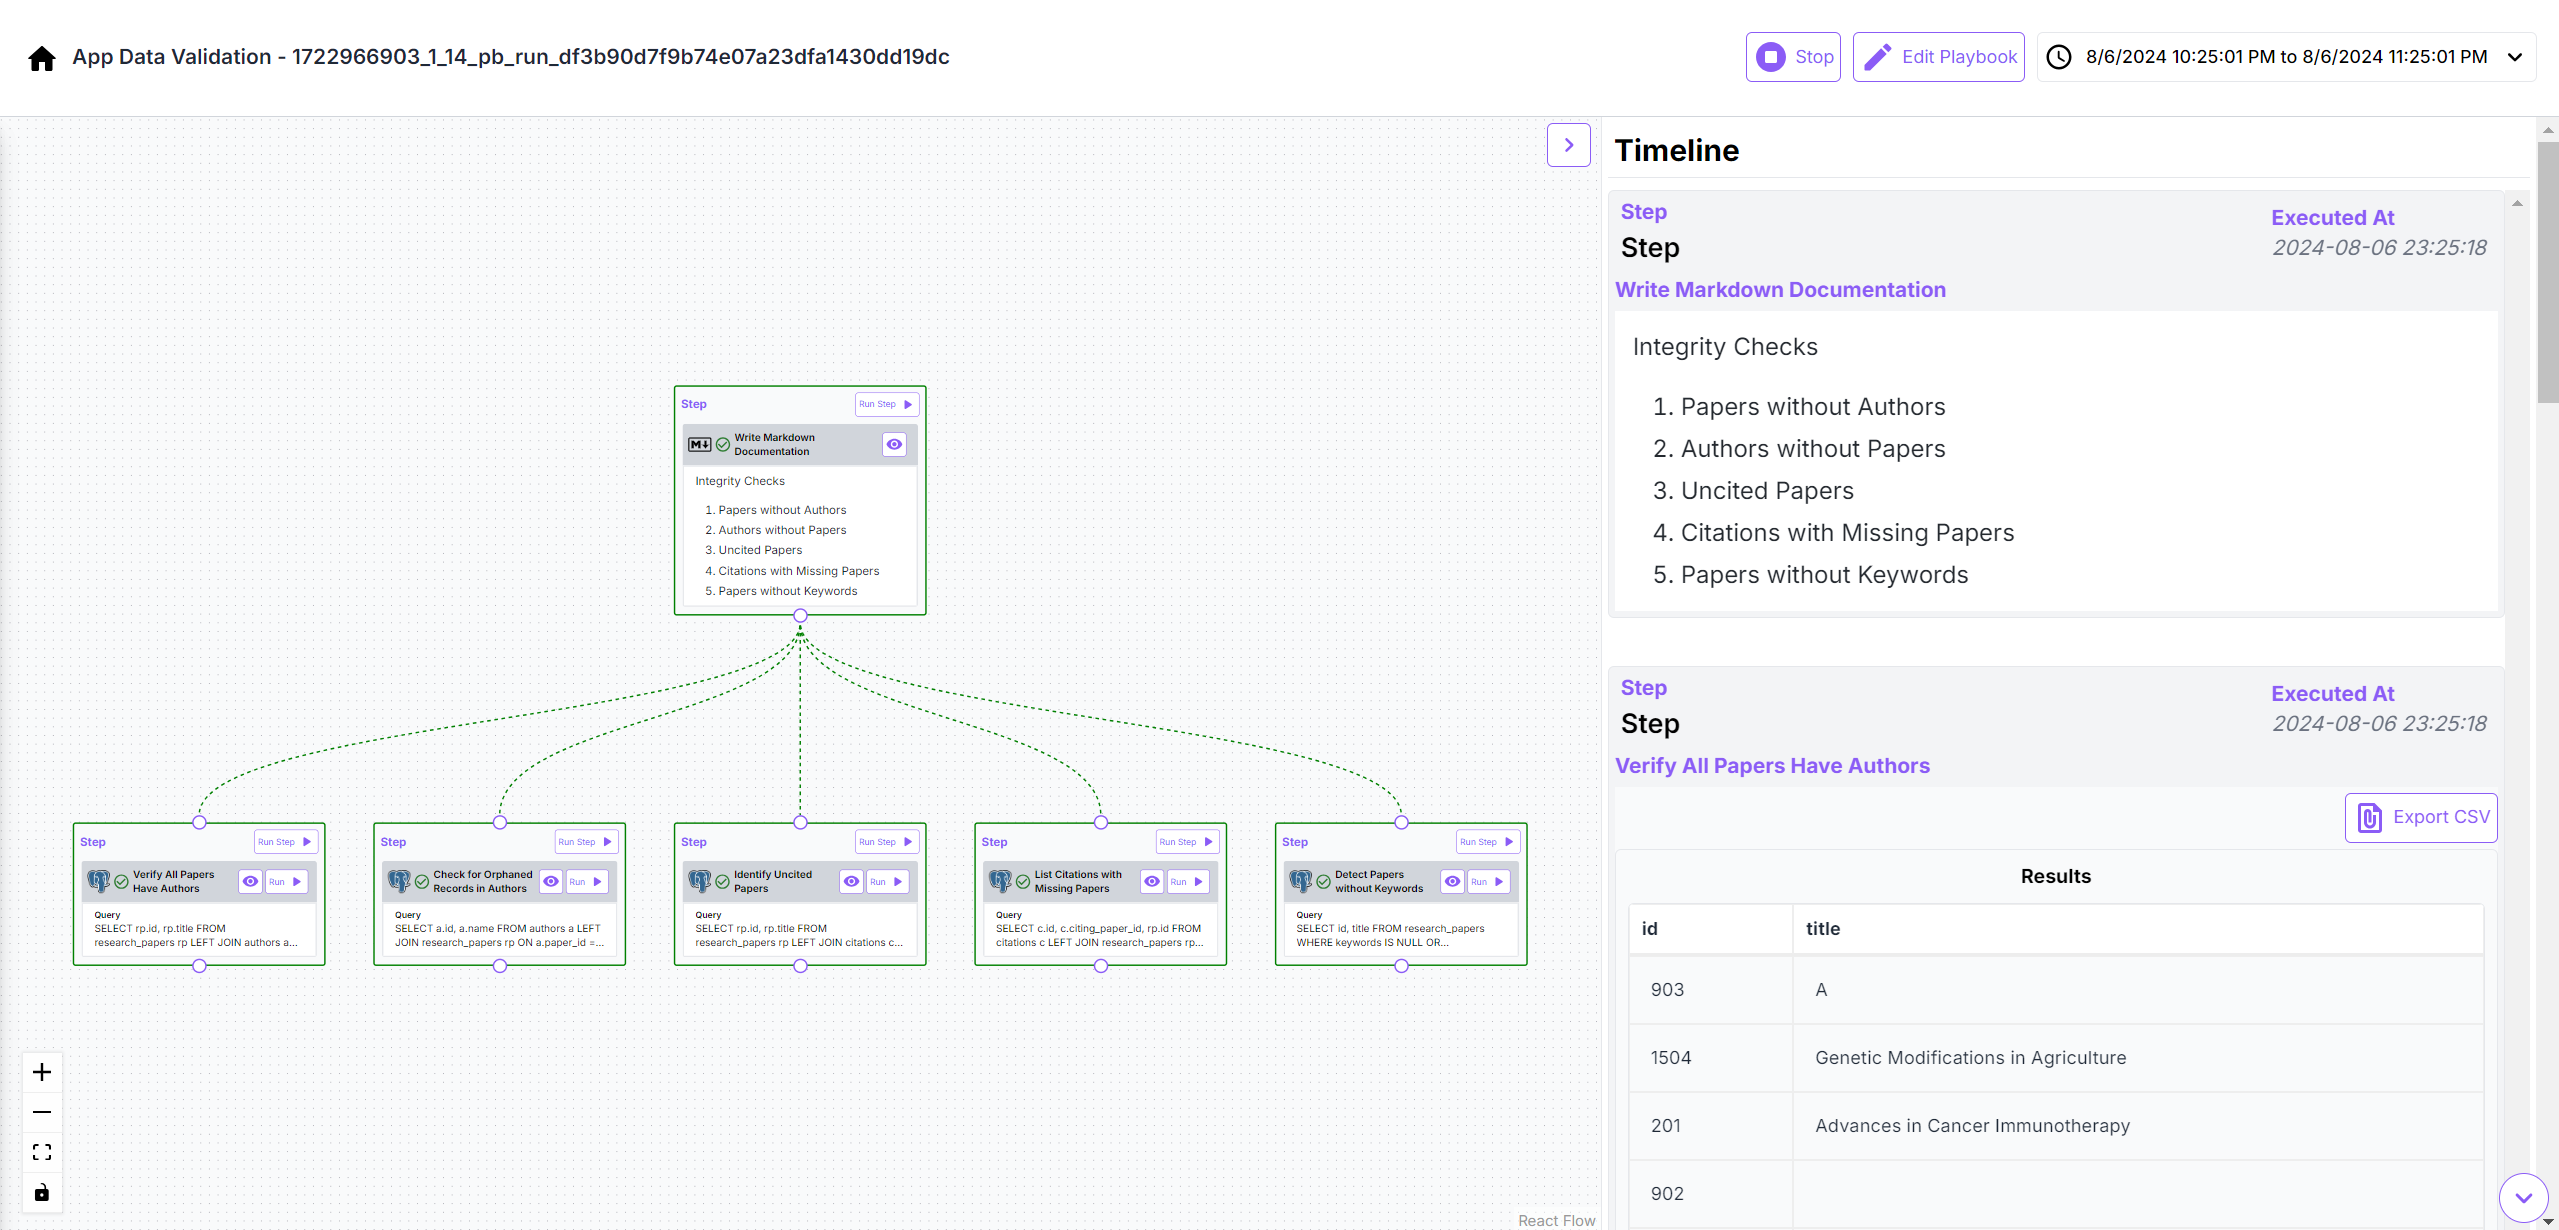
Integrity Checks for Records in Tables
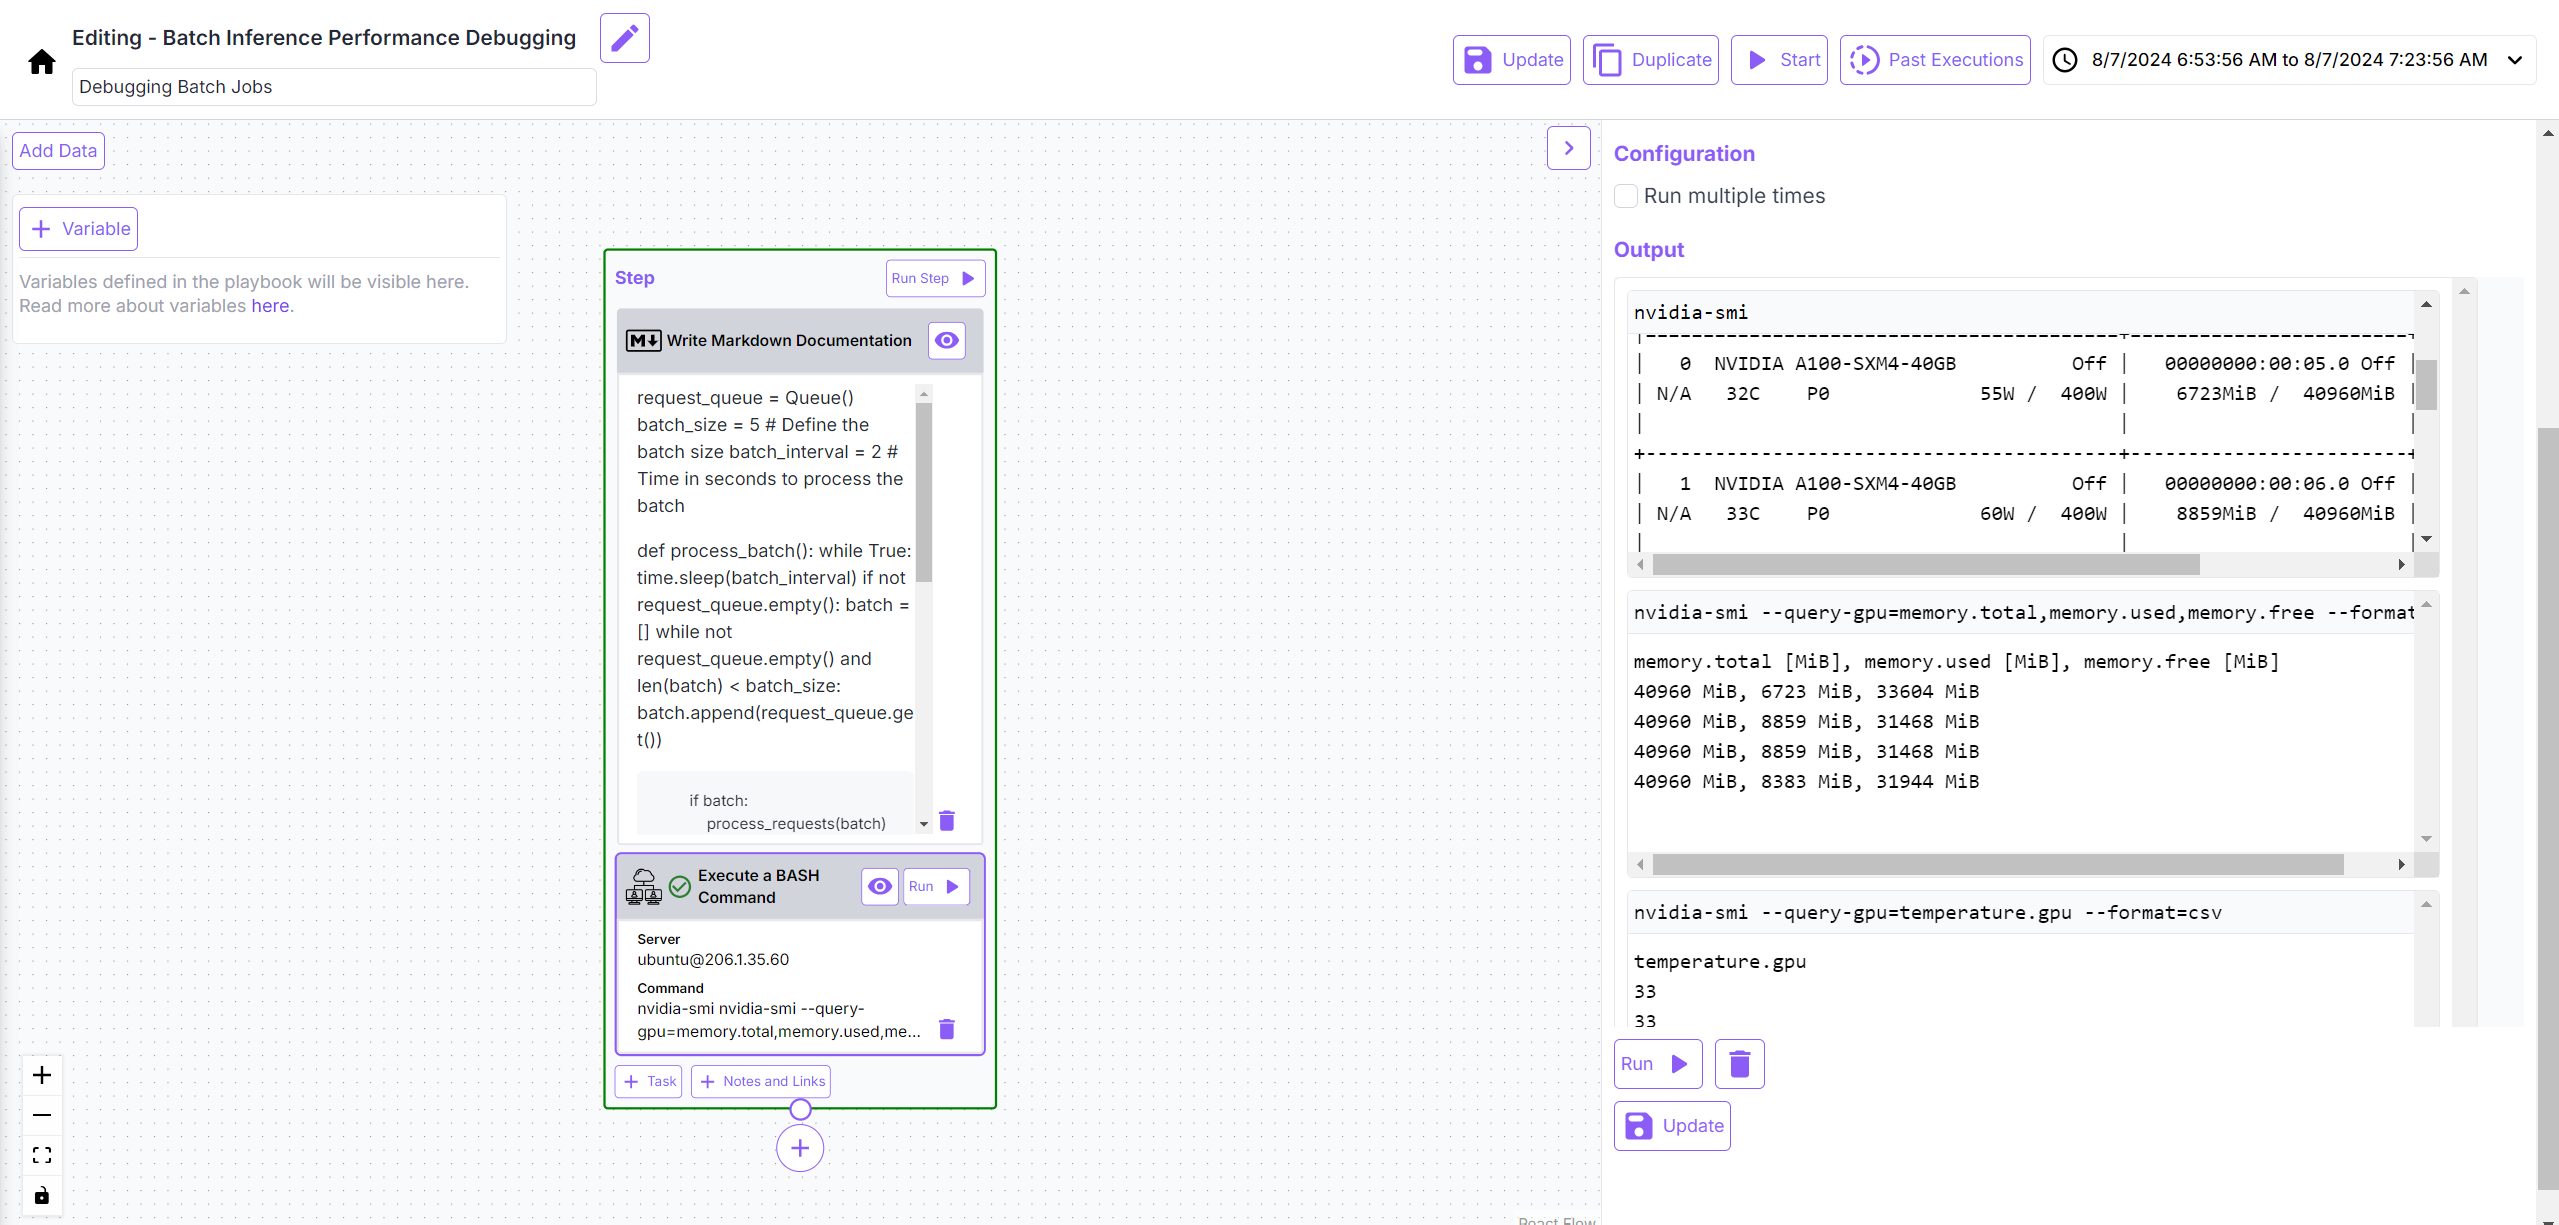
Investigating GPU Utilization Metrics
6. Production Deployment and Post-Deployment Monitoring
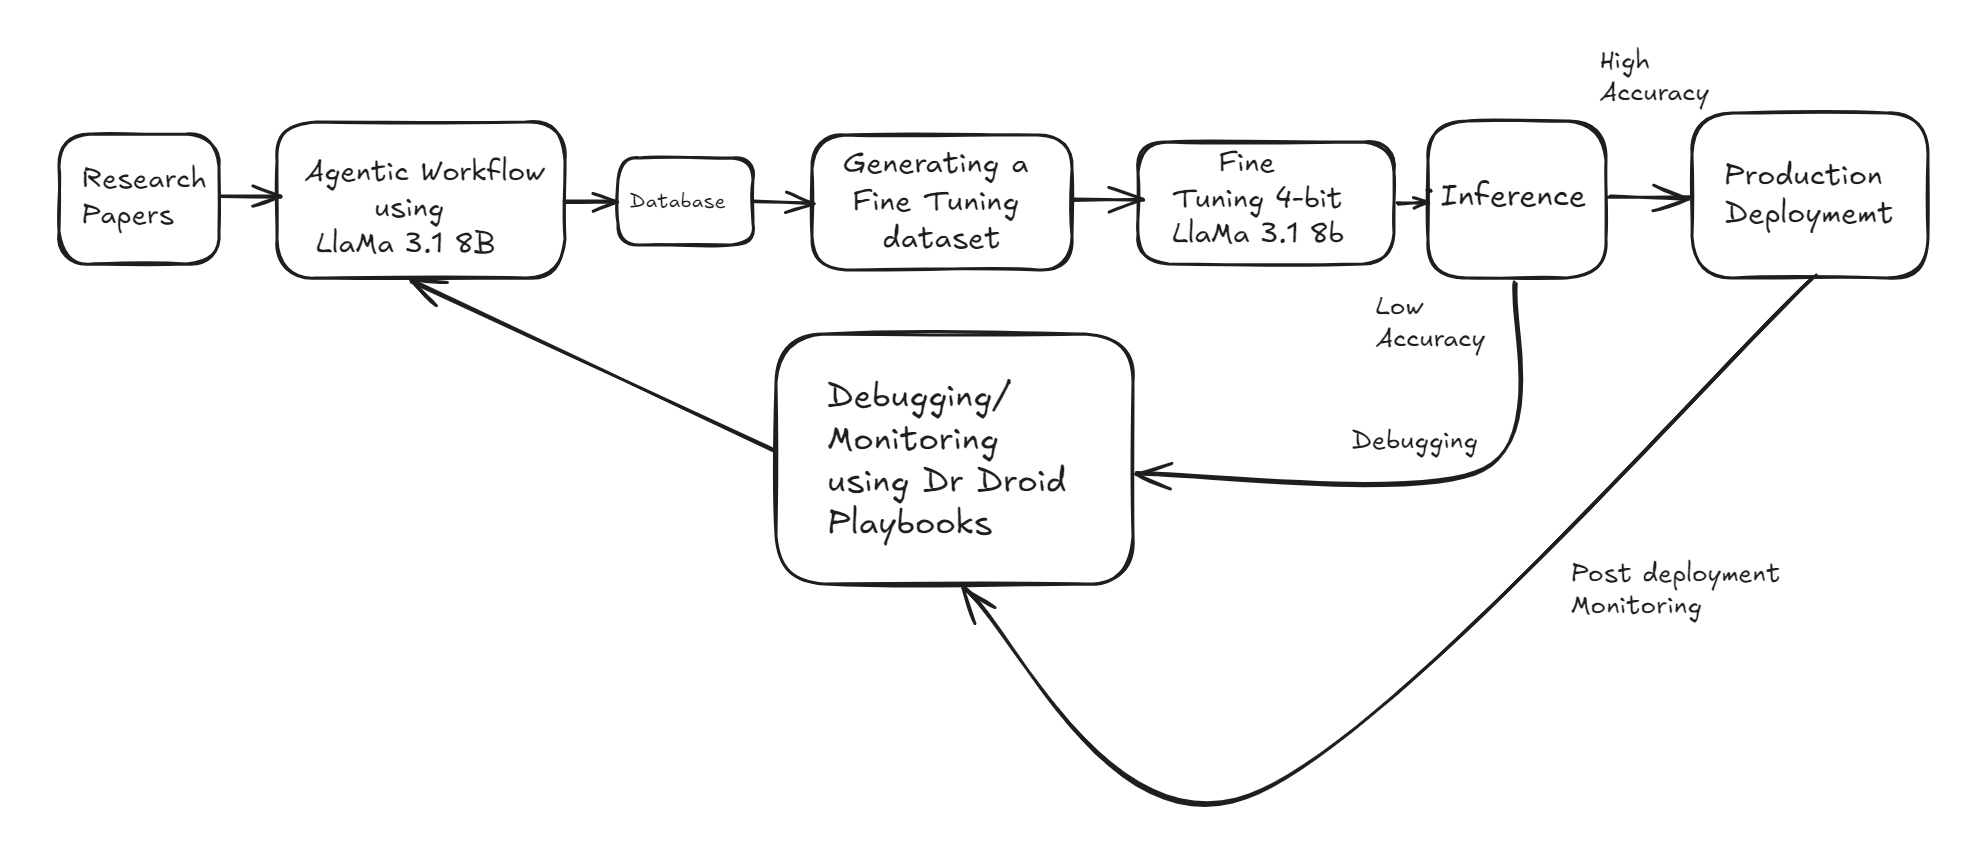
Having fixed the issues and incorporated the best practices in my code, I created another dataset for fine tuning, fine tuned the 4-bit quantized Llama 8.1 8B afresh and re-ran quality checks.
Since accuracy was found to be reasonable for production usage, I deployed the model in production. However, I wanted to make sure that I am able to debug all issues with the deployed model going forward. Therefore, I created another workflow for post-deployment monitoring, by utilizing the cron-scheduler option provided.
I now have two ways to know if anything is wrong:
Through the recurring reports in my Slack
Directly through playbooks UI whenever I notice an issue
Even since the model has been in production, this has ensured availability of metrics on a regular basis.
If you are interested in faster debugging for your use case and are looking to use Playbooks for the same, kindly refer to the Tutorials on Dr Droid YouTube or install from Github.
Subscribe to my newsletter
Read articles from Shubham Bhardwaj directly inside your inbox. Subscribe to the newsletter, and don't miss out.
Written by
