Kubeshark + Amazon EKS: The Dream Team for API Traffic Analysis
 Mahira Technology Private Limited

Overview :-
Kubeshark and Amazon EKS make a great combination for analyzing API traffic in Kubernetes environments. This powerful duo allows developers and operations teams to gain deep insights into their API communications, helping to troubleshoot issues, optimize performance, and enhance security. In this post, we’ll explore how to set up and use Kubeshark with Amazon EKS using Helm, a popular package manager for Kubernetes.
Prerequisites :-
Before we dive into the setup process, make sure you have the following:
1. An active Amazon EKS cluster
2. Helm installed on your local machine
3. kubectl configured to communicate with your EKS cluster
4. Basic familiarity with Kubernetes concepts
\> Tip: If you’re new to Amazon EKS, consider reviewing the official documentation to get started.
Procedure :-
Let’s walk through the steps to deploy Kubeshark on your Amazon EKS cluster using Helm.
Step 1: Add the Kubeshark Helm repository
First, we need to add the Kubeshark Helm repository to our local Helm installation. Open your terminal and run:
helm repo add kubeshark https://helm.kubeshark.co
helm repo update
Step 2: Install Kubeshark
Now that we have the repository added, we can install Kubeshark in our EKS cluster. Run the following command:
helm install kubeshark kubeshark/kubeshark
This command will deploy Kubeshark with default settings. If you need to customize the installation, you can use a values file or set values directly in the command line.
Step 3: Access the Kubeshark dashboard
After the installation is complete, you can access the Kubeshark dashboard. By default, Kubeshark creates a ClusterIP service. To access it, you’ll need to set up port forwarding:
#Now you can open your web browser and navigate to `http://localhost:8080` to access the Kubeshark dashboard.
kubectl port-forward service/kubeshark-front 8899:80
Step 4: Start capturing API traffic
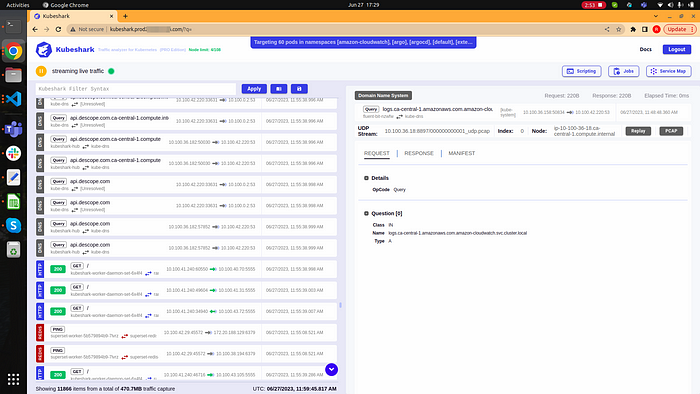
With Kubeshark running, you can start capturing API traffic in your cluster. Use the dashboard to select the namespaces, pods, or services you want to monitor. Kubeshark will begin collecting and analyzing the API traffic in real-time.
Step 5: Analyze the captured data
Kubeshark provides various features for analyzing the captured API traffic:
+ Filter and search capabilities to find specific requests or responses
+ Detailed information about each API call, including headers, body, and timing
+ Visualizations to help understand traffic patterns and identify anomalies
Take some time to explore these features and see how they can help you gain insights into your API communications.

Conclusion :-
Combining Kubeshark with Amazon EKS using Helm creates a robust solution for API traffic analysis in Kubernetes environments. This setup allows teams to:
Quickly identify and troubleshoot API-related issues
Optimize API performance by spotting bottlenecks
* Enhance security by monitoring for suspicious API activity
By following the steps outlined in this guide, you can easily set up this powerful tool combination and start gaining valuable insights into your API traffic. Remember to regularly update Kubeshark and review its captured data to make the most of this solution in your EKS environment.
Subscribe to my newsletter
Read articles from Mahira Technology Private Limited directly inside your inbox. Subscribe to the newsletter, and don't miss out.
Written by

Mahira Technology Private Limited
Mahira Technology Private Limited
A leading tech consulting firm specializing in innovative solutions. Experts in cloud, DevOps, automation, data analytics & more. Trusted technology partner.