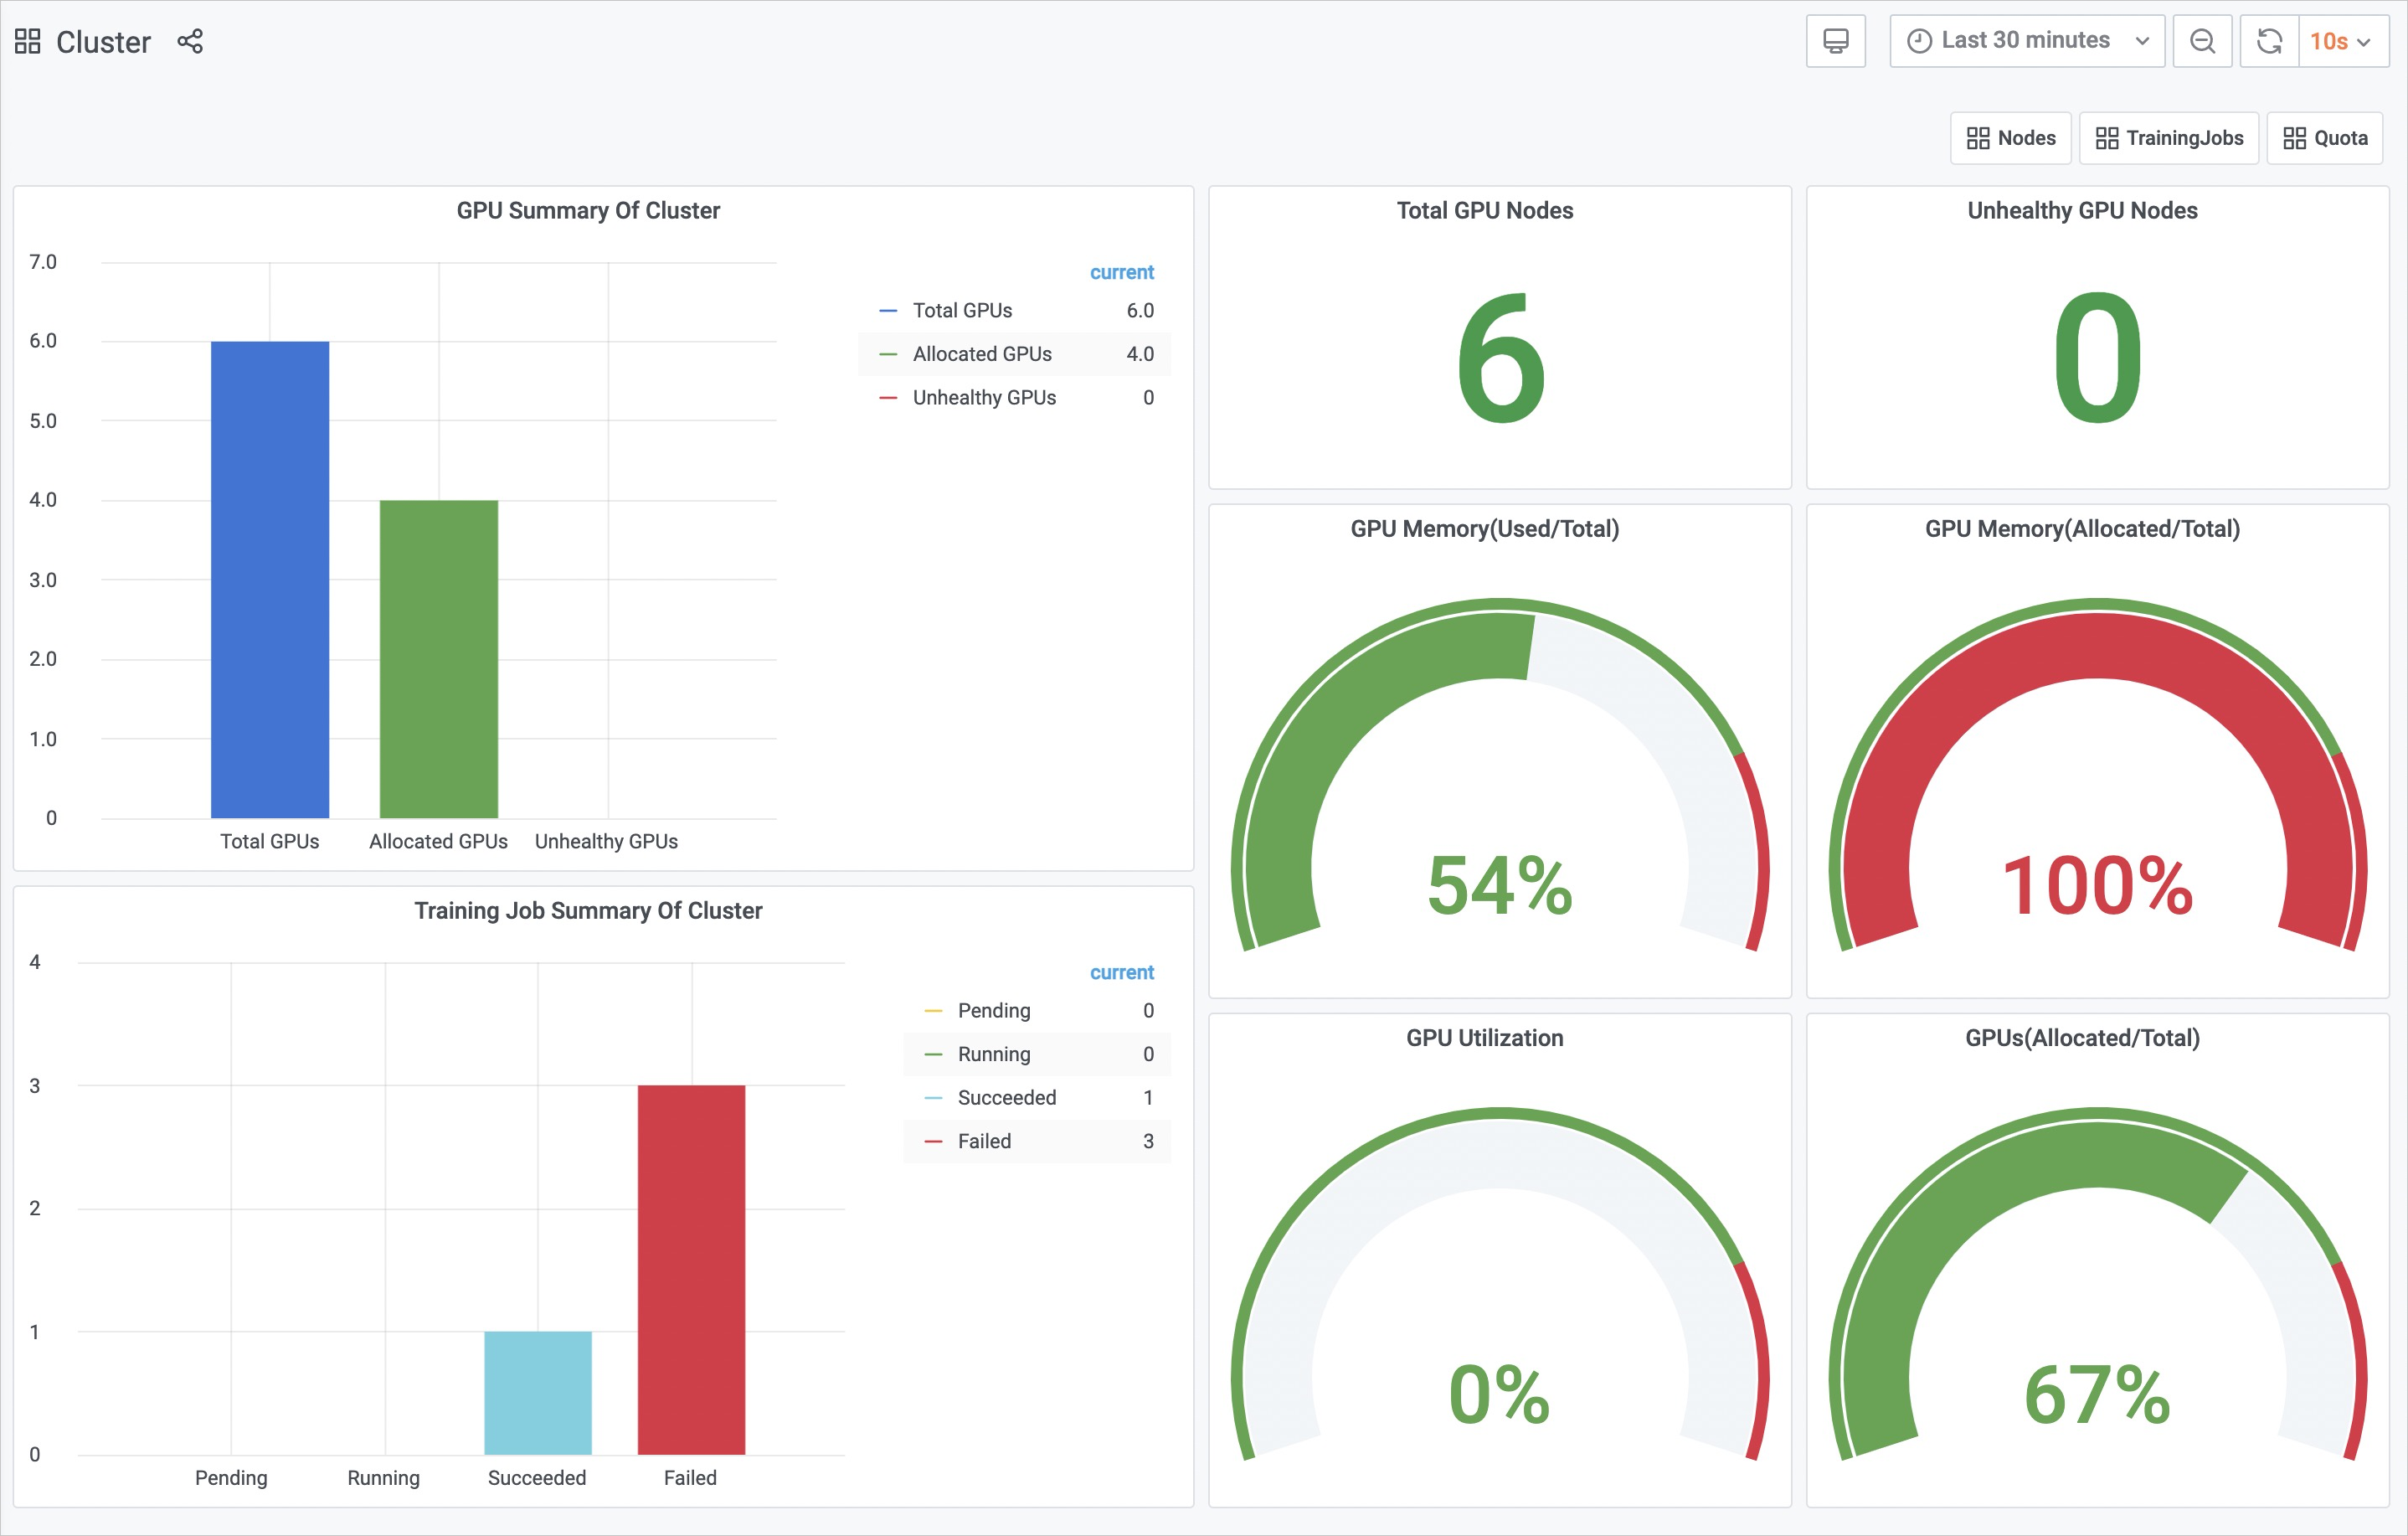
Building a Performance Dashboard for Cloud-Native Applications: Insights and Implementation
 Sumangal Chhetri
Introduction
In the dynamic world of cloud-native applications, performance monitoring and optimization are critical to ensure smooth and efficient operations. With the complexity and scalability of cloud-native environments, having a robust performance dashboard is essential for tracking metrics, identifying issues, and making data-driven decisions. In this blog, we will delve into the creation and features of a performance dashboard specifically designed for cloud-native applications, as showcased in the GitHub repository
Why a Performance Dashboard?
Cloud-native applications are inherently complex, comprising multiple microservices, containers, and orchestration platforms like Kubernetes. Monitoring and managing performance across such a distributed system can be challenging. A performance dashboard offers a centralized view of key metrics, enabling:
Real-time Monitoring:
- Visualize performance metrics in real-time to quickly identify and address issues.
Historical Analysis:
- Track historical performance data to analyze trends and plan for future optimizations.
Alerting and Notifications:
- Set up alerts for specific thresholds or anomalies to proactively manage performance issues.
Capacity Planning:
- Use performance data to forecast future needs and optimize resource allocation.
Key Features of the Performance Dashboard
The Performance Dashboard for Cloud-Native Applications, as implemented in the repository, includes several key features:
Comprehensive Metrics Collection:
- Collects a wide range of metrics from various sources such as application logs, container metrics, and infrastructure performance data. This includes CPU usage, memory consumption, response times, and error rates.
Interactive Visualizations:
- Provides interactive charts and graphs that allow users to explore performance data, filter metrics, and zoom in on specific time periods. This helps in gaining deeper insights into application behavior.
Customizable Dashboards:
- Users can customize their dashboard views to focus on the most relevant metrics for their specific needs. This feature allows for personalized monitoring setups tailored to different stakeholders or use cases.
Alerting System:
- An alerting system that triggers notifications based on predefined thresholds or anomalous patterns in the performance data. Alerts can be configured to integrate with communication tools like email, Slack, or PagerDuty.
Integration with Cloud-Native Tools:
- Seamless integration with popular cloud-native tools and platforms such as Prometheus, Grafana, and Kubernetes. This enables easy data ingestion and visualization from existing monitoring setups.
Historical Data Analysis:
- The dashboard supports historical data analysis, allowing users to compare current performance with past data and identify trends or recurring issues.
Implementation Overview
The implementation of the Performance Dashboard involves several components:
Data Collection:
- Utilizes agents or exporters to collect metrics from cloud-native applications, containers, and infrastructure components. This data is then ingested into a monitoring system like Prometheus.
Visualization:
- Employs visualization tools such as Grafana to create interactive and customizable dashboards. Grafana’s powerful querying capabilities are leveraged to display performance metrics in a user-friendly manner.
Alerting:
- Configures alerting rules within the monitoring system to trigger notifications based on specific conditions. These alerts are integrated with communication channels to ensure timely responses.
User Interface:
- Develops a user interface that allows users to interact with the dashboard, configure views, and set up alerts. The UI is designed to be intuitive and accessible for users with varying levels of expertise.
Example Usage
To get started with the Performance Dashboard for Cloud-Native Applications, you can follow the setup instructions provided in the GitHub repository. The repository includes:
Installation Guides:
- Step-by-step instructions for setting up the dashboard and integrating it with your cloud-native environment.
Configuration Files:
- Sample configuration files for data collection, visualization, and alerting.
Usage Documentation:
- Detailed documentation on how to use the dashboard, customize views, and configure alerts.
Conclusion
A performance dashboard is an invaluable tool for managing cloud-native applications, providing a comprehensive view of performance metrics and enabling proactive management. The Performance Dashboard for Cloud-Native Applications, as detailed in the GitHub repository, offers a robust solution for monitoring and optimizing application performance in complex cloud environments. By leveraging this dashboard, organizations can ensure their applications run smoothly and efficiently, ultimately enhancing user experience and operational effectiveness.
Explore the repository to see how you can implement this dashboard in your own cloud-native setups and take your performance monitoring to the next level.
Subscribe to my newsletter
Read articles from Sumangal Chhetri directly inside your inbox. Subscribe to the newsletter, and don't miss out.
Written by
