Detailed Article on User Engagement and Quality of Service (QoS) in Video Streaming
 ritiksharmaaa
Introduction
In the competitive world of video streaming, success is measured not just by the number of users but by how effectively a service engages its audience and delivers high-quality content. Two critical pillars that support this are User Engagement and Quality of Service (QoS). Understanding and optimizing these metrics are essential for creating a successful video streaming platform. In this article, we'll explore how these metrics can be tracked, analyzed, and improved, along with the coding flows and tools used in the industry.
1. User Engagement Metrics
1.1 Watch Time
Definition: Watch time is the total amount of time users spend watching videos on your platform. It is a crucial metric that reflects user interest and content quality.

Implementation:
Tracking Watch Time: Implement event listeners to track when a video starts and stops. This can be done using JavaScript for web applications or native event listeners in mobile apps.
Data Storage: Store this data in a database like MongoDB or MySQL, where each entry includes the user ID, video ID, start time, and end time.

Analysis: Calculate total watch time per user or video by aggregating the data. This can be done using SQL queries or map-reduce operations in MongoDB.
// Example: JavaScript for tracking watch time in a web app
let video = document.getElementById('videoPlayer');
let watchStartTime;

video.addEventListener('play', () => {
    watchStartTime = new Date();
});

video.addEventListener('pause', () => {
    let watchEndTime = new Date();
    let watchDuration = (watchEndTime - watchStartTime) / 1000; // in seconds
    // Send this data to your server
    sendWatchData(video.id, watchDuration);
});
1.2 Viewer Retention
Definition: Viewer retention measures how well your videos keep users engaged over time, usually represented as a percentage of users who continue watching after a certain point.

Implementation:
Tracking Viewer Retention: This involves capturing data at regular intervals during video playback (e.g., every 10 seconds) to see how many users are still watching.
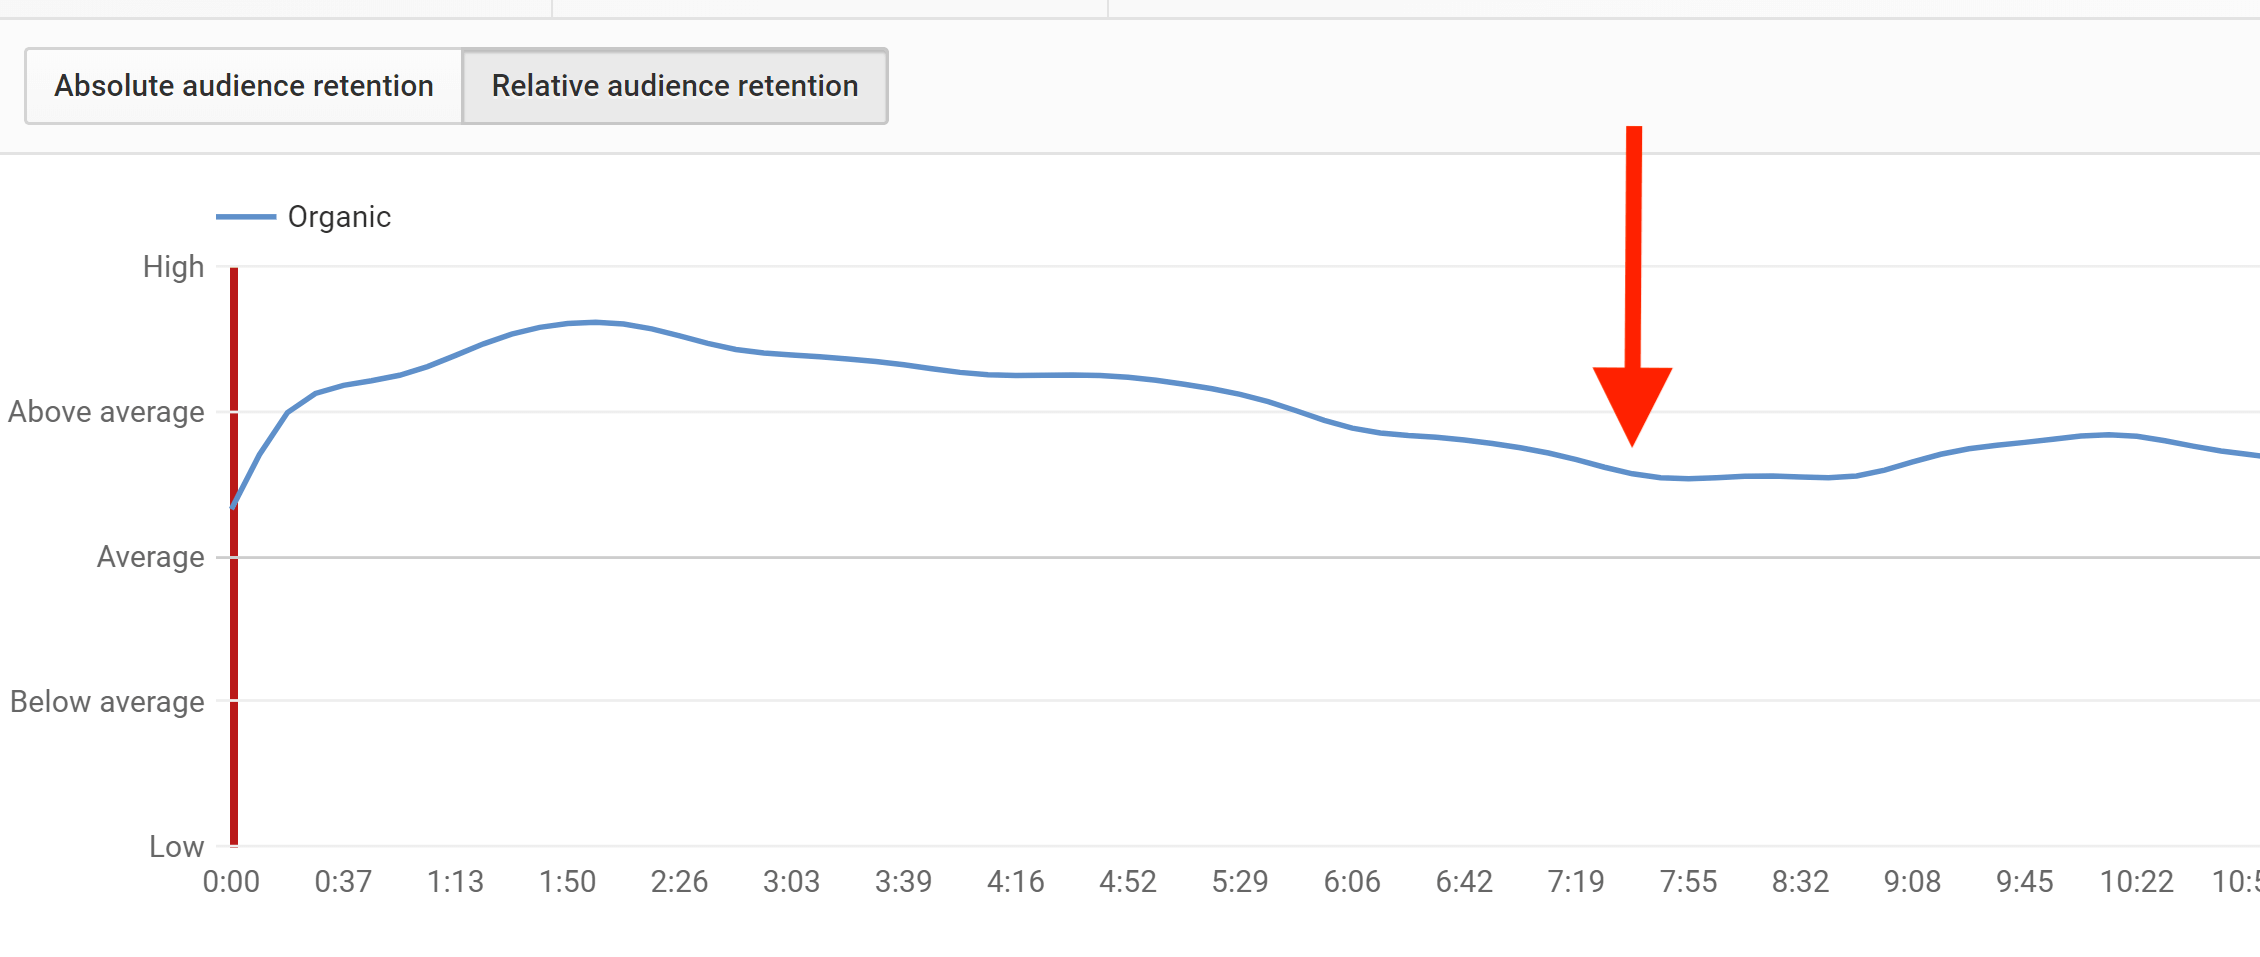
Retention Curve: Plot a retention curve to visualize the drop-off rate over time. This can be done using tools like Google Analytics or custom-built dashboards.
# Example: Python code to calculate viewer retention from log data
def calculate_retention(watch_data):
    total_views = len(watch_data)
    retention = [sum(1 for watch in watch_data if watch['timestamp'] >= t) / total_views for t in range(0, max_time, interval)]
    return retention
1.3 User Interaction
Definition: User interaction includes likes, comments, shares, and other actions users take while engaging with content.

Implementation:
Event Tracking: Implement event listeners or use third-party tools like Mixpanel or Segment to capture user interactions.
Analysis: Use this data to understand user preferences and improve content recommendations.
2. Quality of Service (QoS) Metrics
2.1 Buffering Events
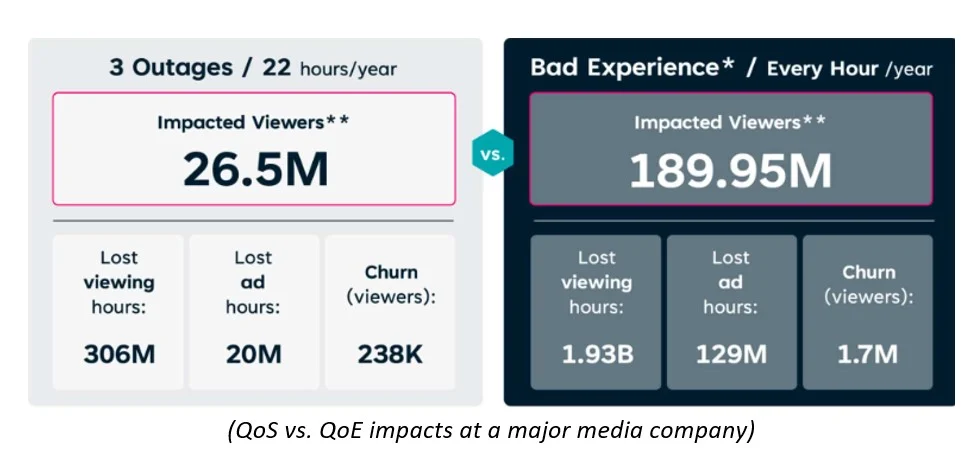
Definition: Buffering events occur when a video pauses to load more data. Frequent buffering can lead to poor user experience and reduced engagement.
Implementation:
Tracking Buffering: Use video player APIs (like Video.js) to detect buffering events.
Data Collection: Store buffering data, including the frequency and duration of each event, in your database.
Analysis: Identify patterns and optimize video delivery to minimize buffering.
// Example: JavaScript for tracking buffering events
video.addEventListener('waiting', () => {
    // Buffering started
    logBufferingEvent(video.id, 'start');
});

video.addEventListener('playing', () => {
    // Buffering ended
    logBufferingEvent(video.id, 'end');
});
2.2 Video Start Time
Definition: Video start time is the time it takes for a video to start playing after the user initiates playback. Faster start times lead to better user experience.
Implementation:
Measurement: Track the time difference between the user clicking "play" and the video starting.
Optimization: Use techniques like pre-fetching, adaptive streaming, and CDN (Content Delivery Network) optimization to reduce start time.
# Example: Python code to log video start time
import time

def track_video_start(video_id, user_action_time):
    start_time = time.time()
    load_video(video_id)
    video_start_time = time.time()
    playback_time = video_start_time - user_action_time
    return playback_time
2.3 Bitrate Adaptation
Definition: Bitrate adaptation is the process of dynamically adjusting the video quality based on the user's network conditions to ensure smooth playback.
Implementation:
Adaptive Bitrate Streaming: Implement protocols like HLS (HTTP Live Streaming) or MPEG-DASH to deliver adaptive bitrate streaming.
Monitoring: Track bitrate changes during playback to analyze how often and under what conditions bitrate adaptation occurs.
// Example: HLS.js implementation for adaptive bitrate streaming
var video = document.getElementById('videoPlayer');
if(Hls.isSupported()) {
  var hls = new Hls();
  hls.loadSource('your_video_url.m3u8');
  hls.attachMedia(video);
  hls.on(Hls.Events.MANIFEST_PARSED,function() {
    video.play();
  });
}
3. Tools and Industry Practices
3.1 Analytics Tools

Google Analytics: Use Google Analytics to track user engagement metrics like watch time and viewer retention. It provides a comprehensive dashboard for analyzing user behavior.

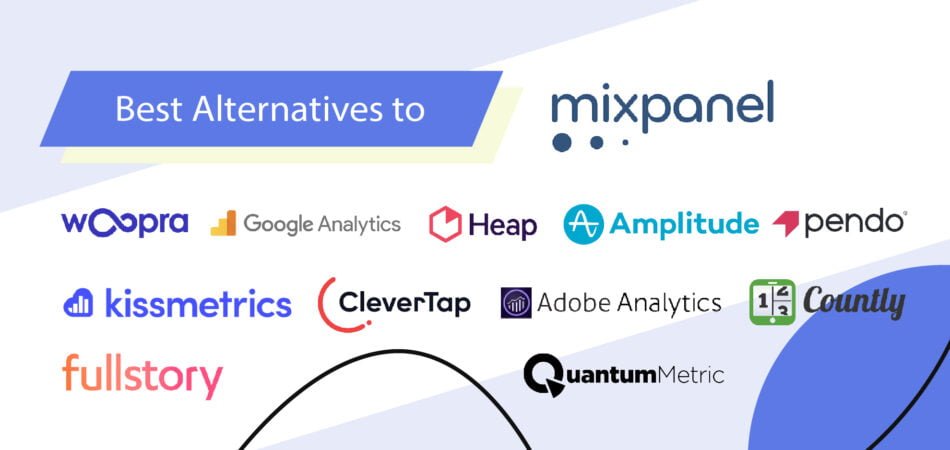
Mixpanel: A powerful tool for tracking user interactions and engagement, allowing for deep analysis of how users interact with your content.
New Relic: Useful for monitoring QoS metrics like video start time and buffering events, providing real-time insights into service performance.
3.2 Content Delivery Networks (CDN)

Akamai: Akamai is one of the leading CDNs that helps reduce video start time and buffering by caching content closer to users.
Cloudflare: Cloudflare offers CDN services with built-in analytics, helping to optimize QoS by reducing latency and improving load times.
3.3 Video Players
Video.js: An open-source video player that supports adaptive bitrate streaming and can be customized to track engagement and QoS metrics.
JW Player: A commercial video player offering advanced analytics and adaptive streaming capabilities.
3.4 Adaptive Bitrate Streaming
HLS (HTTP Live Streaming): A widely used protocol for adaptive streaming that adjusts the video quality based on network conditions.
MPEG-DASH: Another adaptive streaming protocol that allows for high-quality streaming across different devices and network conditions.
4. Conclusion
Optimizing User Engagement and Quality of Service (QoS) is crucial for the success of any video streaming service. By implementing and analyzing metrics like watch time, viewer retention, buffering events, and video start time, you can create a more engaging and seamless experience for your users. Leveraging industry tools and best practices, such as CDNs, adaptive bitrate streaming, and comprehensive analytics platforms, will further enhance your ability to deliver high-quality video content.
5. Further Reading
For those interested in diving deeper into these topics, consider exploring the following resources:
"Adaptive Bitrate Streaming for Video over the Internet" by Jan Ozer.
"Video Analytics: Data-Driven Insights for Video Streaming" by Will Law.
"Designing Video Quality of Experience Solutions" by Srinivas Kalyanaraman and Vijay Kumar.
This article has covered the essential metrics and tools needed to measure and optimize user engagement and QoS in a video streaming service. By understanding these concepts, you can ensure your platform not only attracts users but keeps them coming back for more.
Subscribe to my newsletter
Read articles from ritiksharmaaa directly inside your inbox. Subscribe to the newsletter, and don't miss out.
Written by

ritiksharmaaa
ritiksharmaaa
Hy this is me Ritik sharma . i am software developer