You Call Yourself a Web Developer and Don't Use Chrome Dev Tools?
 Ankur
Ankur
Chrome Dev Tools is a powerful tool for web developer built into the Google Chrome browser. Chrome Dev Tools is indispensable tool that lets you inspect, edit and debug your code. It helps web developer to build better website and faster.
You can access Chrome dev tools by following commands
macOS: Command+Shift+P
Windows, Linux, ChromeOS: Control+Shift+P
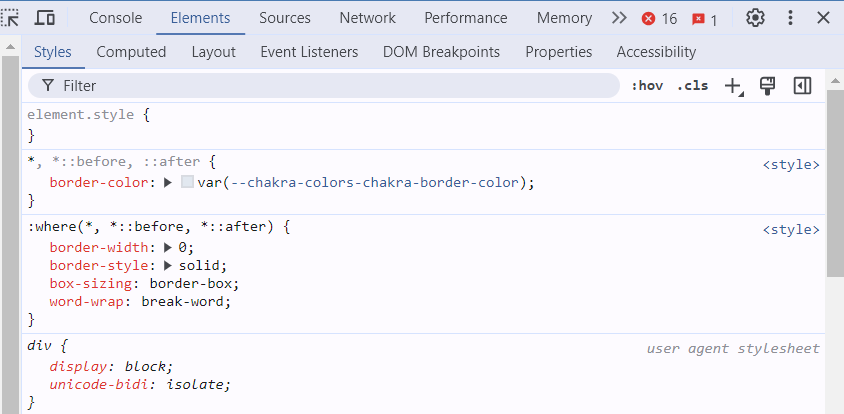
Elements Panel
The HTML and inline CSS codes are displayed in the elements tab. The Elements panel lets you inspect and edit the HTML and CSS of your page. Elements panel gives access to edit on the go so that you can see the immediate changes on the page while you can make changes to your code.
Console Panel
In the console, Javascript codes are executed. To get started with the Console panel, enter some JavaScript into the Console and press "Enter." The Console will evaluate the code and print the result. Web developers often log messages to the Console to make sure that their JavaScript is working as expected. To log a message, you insert an expression in console.

When the browser executes your JavaScript and sees an expression like that, it knows that it's supposed to log the message to the Console.
Source Panel
The sources tab displays the files that contain the codes. The Sources panel lets you view and edit your page's JavaScript and CSS code.
Use the Chrome Dev Tools Sources panel to:
View Files.
Edit CSS and JavaScript.
Create and save code snippets of JavaScript.
Debug JavaScript.
Set up a Workspace, so that changes you make in Dev Tools get saved to the code on your file system.
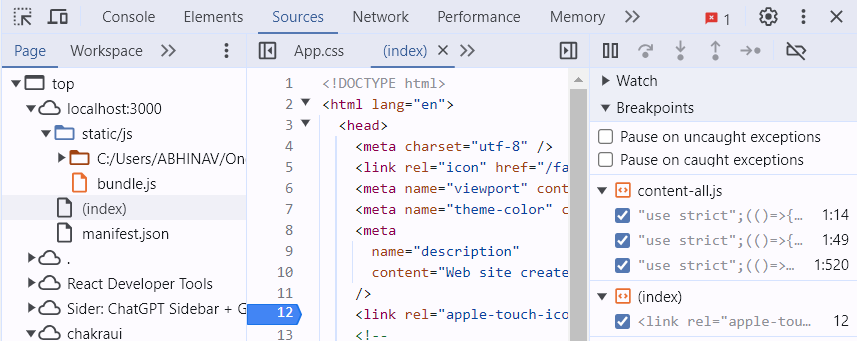
Select a file in the "Files" pane to get started with the Sources panel. This will bring up the contents of that file in the "Editor" pane. From here, you make changes to the code and see those changes immediately reflected on the page.
Network Panel
The network tab displays the files that are being loaded from the URL. Network tab used to analyze network load and resources.
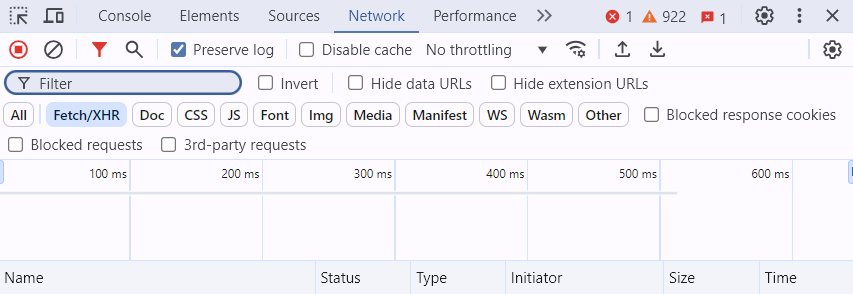
Select a resource in the "Resources" pane to start with the Network panel. This will bring up the details of that resource in the "Details" pane. From here, you can see when the resource was loaded, how long it took to load, and what type of resource it was.
The Network panel lets you:
Record network activity
Inspect network requests
Filter and sort network requests
Search network headers and responses
Change loading behavior
Block network requests
Change network conditions
Debug prefetch speculation rules
Override HTTP response headers
Override headers for multiple URLs with wildcard characters.
Save and export network request data
Performance Panel
Runtime performance is how your page performs when it is running, as opposed to loading. This tutorial teaches you how to use the Chrome Dev Tools Performance panel to analyze runtime performance.
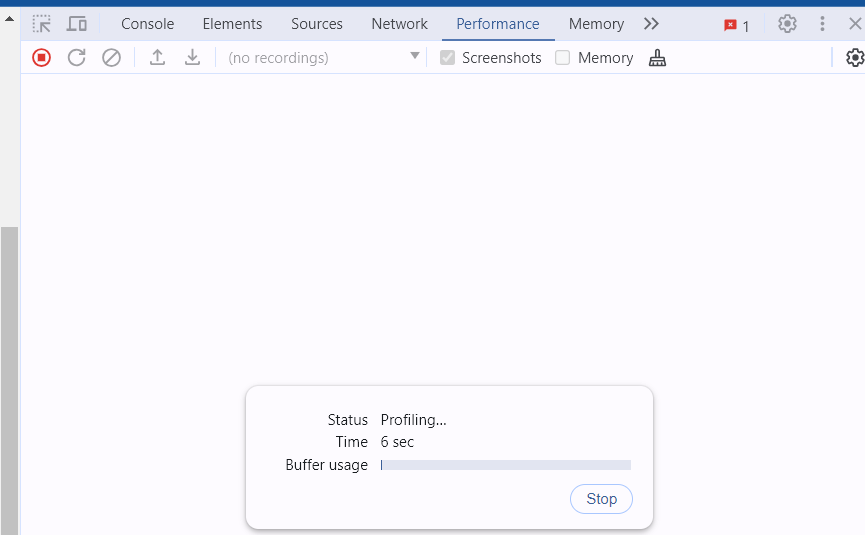
Select a resource in the "Resources" pane to get started with the Performance panel. This will bring up the details of that resource in the "Details" pane. You can check how much time it is taking to load, what type of resource it is, and what size it is.
You can also use the Performance panel to record a performance profile. To record a performance profile, click the "Record" button at the panel's top. This will start recording information about your page's performance. Once you have finished recording then just click the "Stop" button to save the performance profile.
Application Panel
The application tab displays the contents of your browser’s storage. Use the Application panel to inspect, modify, and debug many aspects of your web app including its manifest, service workers, storage, and cache data.
Select a resource in the "Resources" pane to get started with the Application panel. This will bring up the details of that resource in the "Details" pane. You can just see and check what files are being loaded and what cookies and local storage are being used.
Security Panel
Security provides standard security details, such as viewing a site’s HTTPS certificate and TLS status.
The Security panel lets you inspect the security settings of your web page. With the Security panel, you can see what permissions your page has and what security vulnerabilities may be present.
Memory Panel
The Memory panel provides diagnostic tools that let you see the memory distribution of JavaScript objects, discover and isolate memory leaks, get a breakdown of memory allocation by function, and more.
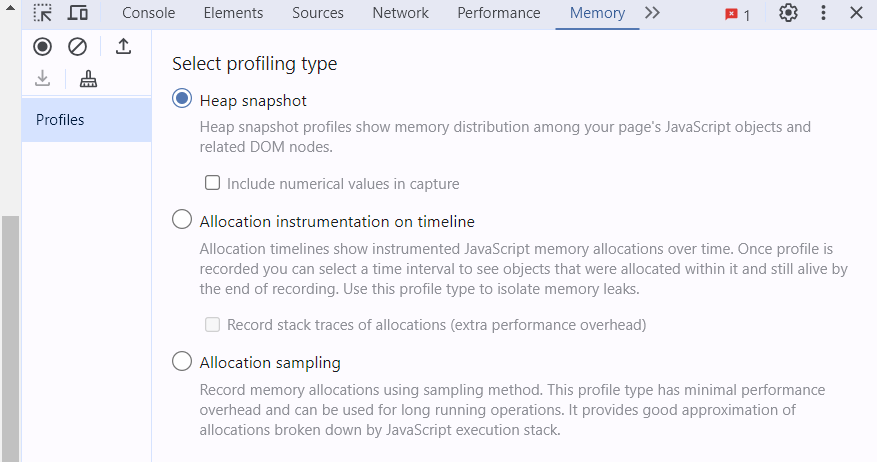
Select a resource in the "Resources" pane to get started with the Memory panel. This will bring up the details of that resource in the "Details" pane. From here, you can check how much of the memory the resource uses, what type of resource it is, and when it was last accessed.
Conclusion
As we saw, how Dev Tools are important for web developer. It allows you to work directly in the browser and see results in real time. You can use it to preview style changes, alter the HTML or help write your JavaScript code and do some debugging.
Resources
https://developer.chrome.com/docs/devtools/
https://www.headspin.io/blog/chrome-devtools-a-complete-guide
https://medium.com/swlh/the-basics-of-chrome-devtools-4d69a102a699
https://codeinstitute.net/global/blog/chrome-dev-tools-tips-tricks/
Subscribe to my newsletter
Read articles from Ankur directly inside your inbox. Subscribe to the newsletter, and don't miss out.
Written by
