Kubernetes Troubleshooting
 Rajat Chauhan
Kubernetes is a powerful platform for managing containerized applications, but with its complexity comes the need for effective troubleshooting. Whether you're dealing with a failed deployment, a non-responsive pod, or an issue within a container image, understanding how to diagnose and resolve these problems is crucial. This blog will guide you through troubleshooting Kubernetes using kubectl commands, analyzing logs, and debugging container images.
1. Using kubectl Commands for Troubleshooting
kubectl is the command-line tool that allows you to interact with your Kubernetes cluster. It’s the first line of defense when diagnosing issues within your cluster.
1.1. Checking the Status of Resources
To get a high-level overview of what's happening in your cluster, start by checking the status of your resources:
kubectl get pods
kubectl get services
kubectl get deployments
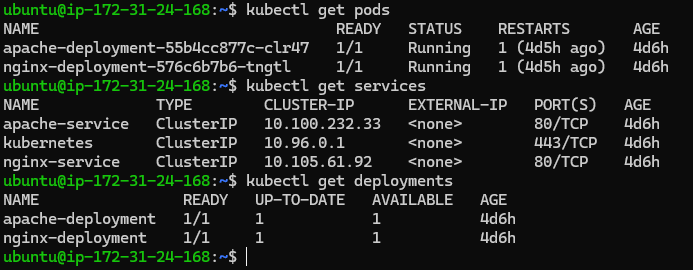
These commands list the resources and their current states. For example, a pod might be in a Pending, Running, or CrashLoopBackOff state, each indicating different issues.
1.2. Describing Resources
The kubectl describe command provides detailed information about a specific resource, which can help in identifying issues.
kubectl describe pod <pod-name>
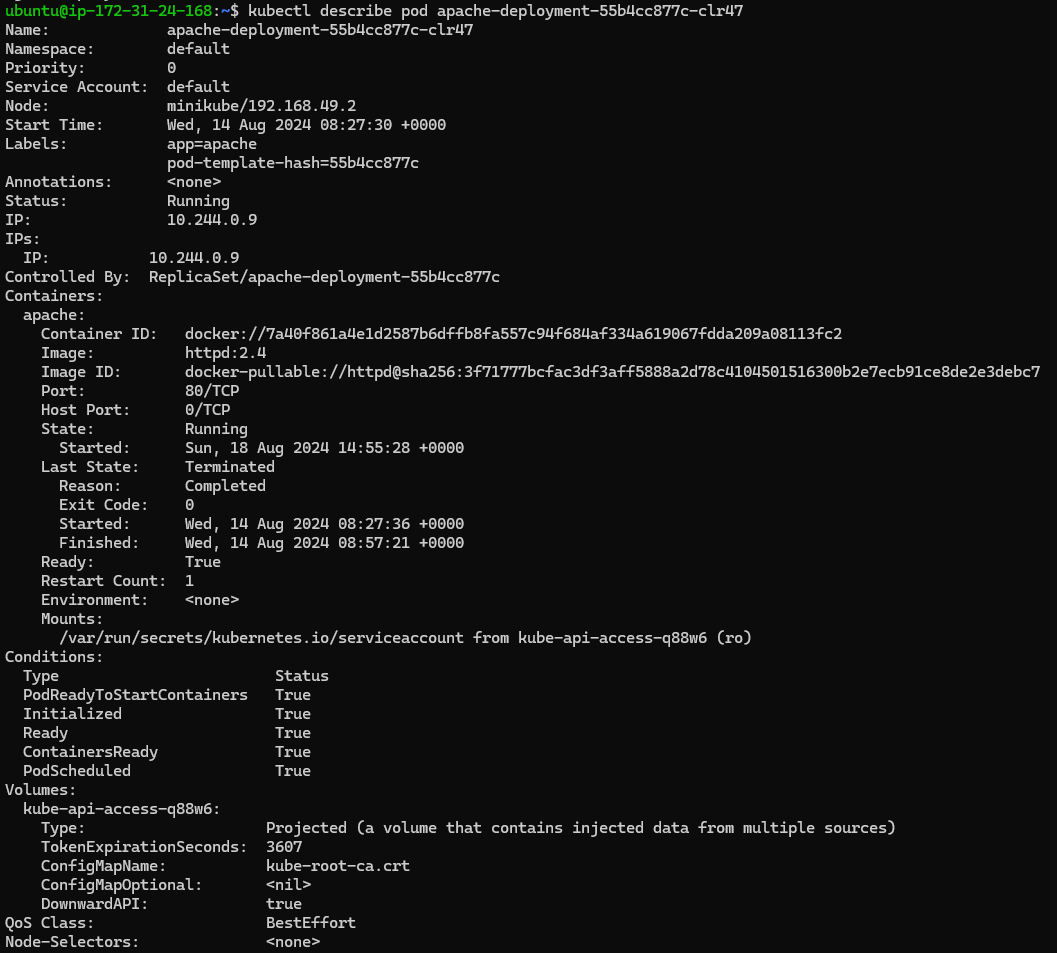
This command gives you insights into events, configuration details, and any errors that might be causing problems.
1.3. Inspecting Events
Kubernetes events are useful for understanding what has happened in your cluster recently. You can view events for a specific resource or for the entire cluster:
kubectl get events
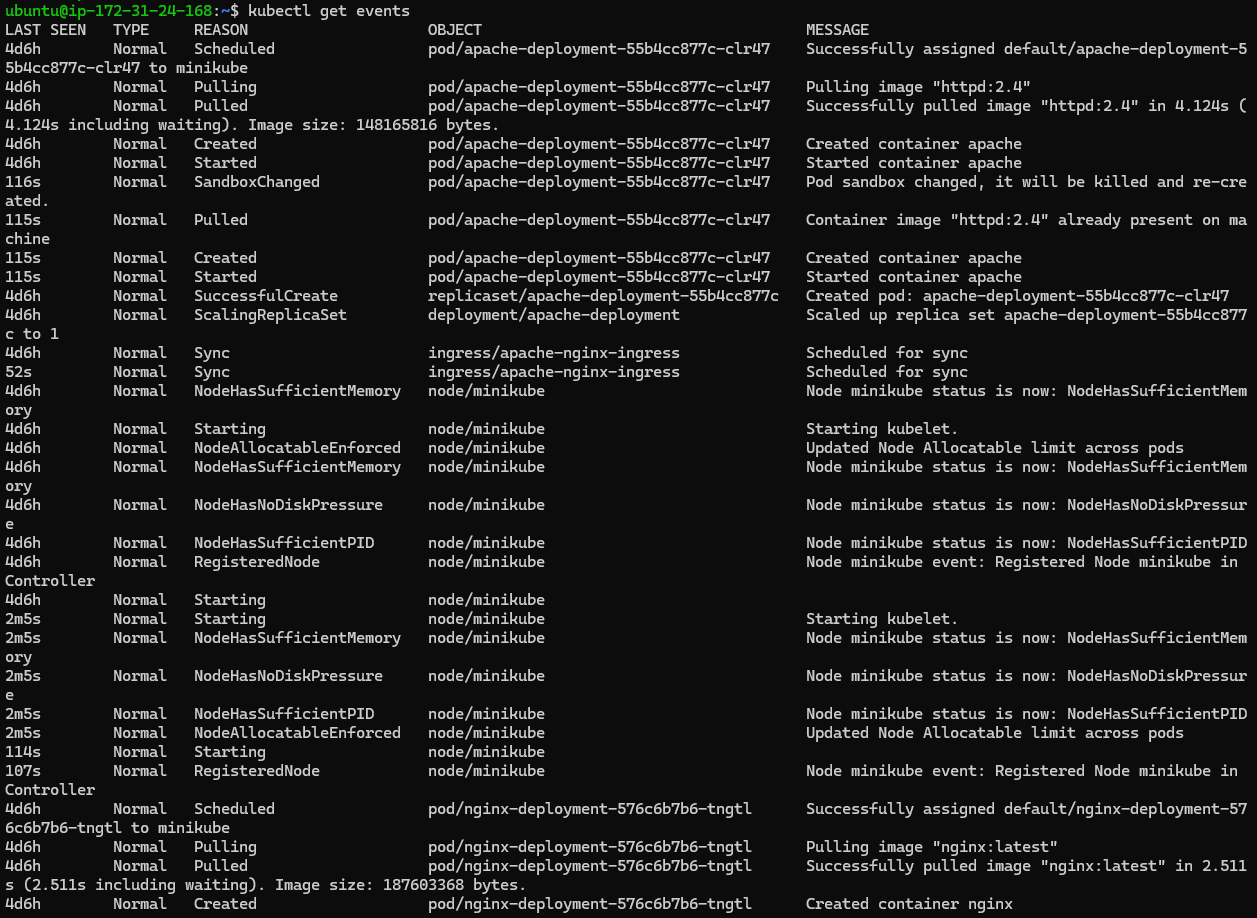
Events are particularly helpful for identifying issues like scheduling failures, container crashes, or network problems.
2. Analyzing Logs
Logs are an essential part of troubleshooting in Kubernetes. They provide real-time information about what's happening inside your containers.
2.1. Viewing Pod Logs
You can view logs for a specific pod using the kubectl logs command:
kubectl logs <pod-name>
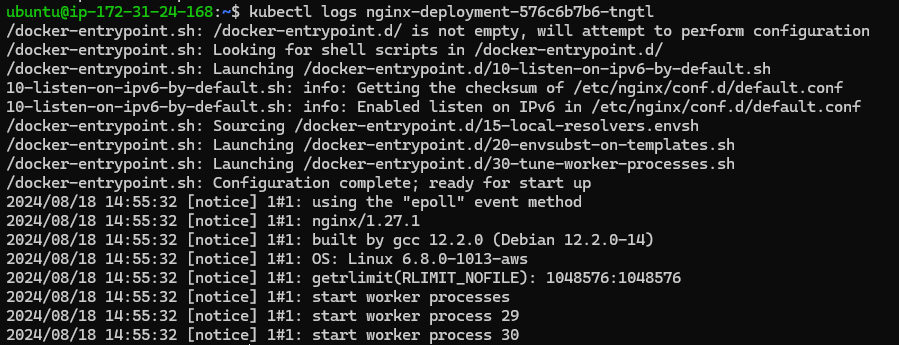
If a pod has multiple containers, you can specify the container name:
kubectl logs <pod-name> -c <container-name>
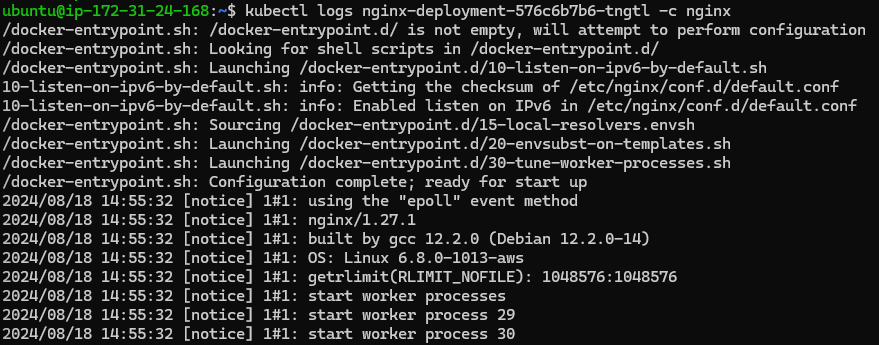
Logs can reveal errors, warnings, and other important information about the container's operation.
2.2. Streaming Logs
For real-time troubleshooting, you can stream logs using the -f flag:
kubectl logs -f <pod-name>

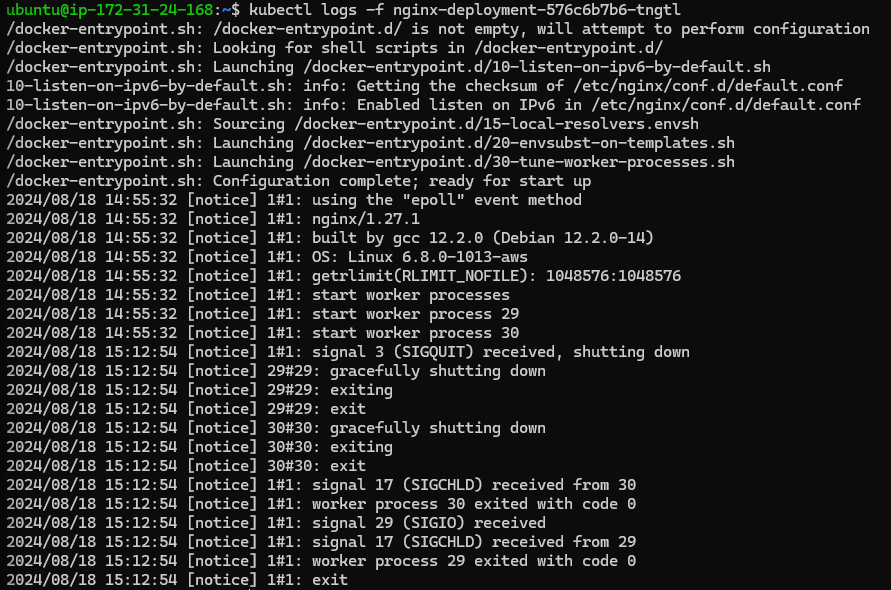
This is useful when you want to monitor a pod as it starts up or when trying to catch intermittent issues.
2.3. Viewing Previous Logs
If a container has crashed and restarted, you can view the logs from the previous instance using:
kubectl logs <pod-name> --previous
This is particularly helpful for diagnosing issues that cause a container to crash.
3. Debugging Container Images
Sometimes the issue lies within the container image itself. In such cases, debugging the image is necessary.
3.1. Running a Debug Pod
Kubernetes allows you to run a debug pod, which is a temporary pod based on the same image as the problematic container. You can use kubectl debug this to create this pod:
kubectl debug <pod-name> --image=<image-name>
This command allows you to interactively troubleshoot the container environment.
3.2. Executing Commands Inside a Container
You can execute commands inside a running container to inspect the filesystem, environment variables, or running processes:
kubectl exec -it <pod-name> -- /bin/sh
This helps check configurations, verify network connectivity, or diagnose resource constraints.
3.3. Debugging with Ephemeral Containers
Kubernetes also supports ephemeral containers, which are useful for debugging. These containers can be added to a running pod without restarting it:
kubectl debug -it <pod-name> --image=<debug-image> --target=<container-name>
Ephemeral containers are ideal for troubleshooting live issues without interrupting the primary application containers.
4. Practical Troubleshooting Scenarios
4.1. Pod in CrashLoopBackOff
A CrashLoopBackOff state indicates that a container is repeatedly crashing. Start by checking the logs:
kubectl logs <pod-name>
If the logs don't provide enough information, use kubectl describe pod <pod-name> to check for events or errors related to resource limits, liveness probes, or image pull issues.
4.2. Pod Stuck in Pending
A pod stuck in the Pending state usually indicates a scheduling problem. Use the following command to get more details:
kubectl describe pod <pod-name>
Look for issues related to node availability, insufficient resources, or affinity/anti-affinity rules that might prevent the pod from being scheduled.
4.3. Failed Image Pull
If your pod is stuck in a ImagePullBackOff state, there’s likely an issue with the container image. Check the events:
kubectl describe pod <pod-name>
Common causes include incorrect image names, missing image tags, or authentication issues when pulling from a private registry.
Thank you for taking the time to read! 💚
Subscribe to my newsletter
Read articles from Rajat Chauhan directly inside your inbox. Subscribe to the newsletter, and don't miss out.
Written by

Rajat Chauhan
Rajat Chauhan
Rajat Chauhan is a skilled Devops Engineer, having experience in automating, configuring, deploying releasing and monitoring the applications on cloud environment. • Good experience in areas of DevOps, CI/CD Pipeline, Build and Release management, Hashicorp Terraform, Containerization, AWS, and Linux/Unix Administration. • As a DevOps Engineer, my objective is to strengthen the company’s applications and system features, configure servers and maintain networks to reinforce the company’s technical performance. • Ensure that environment is performing at its optimum level, manage system backups and provide infrastructure support. • Experience working on various DevOps technologies/ tools like GIT, GitHub Actions, Gitlab, Terraform, Ansible, Docker, Kubernetes, Helm, Jenkins, Prometheus and Grafana, and AWS EKS, DevOps, Jenkins. • Positive attitude, strong work ethic, and ability to work in a highly collaborative team environment. • Self-starter, Fast learner, and a Team player with strong interpersonal skills • Developed shell scripts (Bash) for automating day-to-day maintenance tasks on top of that have good python scripting skills. • Proficient in communication and project management with good experience in resolving issues.