Developing Data Scientists and Engineers
 freeCodeCamp
By David Venturi
Free Code Camp asked 15,000 people who they are, and how they’re learning to code. I isolated those focused on data science and data engineering.
More than 15,000 people responded to Free Code Camp’s 2016 New Coder Survey, granting researchers (like me!) an unprecedented glimpse into how people are learning to code. They released the entire dataset on Kaggle.
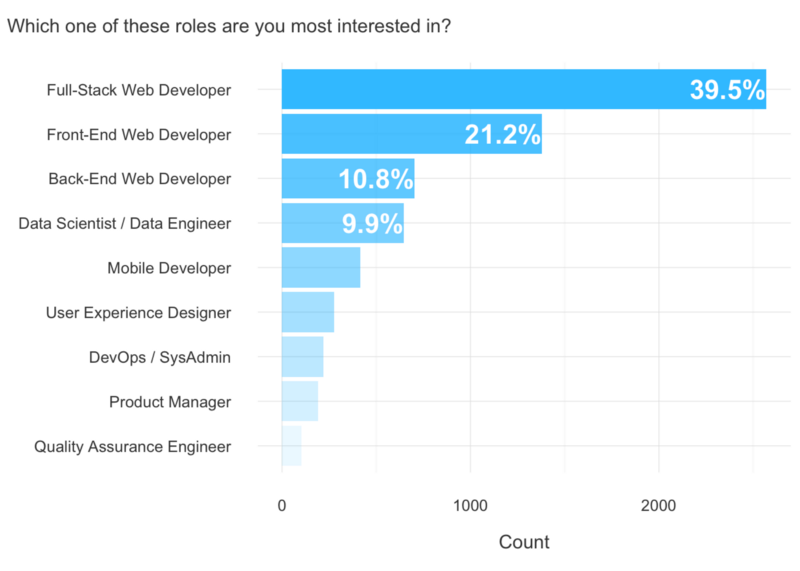
646 respondents answered “Data Scientist/Data Engineer” to the question: “Which one of these roles are you most interested in?”
Here are a few high-level statistics from this data-focused subset, which complements Free Code Camp’s exploration of new coders in general.
I’ve borrowed the structure of Free Code Camp’s announcement article for ease of comparison. I’ve also included my comments where findings differ notably. And a few bonus plots, too!
We asked 15,000 people who they are, and how they’re learning to code
_More than 15,000 people responded to the 2016 New Coder Survey, granting researchers an unprecedented glimpse into how…_medium.freecodecamp.com
Who participated?
Of the 646 developing data scientists and data engineers who responded to the survey:
- 25% are women (4% more)
- their median age is 26 years old (one year younger)
- they started programming an average of 16 months ago (5 months earlier)
Learner goals and approaches
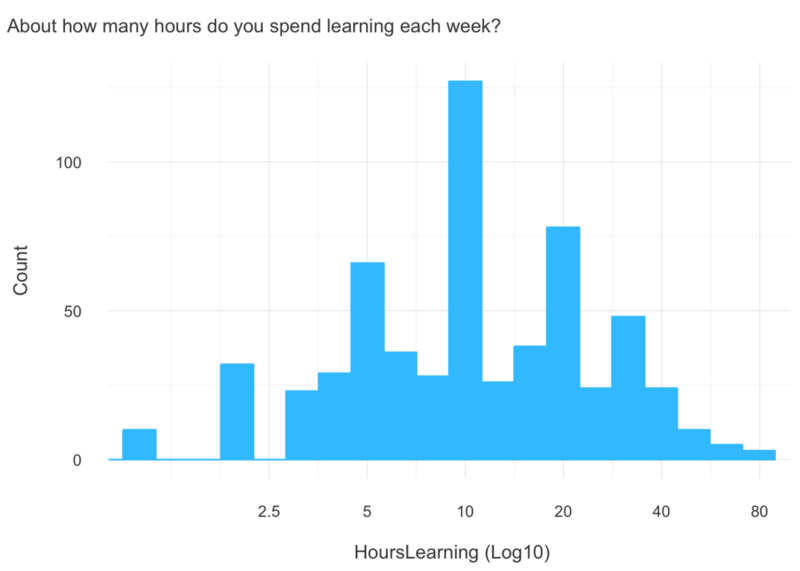
14 hours each week, on average, are spent learning.
This is one hour less than new coders in general.
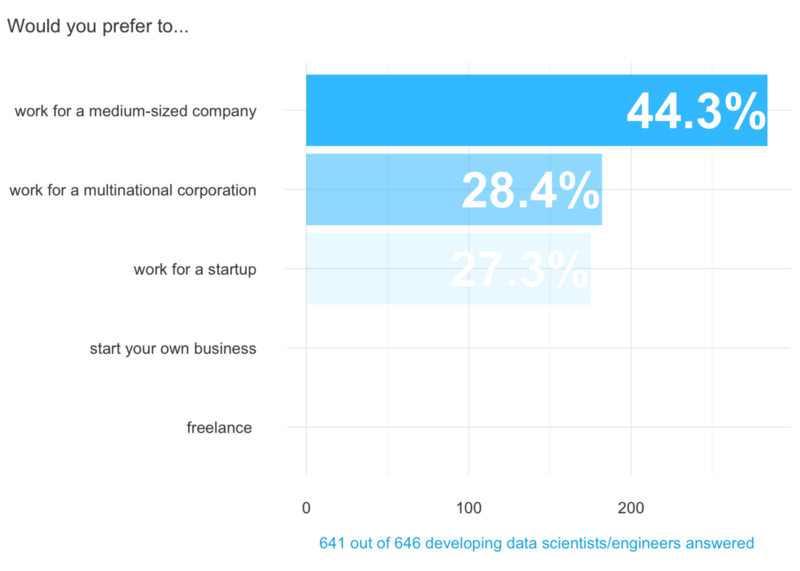
0% want to freelance or start their own business.*
Compared to 40% for the full new coder survey, this is a bit shocking. I have a hunch these zero counts are caused by the survey’s design. Every respondent that answered the job role of interest question has zero counts for “start your own business” and “freelance.”
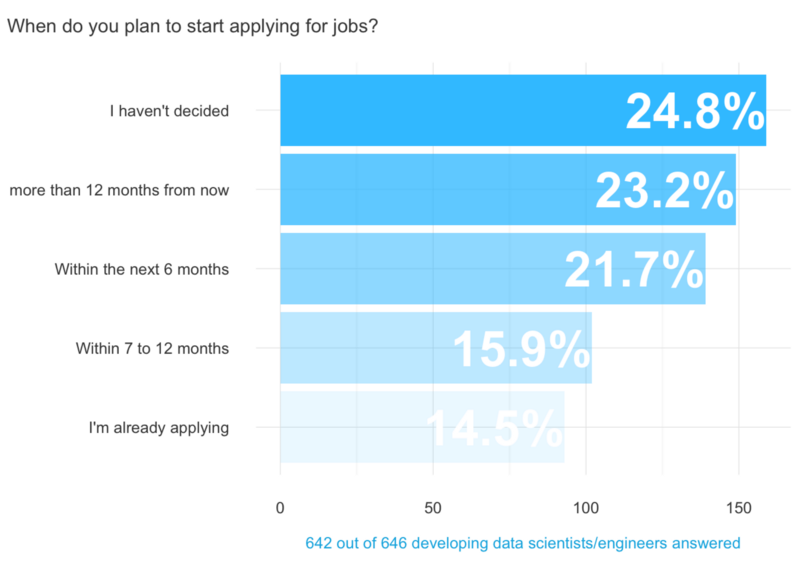
52% percent are already applying for jobs, or will start applying within the next year.
This is a longer time horizon than new coders in general, where 65% are applying within the next year.
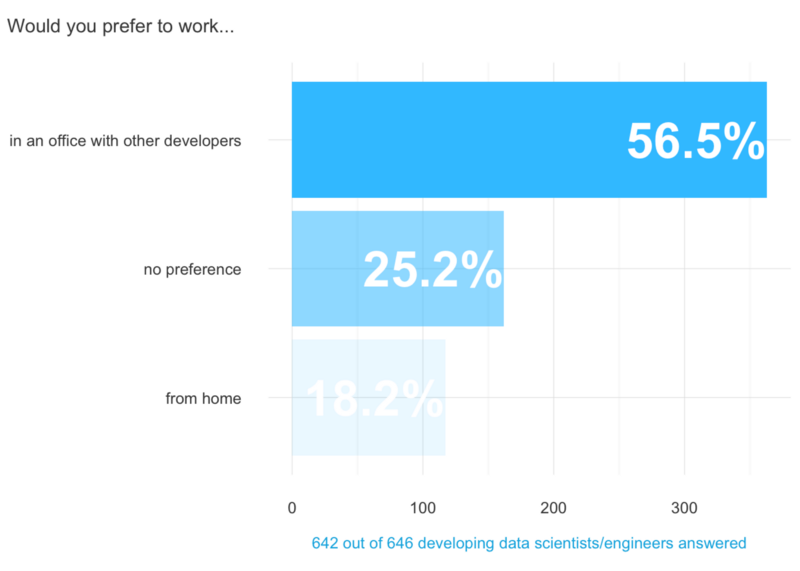
Most of them want to work in an office, as opposed to remotely.
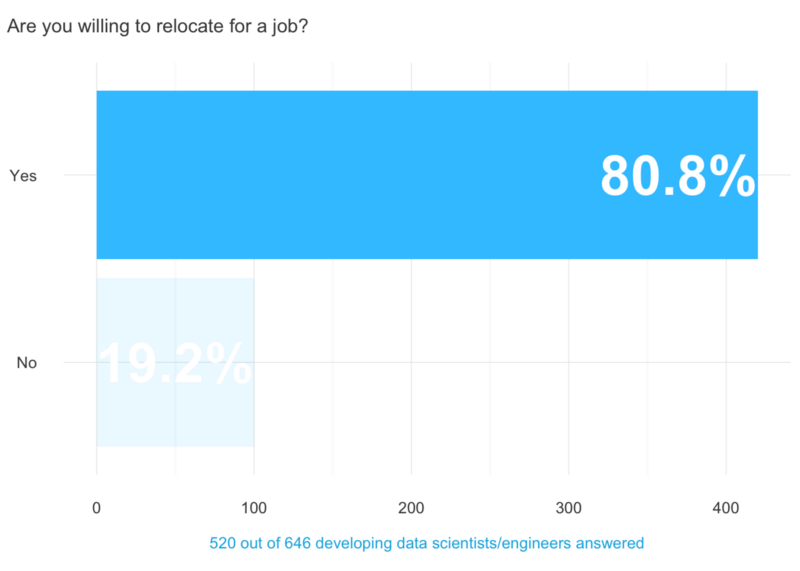
And a majority are willing to relocate.
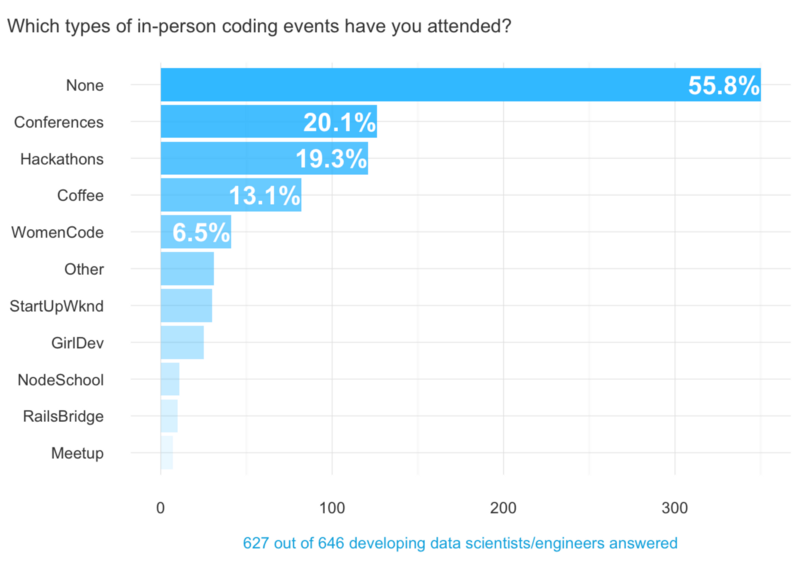
Most of them have not yet attended any in-person coding events.
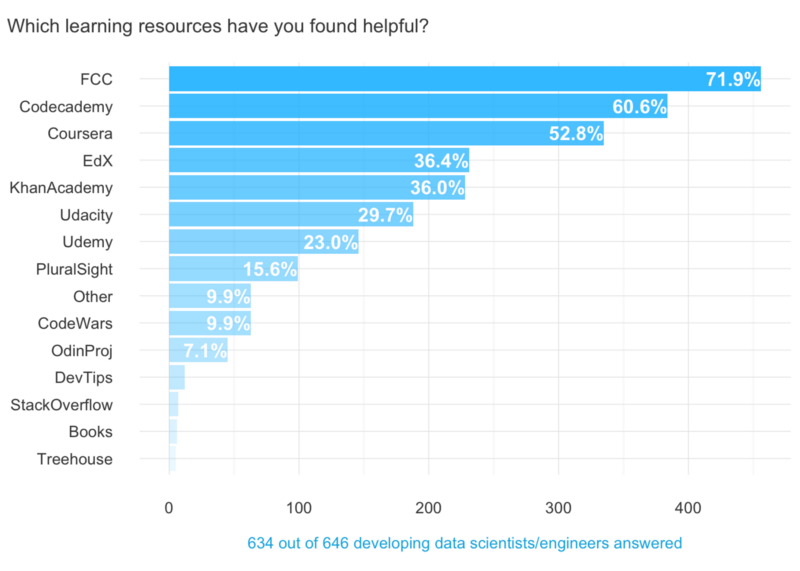
64% have used at least one of Coursera, edX, or Udacity.
Only 46% of new coders in general have used at least one of these resources. These companies have a wider range of subject areas than the some of the coding-specific resources listed.
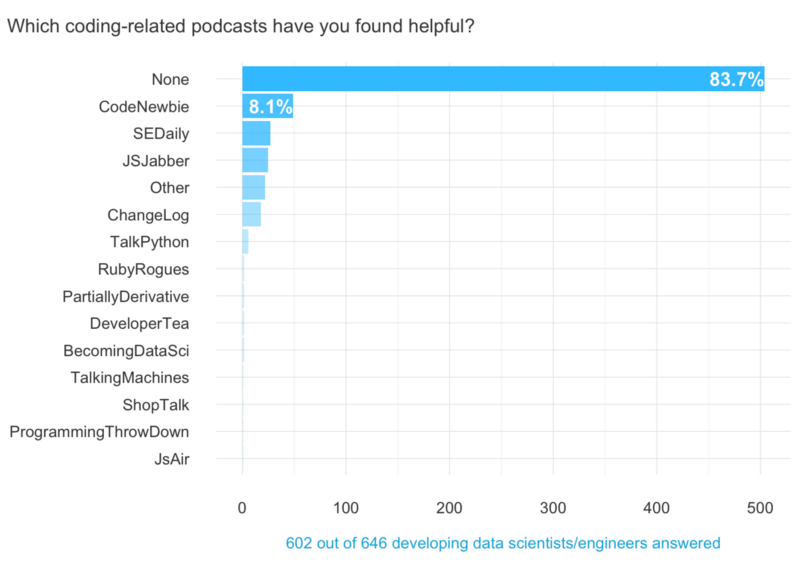
Less than 20% listen to coding-related podcasts.
Of them, Partially Derivative, Becoming A Data Scientist, and Talking Machines are the only data-specific podcasts noted.
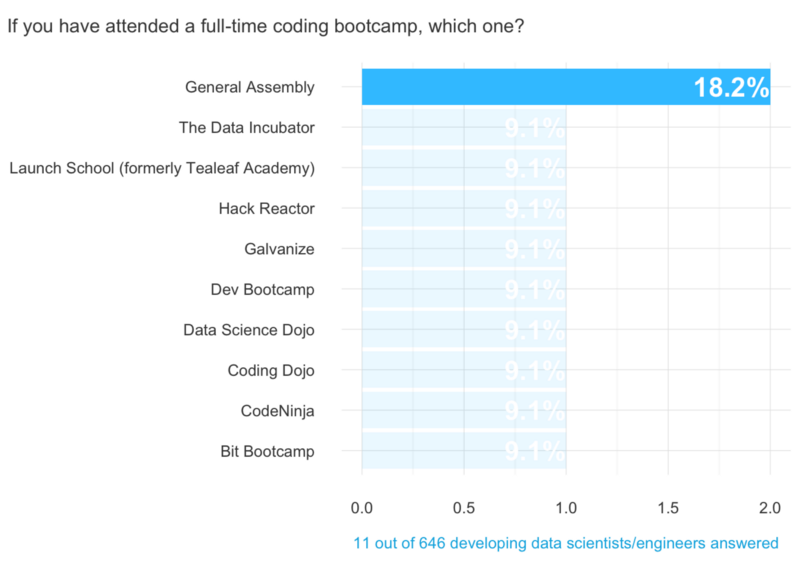
Only 1% have attended a bootcamp.
6% of new coders have attended a bootcamp.
Demographics and Socioeconomics
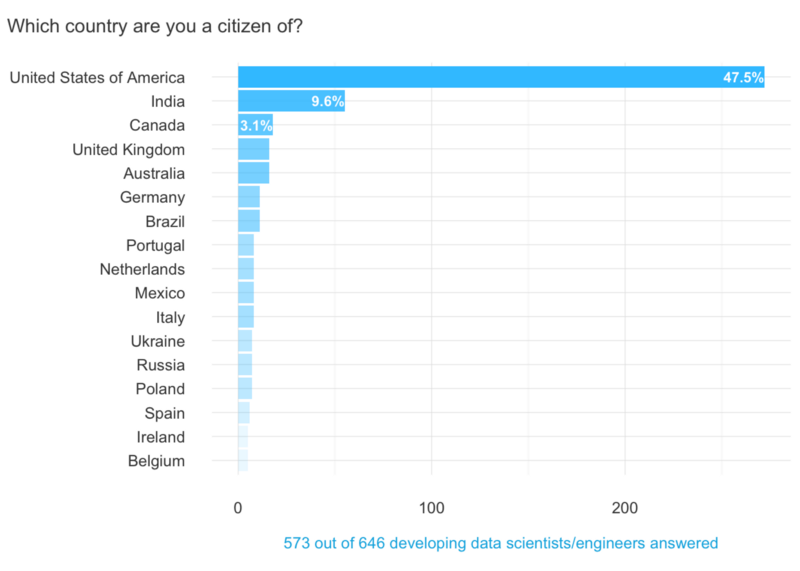
Data-focused respondents represent 166 countries.
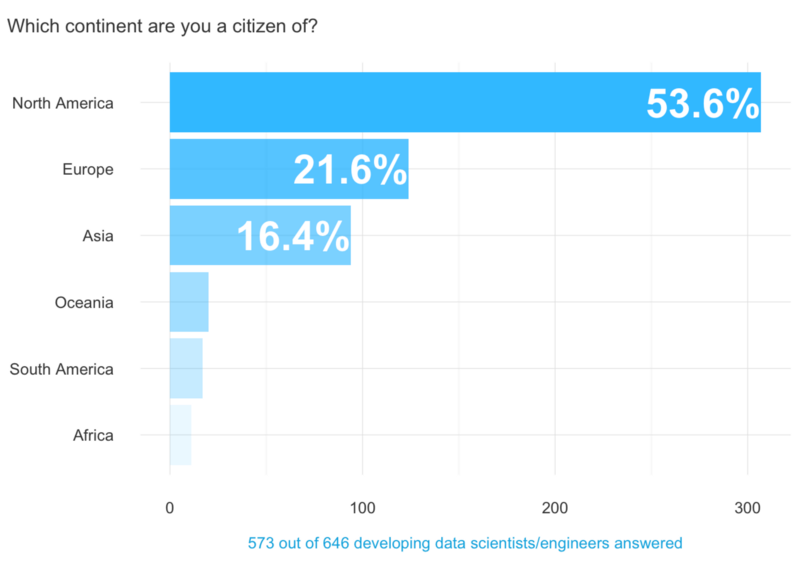
More than 90% are from North America, Europe, and Asia.
The dominating percentage of North Americans should be expected because Free Code Camp is based in the United States.
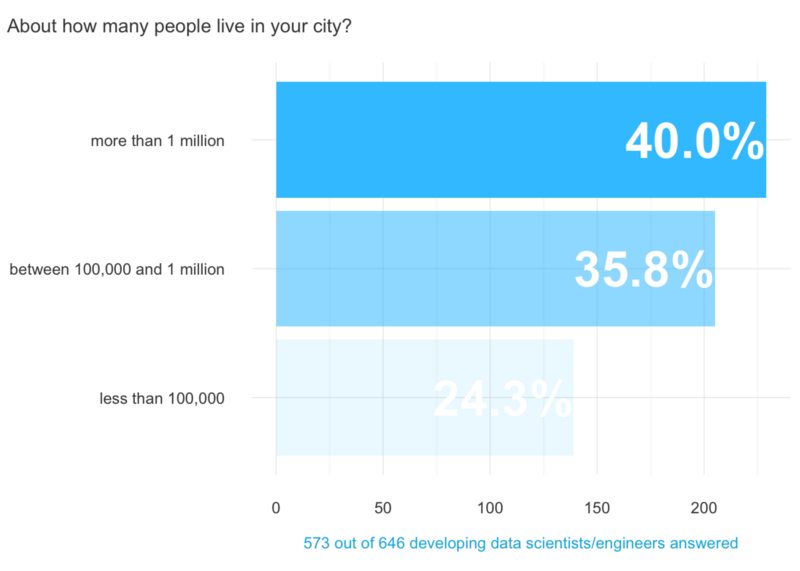
Their cities span a wide range of urbanization levels.
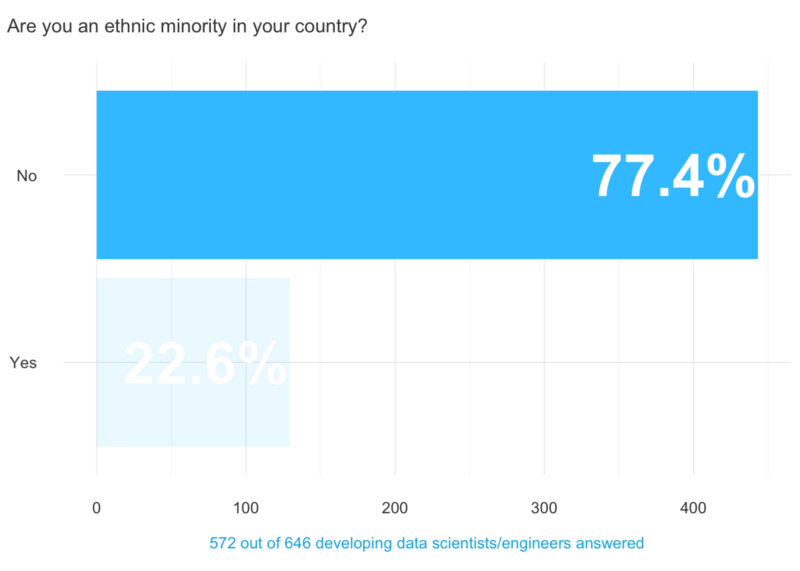
Just under a quarter of respondents are ethnic minorities in their country.
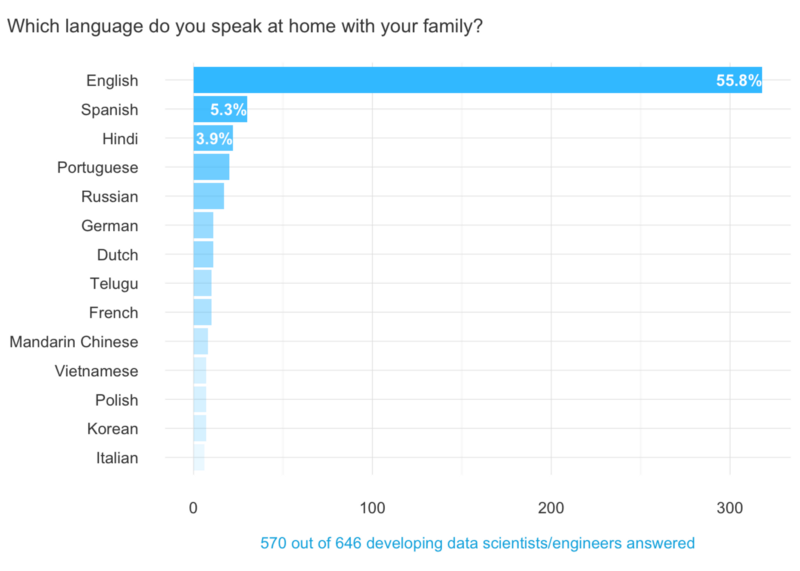
And nearly half are non-native English speakers. They grew up speaking one of 148 languages.
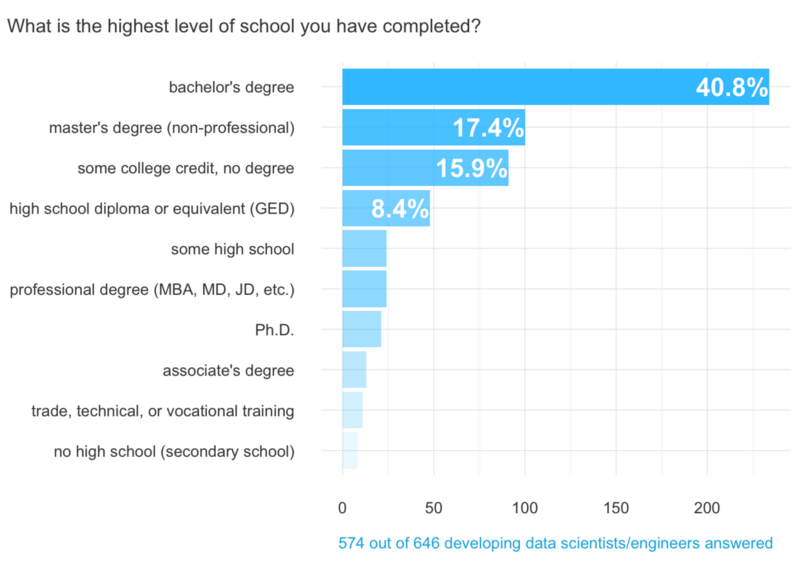
67% have earned at least a bachelor’s degree.
Compared to 58% for new coders in general, the data-focused subset is more skewed towards post-secondary studies.
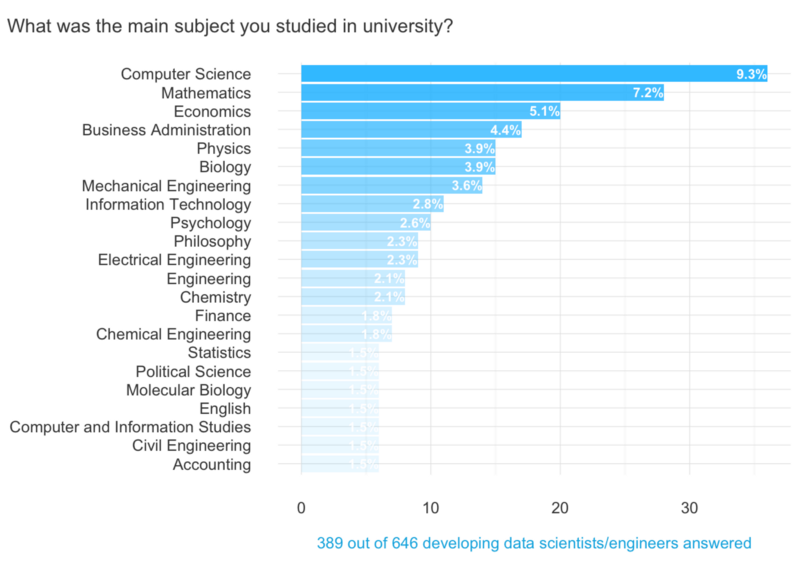
They studied 425 different majors. Computer Science and Mathematics were the two most popular majors, and an additional 16% studied some form of engineering.
Diversity amongst majors is greater compared to the full survey, where Computer Science and Information Technology checked in at #1 and #2 with 17% and 5%, respectively.
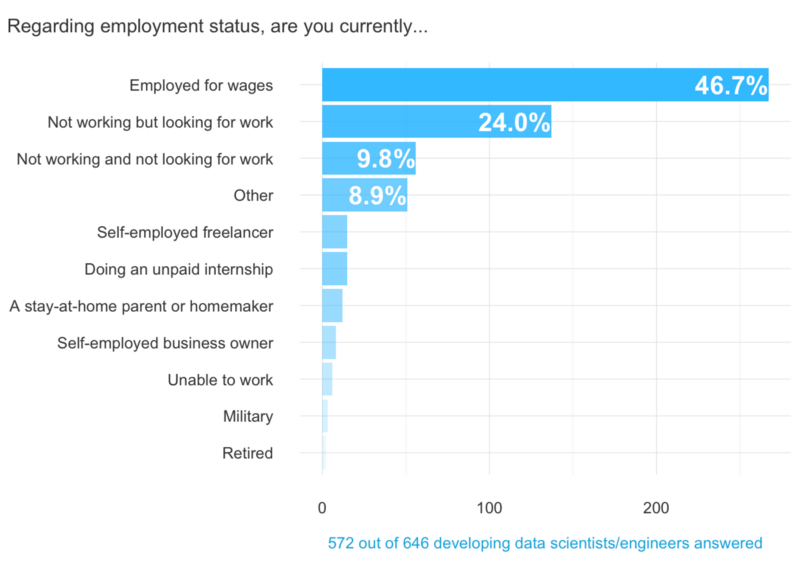
Just over one-half are currently working.
Two-thirds of the new coder population are currently working.
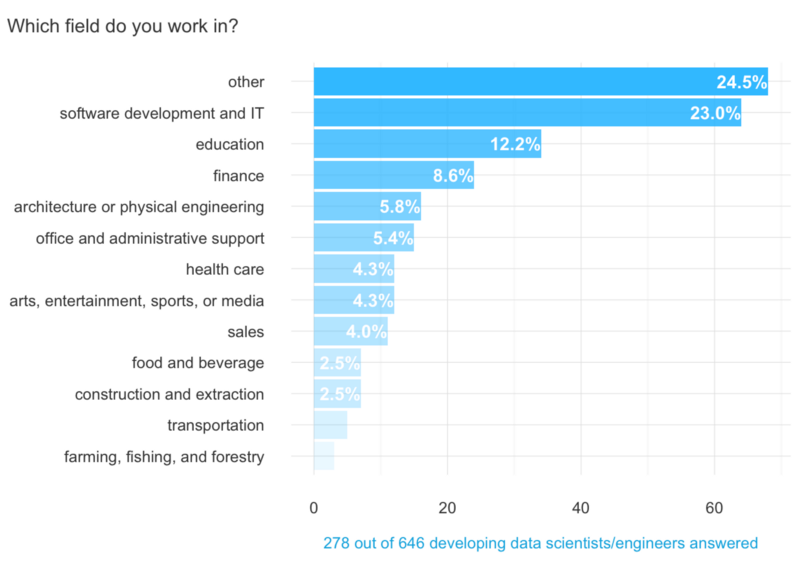
A quarter work in the tech industry.
There is a higher variety of employment fields compared to the full dataset, where 50% of respondents work in software development and IT.
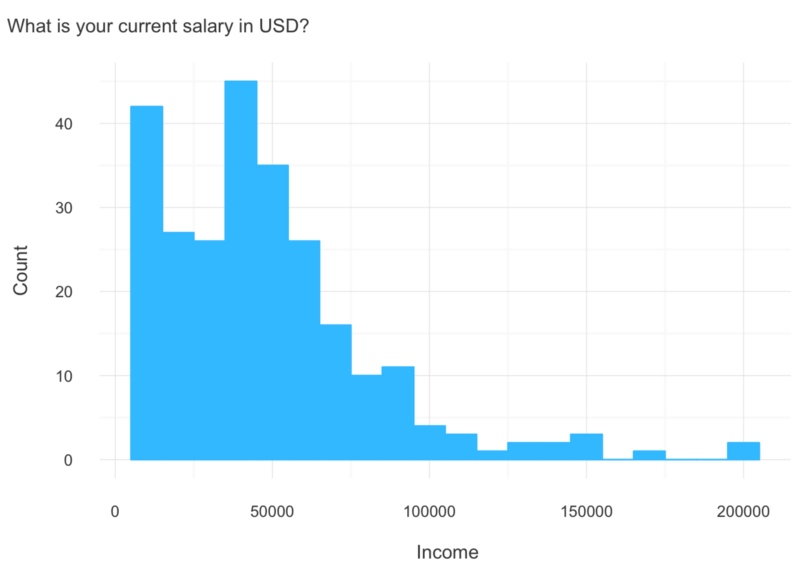
Median current salary is $44k.
The median current salary for the full dataset is $37k.
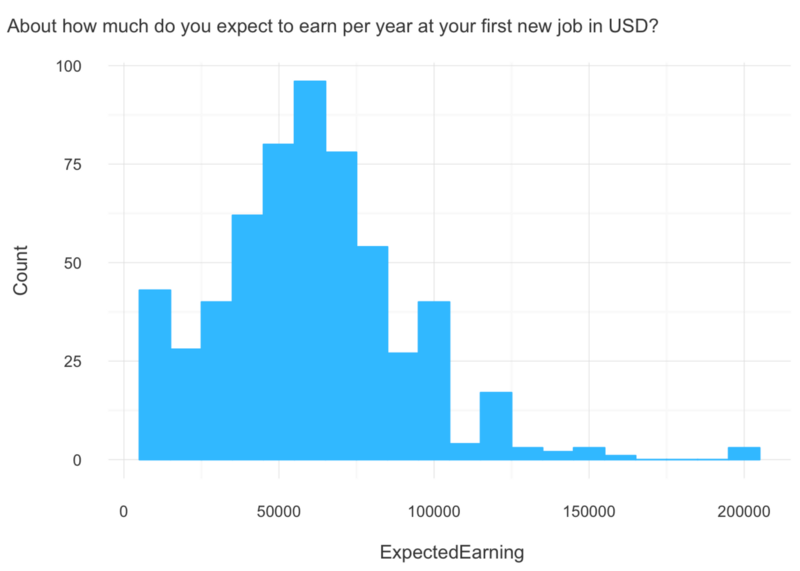
And they expect to earn a median of $60k with their new data science/engineering skills.
The median for the full survey dataset is $50k. With data science/engineering being notoriously lucrative in 2016, some respondents might be seeking higher wages.
7% have served in their country’s military.
13% have children, and another 3% financially support an elderly or disabled relative. And one-fifth are doing this without the help of a spouse.

47% consider themselves underemployed (working a job that is below their education level).
This is 5% higher than new coders in general.
If they have a home mortgage, they owe an average of $194k.
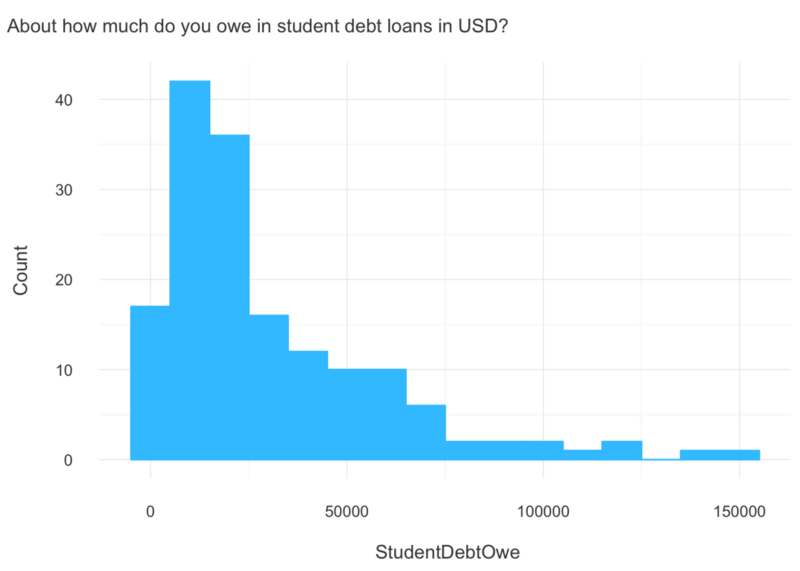
If they have student loans, they owe an average of $37k.
This average is $3k more than the full survey dataset.

14% don’t yet have high-speed internet at home.
And 3% are currently receiving disability benefits from their government.
These are the people who are learning data science and engineering. Free, self-paced learning resources are definitely important.
What’s next?
You can find a more detailed version of this analysis on Kaggle, where I outline my exploratory data analysis (EDA) process.
Be sure to check out my initial exploration of Free Code Camp’s dataset, where I dive deeper into the characteristics of new coders:
New Coders: How Salary and Time Spent Learning Vary by Demographic
_I analyzed the 15,000 respondents to Free Code Camp’s New Coder Survey by continent, gender, and whether they’re an…_medium.freecodecamp.comThe 6 most desirable coding jobs (and the types of people drawn to each)
_Free Code Camp asked 15,000 people who they are, and how they’re learning to code. I separated them by their job…_medium.freecodecamp.com
If you have questions or concerns about this series or the R code that generated it, don’t hesitate to let me know.
David Venturi (@venturidb) | Twitter
_The latest Tweets from David Venturi (@venturidb). Creating my own data science master's degree. @queensu chem eng/econ…_twitter.com
Subscribe to my newsletter
Read articles from freeCodeCamp directly inside your inbox. Subscribe to the newsletter, and don't miss out.
Written by

freeCodeCamp
freeCodeCamp
Learn to code. Build projects. Earn certifications—All for free.
