A Guide to Kubernetes Resource Optimization: Using Goldilocks with Prometheus and VPA
 Ravichandra
Introduction
Kubernetes provides unparalleled flexibility in deploying and managing containerized applications, but with this comes the challenge of optimizing resource usage. Proper resource allocation is crucial to prevent over-provisioning, which can inflate costs, and under-provisioning, which can lead to application instability.
This guide will walk you through deploying Goldilocks with Vertical Pod Autoscaler (VPA) on a Kubernetes cluster and integrating it with Prometheus for enhanced historical metrics. You'll also deploy a sample workload and learn how to visualize resource recommendations.
Prerequisites
Before starting, ensure you have the following:
kubectl: Installed and configured to access your Kubernetes cluster.
Helm: Installed for managing Kubernetes applications.
Kubernetes Cluster: A running cluster with the metrics server installed.
Basic knowledge of Kubernetes concepts (namespaces, deployments, services).
The Importance of Efficient Resource Management in Kubernetes
Challenges in Resource Allocation
Kubernetes allows you to define resource requests and limits for containers, which are critical for ensuring efficient use of cluster resources. These settings dictate how much CPU and memory a container will consume and its maximum usage. Proper configuration is vital for:
Avoiding Over-Provisioning: Excessive resource allocation can lead to wasted capacity and inflated costs.
Preventing Under-Provisioning: Insufficient resource allocation may cause throttling or out-of-memory errors, destabilizing applications.
Impact of Inefficient Resource Management
Poor resource management can have several negative effects on your cluster:
Increased Costs: Over-provisioning resources leads to higher cloud expenses without tangible performance improvements.
Application Downtime: Under-provisioned resources can cause application crashes, impacting user experience and potentially affecting revenue.
Cluster Instability: Inadequate resource allocation can result in resource contention, compromising the stability of the entire cluster.
Basics of Kubernetes Resource Management
Understanding Resource Requests and Limits
Resource Requests: Define the minimum amount of CPU and memory guaranteed to a container. Kubernetes uses these values to schedule pods on nodes that have sufficient resources available.
Resource Limits: Define the maximum CPU and memory a container can consume. Exceeding these limits can lead to throttling or termination of the container.
Properly setting requests and limits ensures that applications receive the necessary resources while avoiding unnecessary waste of cluster capacity.
Kubernetes Pod Scheduling
Kubernetes schedules pods based on resource requests, placing them on nodes with adequate available resources. If requests are set too high, nodes may be underutilized. Conversely, if requests are set too low, the pod might not be scheduled at all.
Common Pitfalls in Resource Allocation
Limits Without Requests: Setting limits without corresponding requests can result in pods running without guaranteed resources, leading to performance issues.
Overly Conservative Requests: Setting requests too high can lead to wasted resources and increased costs.
Ignoring Limits: Not setting resource limits can lead to scenarios where one pod consumes excessive resources, negatively impacting others on the same node.
Introducing Goldilocks and Vertical Pod Autoscaler (VPA)
Overview of Goldilocks
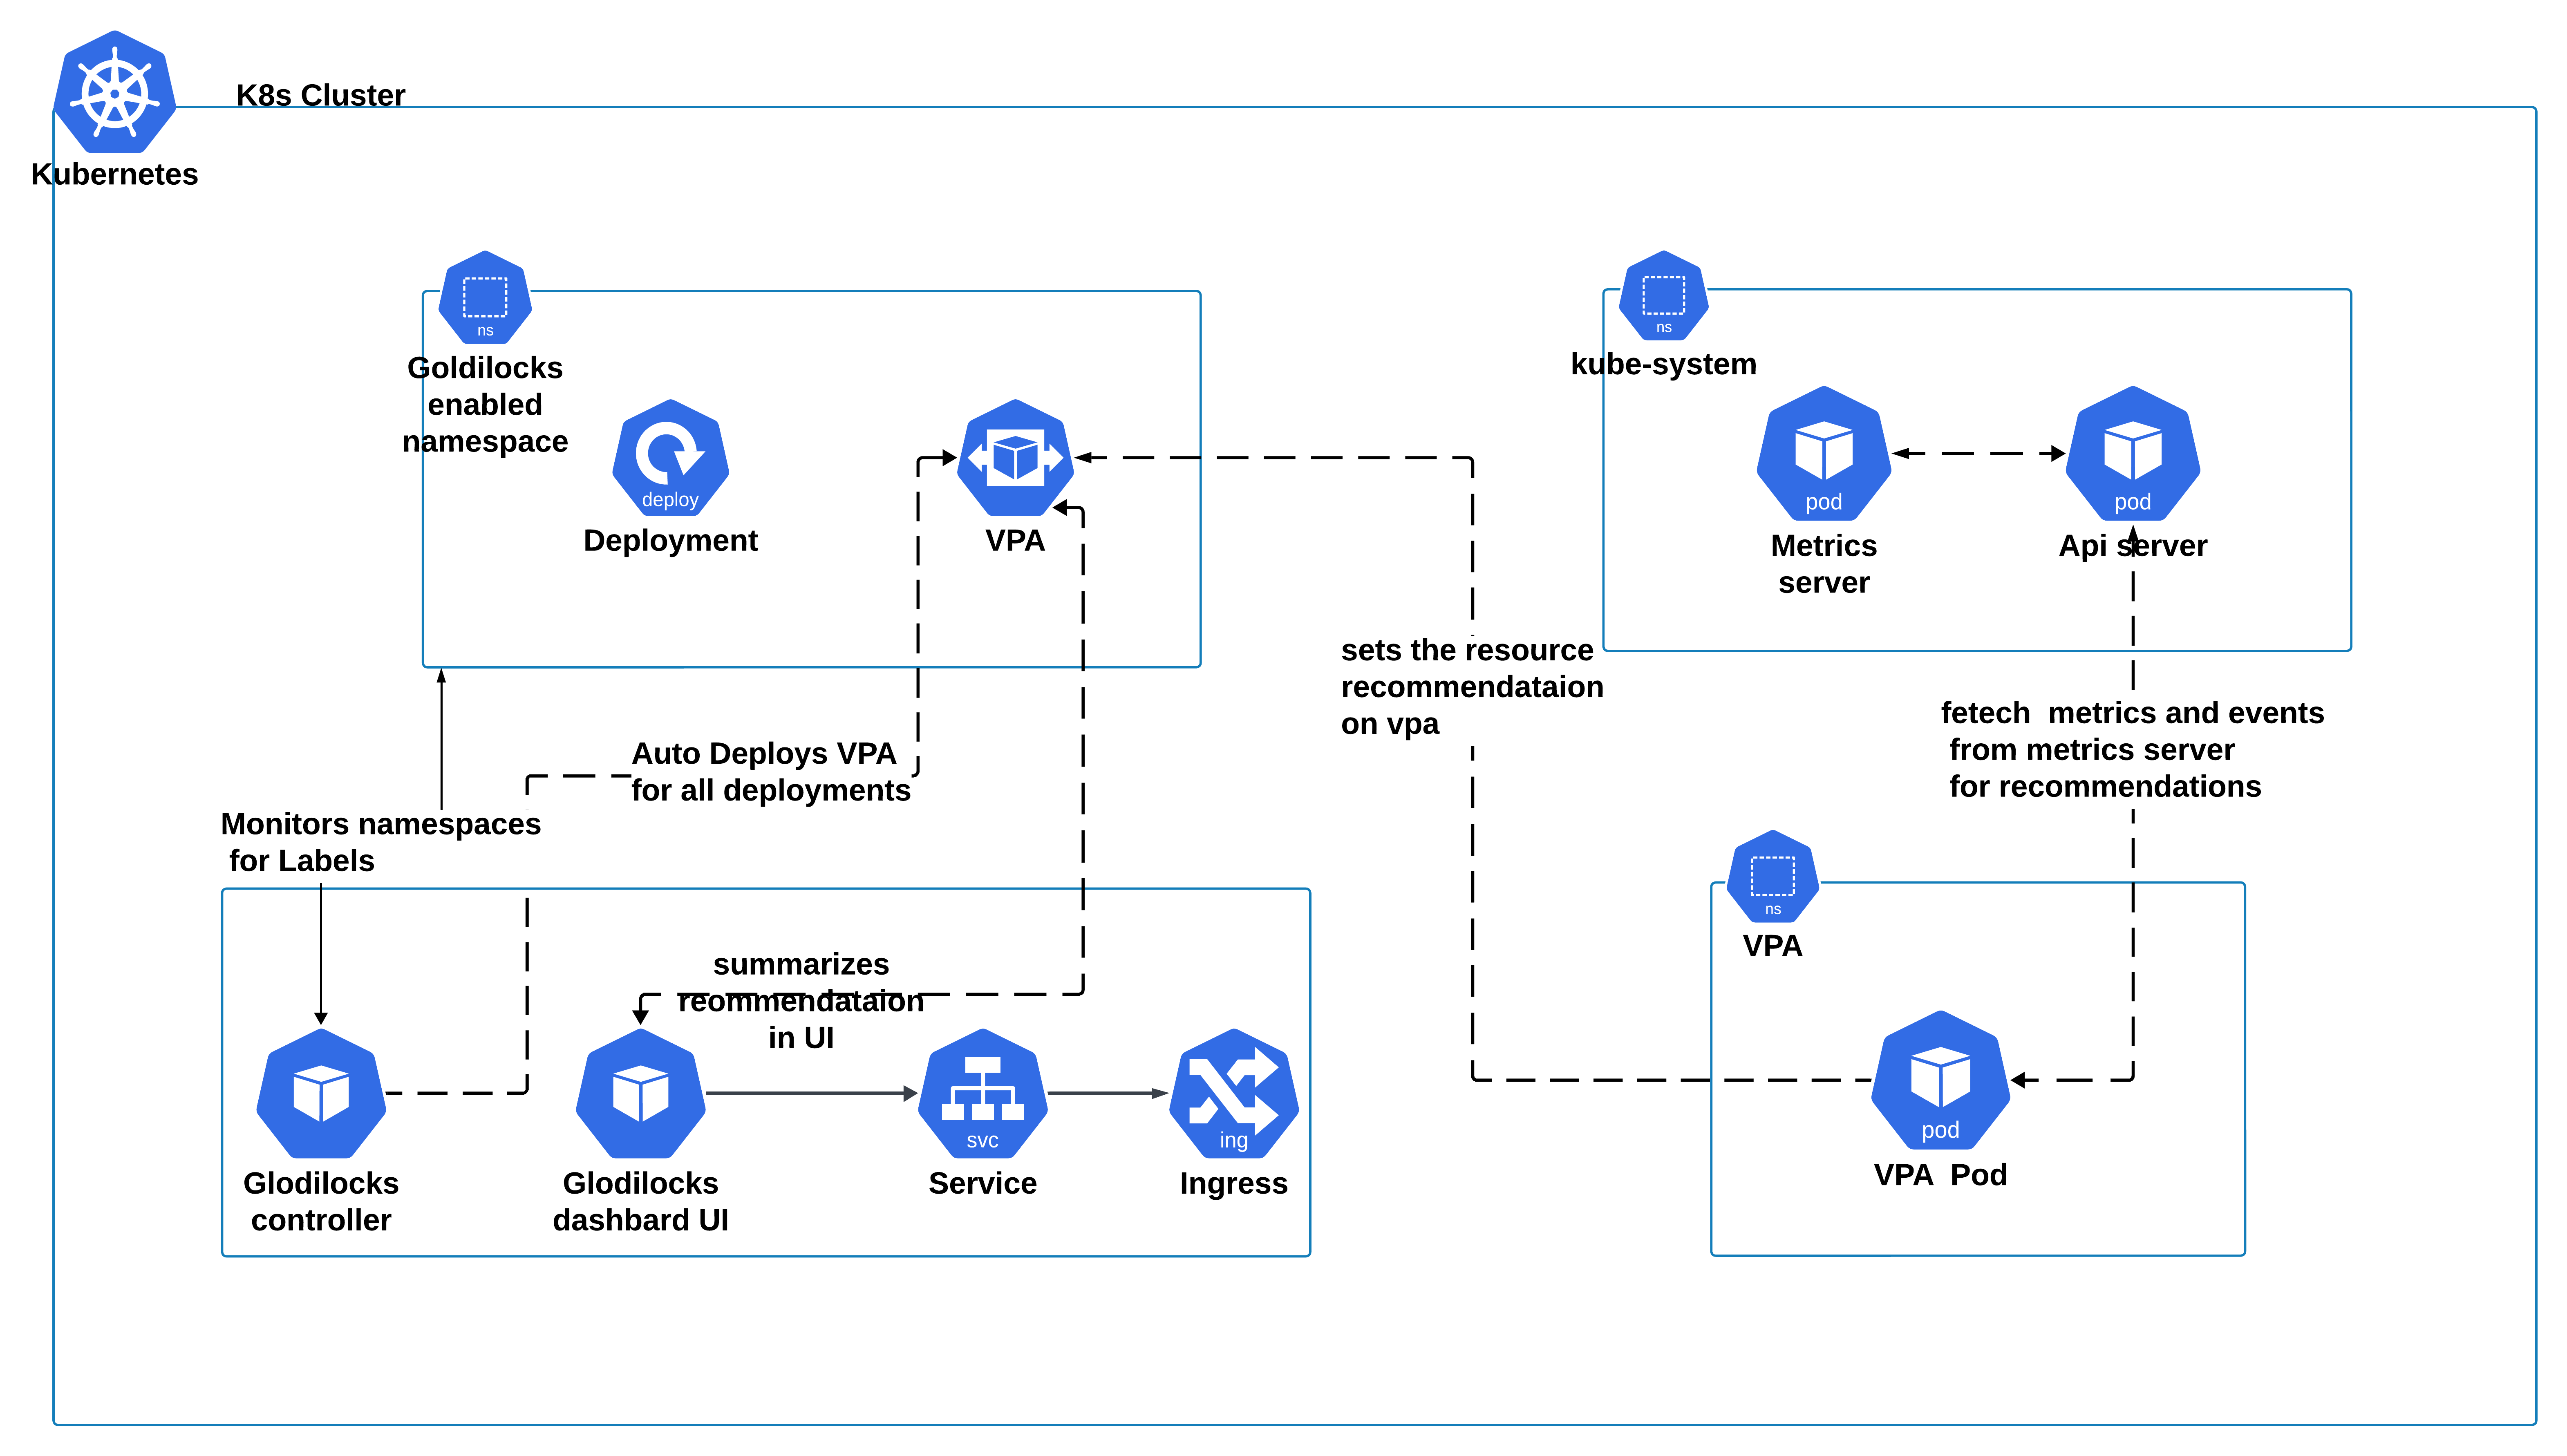
Goldilocks is a tool that simplifies the process of optimizing resource allocations by providing visibility into VPA recommendations. The main components include:
Goldilocks Controller: Monitors namespaces for the Goldilocks label and instructs VPA to generate resource recommendations.
Vertical Pod Autoscaler (VPA): Analyzes resource usage of pods and provides recommendations for optimal resource settings.
Goldilocks Dashboard: Displays VPA recommendations in an intuitive interface for easy review and application.
How Goldilocks Works
Namespace Labeling: Apply the label
goldilocks.fairwinds.com/enabled=trueto activate Goldilocks monitoring in a namespace.Monitoring Resource Usage: The Goldilocks Controller collaborates with VPA to track CPU and memory usage of pods in the labeled namespace.
Generating Recommendations: VPA processes usage data and offers recommendations for resource requests and limits.
Dashboard Visualization: Recommendations are presented in the Goldilocks Dashboard, allowing users to review and adjust settings.
Optional: Integrating Prometheus for Enhanced Accuracy
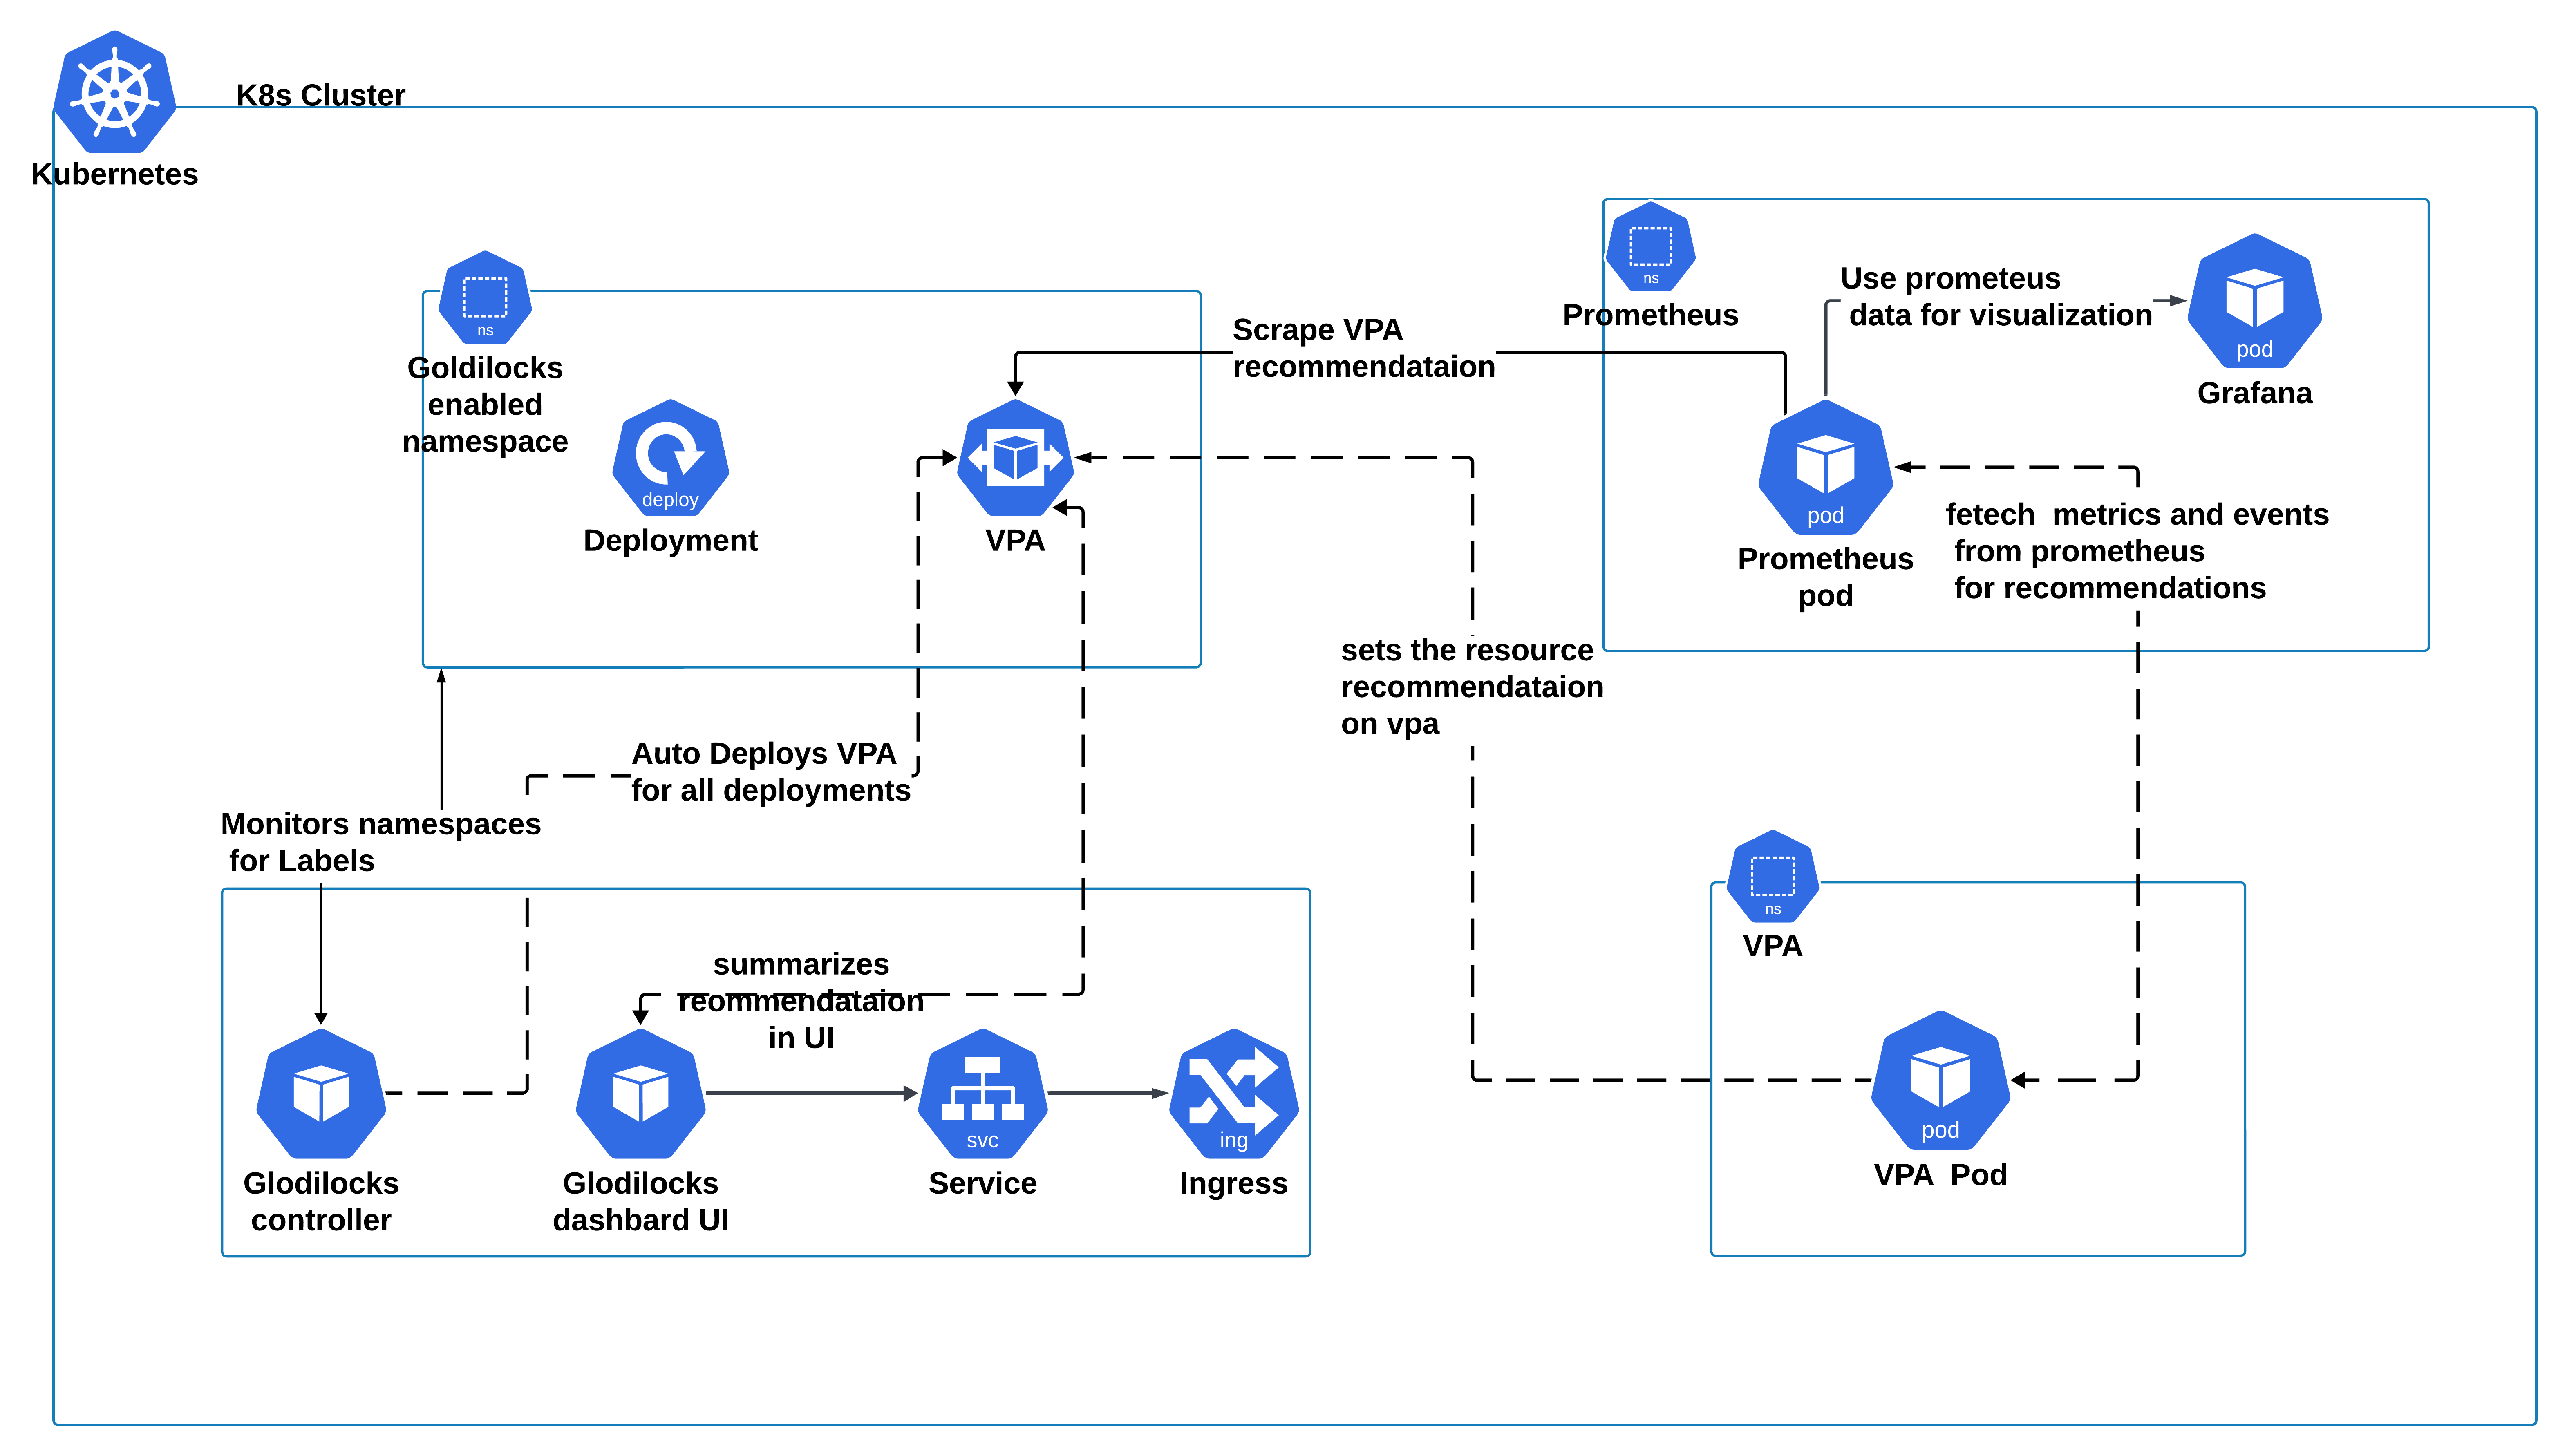
Integrating Prometheus can improve VPA recommendations by providing historical data. This integration helps in making more accurate resource recommendations based on past usage trends.
Installation and Configuration
Step 1: Set Up Your Kubernetes Cluster
We’ll use Kind (Kubernetes in Docker) to create a local cluster:
This command sets up a Kubernetes cluster named kreintoconfigs. Please checkout the link for detailed installation steps and configuration of kind cluster. kind-cluster-configuration
kind create cluster --config kind-with-kubeproxy.yaml --name kreintoconfigs
Creating cluster "kreintoconfigs" ...
 • Ensuring node image (kindest/node:v1.30.0) 🖼  ...
 ✓ Ensuring node image (kindest/node:v1.30.0) 🖼
 • Preparing nodes 📦 📦 📦 📦 📦   ...
 ✓ Preparing nodes 📦 📦 📦 📦 📦
 • Writing configuration 📜  ...
 ✓ Writing configuration 📜
 • Starting control-plane 🕹️  ...
 ✓ Starting control-plane 🕹️
 • Installing CNI 🔌  ...
 ✓ Installing CNI 🔌
 • Installing StorageClass 💾  ...
 ✓ Installing StorageClass 💾
 • Joining worker nodes 🚜  ...
 ✓ Joining worker nodes 🚜
Set kubectl context to "kind-kreintoconfigs"
You can now use your cluster with:

kubectl cluster-info --context kind-kreintoconfigs

Have a question, bug, or feature request? Let us know! https://kind.sigs.k8s.io/#community 🙂
Step 2: Install the Metrics Server
The metrics server is necessary for gathering resource usage data, which VPA and Goldilocks will use:
kubectl apply -f https://github.com/kubernetes-sigs/metrics-server/releases/latest/download/components.yaml
Step 3: Install Vertical Pod Autoscaler (VPA)
VPA helps adjust resource requests based on usage. Install it using Helm with the following configuration:
Create values.yaml for VPA:
rbac:
  create: true
admissionController:
  enabled: true
  generateCertificate: true
  registerWebhook: true
recommender:
  enabled: true
  replicaCount: 1
  resources:
    requests:
      cpu: 50m
      memory: 500Mi
updater:
  enabled: false
Install VPA:
helm repo add fairwinds-stable https://charts.fairwinds.com/stable
helm install vpa fairwinds-stable/vpa --create-namespace --namespace vpa -f values.yaml
Verify VPA installation:
kubectl get pods -n vpa
Step 4: Install Goldilocks
Goldilocks provides a dashboard for visualizing VPA recommendations. Use the following configuration:
Create values.yaml for Goldilocks:
uninstallVPA: false
vpa:
  enabled: false
  updater:
    enabled: false
metrics-server:
  enabled: false
  apiService:
    create: true
controller:
  enabled: true
  rbac:
    create: true
    enableArgoproj: true
  resources:
    requests:
      cpu: 25m
      memory: 256Mi
dashboard:
  ingress:
    enabled: true
    ingressClassName: nginx
    hosts:
      - host: goldilocks.kreintoconfigs.io
        paths:
          - path: /
            type: ImplementationSpecific
Install Goldilocks:
helm install goldilocks fairwinds-stable/goldilocks --create-namespace --namespace goldilocks -f values.yaml
Ensure Goldilocks is running:
kubectl get pods -n goldilocks
To access the ingress:
kubectl get ingress -n goldilocks
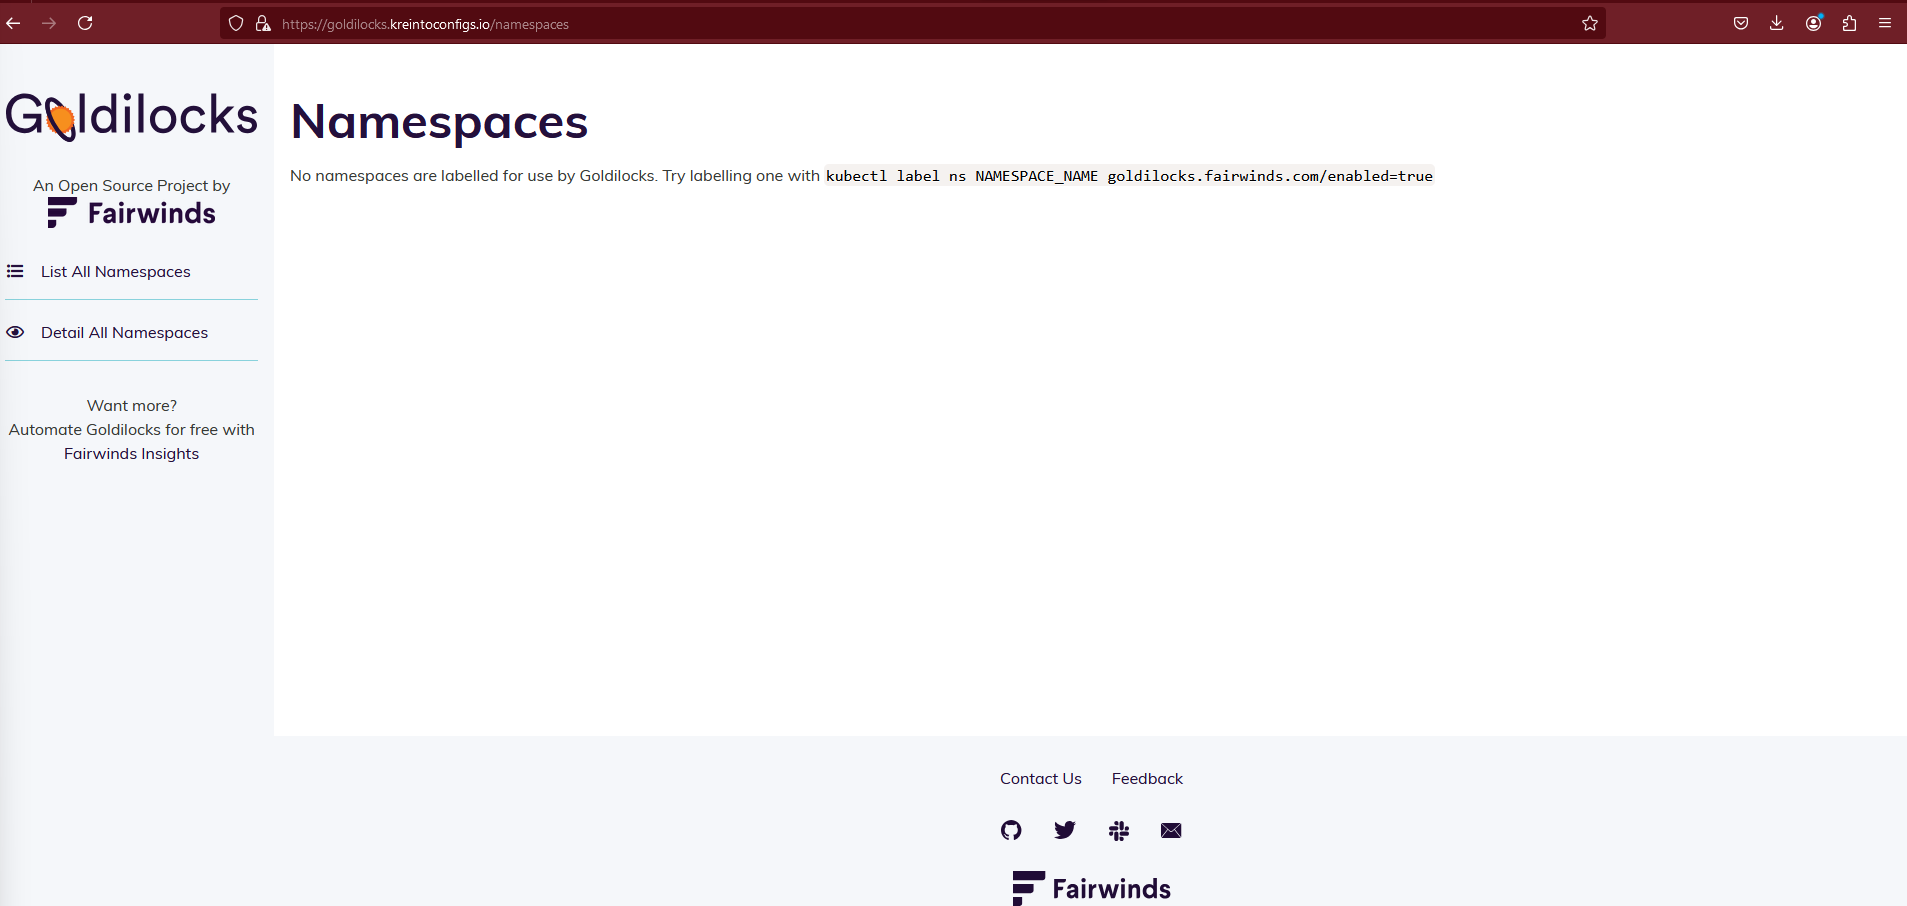
At this point, there will be no data in the UI because Goldilocks is not yet enabled for any namespace.
Step 5: Deploy a Sample Workload
Deploy a sample Nginx application to see how Goldilocks optimizes resource allocations:
kubectl create deployment nginx --image=nginx --replicas=2
kubectl expose deployment nginx --port=80 --type=ClusterIP
Enable Goldilocks monitoring by labeling the namespace:
kubectl label ns default goldilocks.fairwinds.com/enabled=true
Goldilocks will now generate VPA objects for your deployments automatically. You can verify if vpa is created or not
kubectl get vpa
NAME                          MODE   CPU   MEM   PROVIDED   AGE
goldilocks-nginx-deployment   Off                           15s
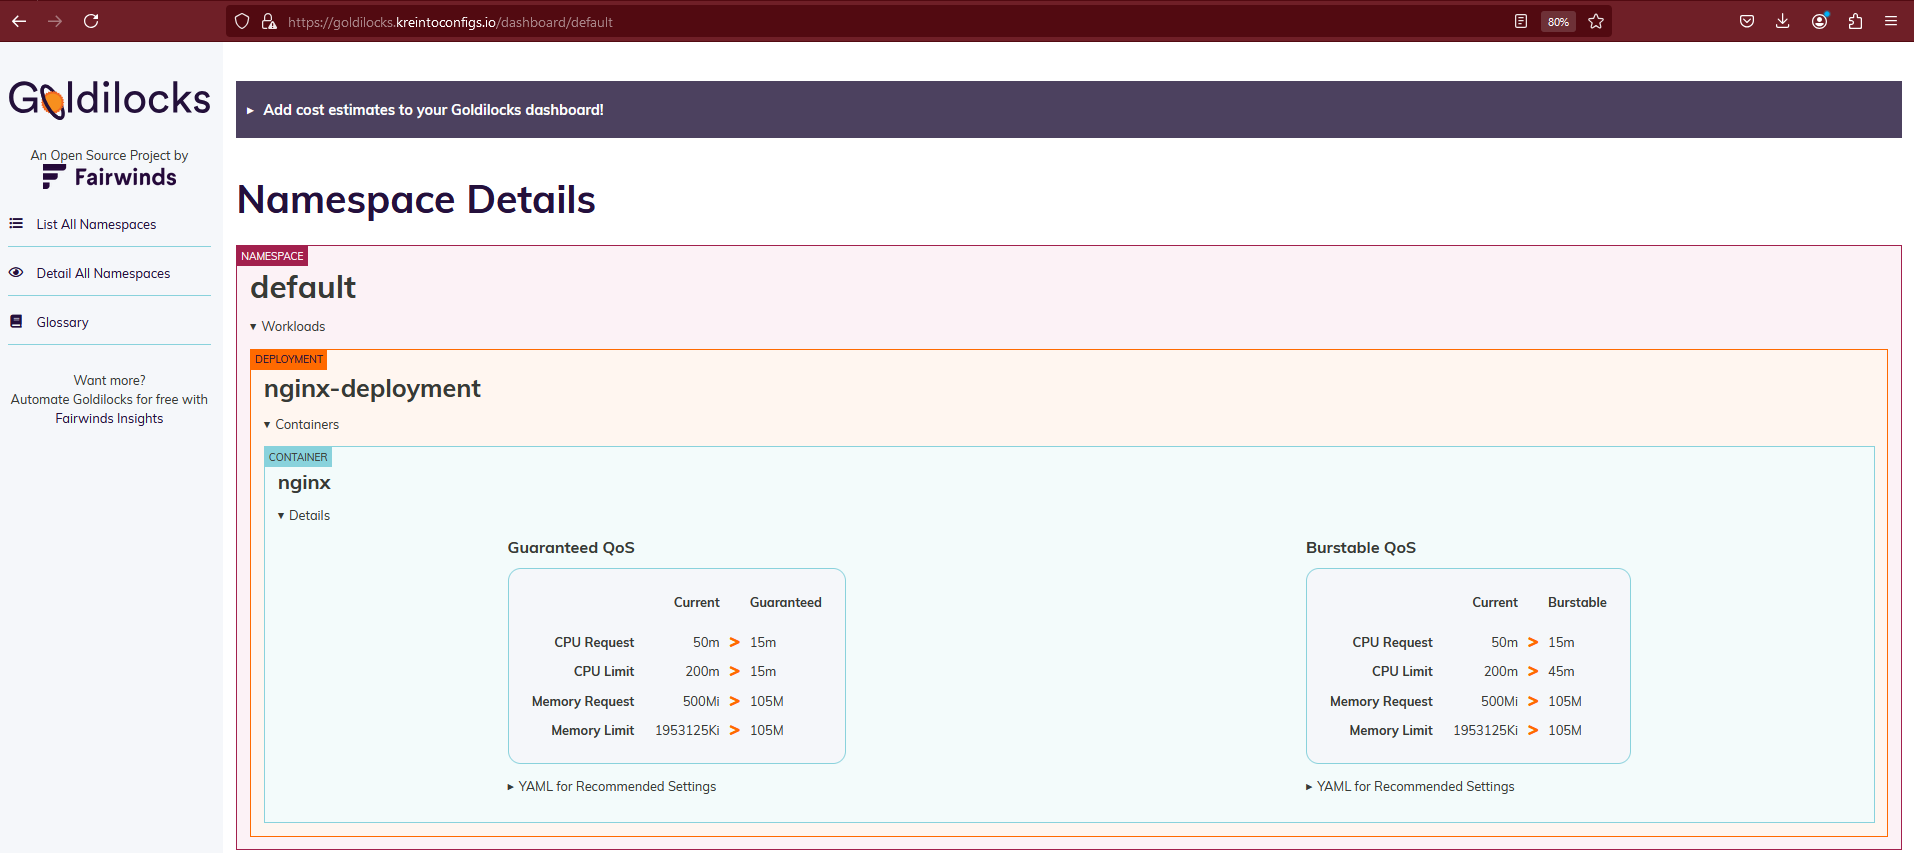
Once you've applied thegoldilocks.fairwinds.com/enabled=truelabel to your namespace, the Goldilocks tool will begin analyzing your pod resource usage. You can then view recommended resource requests and limits for your workloads in the Goldilocks dashboard or by examining the Vertical Pod Autoscaler (VPA) objects created for each workload.
kubectl describe vpa goldilocks-nginx-deployment
Name:         goldilocks-nginx-deployment
Namespace:    default
Labels:       creator=Fairwinds
              source=goldilocks
Annotations:  <none>
API Version:  autoscaling.k8s.io/v1
Kind:         VerticalPodAutoscaler
Metadata:
  Creation Timestamp:  2024-08-18T19:23:40Z
  Generation:          1
  Resource Version:    71936
  UID:                 828bfebf-43c4-46ea-b2e3-92df68773695
Spec:
  Target Ref:
    API Version:  apps/v1
    Kind:         Deployment
    Name:         nginx-deployment
  Update Policy:
    Update Mode:  Off
Status:
  Conditions:
    Last Transition Time:  2024-08-18T19:24:12Z
    Status:                True
    Type:                  RecommendationProvided
  Recommendation:
    Container Recommendations:
      Container Name:  nginx
      Lower Bound:
        Cpu:     15m
        Memory:  104857600
      Target:
        Cpu:     15m
        Memory:  104857600
      Uncapped Target:
        Cpu:     15m
        Memory:  104857600
      Upper Bound:
        Cpu:     44m
        Memory:  104857600
Events:          <none>
Step 6: Integrate Prometheus for Enhanced Metrics (Optional)
Why Integrate Prometheus?
In a dynamic Kubernetes environment, resource utilization can fluctuate due to various factors like traffic spikes, batch jobs, or changes in workload patterns. While Vertical Pod Autoscaler (VPA) provides valuable recommendations based on real-time metrics, these metrics only offer a snapshot of your current resource usage. To achieve more accurate and reliable recommendations, it's crucial to consider historical data, which is where Prometheus comes into play.
Prometheus is a powerful, open-source monitoring and alerting toolkit designed to collect and store time-series data. By integrating Prometheus with Goldilocks, you can enrich the VPA recommendations with historical performance metrics, leading to more comprehensive insights.
How It Works:
When you configure Goldilocks to use Prometheus as a metrics source, you allow it to access a broader dataset that includes not only the current resource usage but also past trends, patterns, and anomalies. This historical data enables Goldilocks to provide more nuanced recommendations, helping you identify the optimal resource allocation for your workloads.
For example, consider a workload that experiences periodic spikes in CPU usage due to a scheduled task. A VPA configured without Prometheus might recommend a CPU request based on the average usage at a given moment, potentially overlooking these spikes. However, with Prometheus, Goldilocks can account for these recurring patterns, resulting in a more accurate recommendation that ensures your application remains responsive even during peak periods.
1. Install Prometheus and Grafana:
Create values.yaml for Goldilocks:
grafana:
  enabled: true
  defaultDashboardsEnabled: true
  defaultDashboardsTimezone: utc
  defaultDashboardsEditable: true
  adminPassword: prom-operator
  ingress:
    enabled: true
    ingressClassName: nginx
    hosts:
      - grafana.kreintoconfigs.io
    path: /

kubeStateMetrics:
  enabled: true

kube-state-metrics:
  rbac:
    create: true
    extraRules:
     - apiGroups: ["autoscaling.k8s.io"]
       resources: ["verticalpodautoscalers"]
       verbs: ["list", "watch"]
  releaseLabel: true
  prometheus:
    monitor:
      enabled: true
  # https://github.com/kubernetes/kube-state-metrics/blob/main/docs/customresourcestate-metrics.md#verticalpodautoscaler
  # https://github.com/kubernetes/kube-state-metrics/issues/2041#issuecomment-1614327806
  customResourceState:
    enabled: true
    config:
     kind: CustomResourceStateMetrics
     spec:
       resources:
         - groupVersionKind:
              group: autoscaling.k8s.io
              kind: "VerticalPodAutoscaler"
              version: "v1"
           labelsFromPath:
              verticalpodautoscaler: [metadata, name]
              namespace: [metadata, namespace]
              target_api_version: [spec, targetRef, apiVersion]
              target_kind: [spec, targetRef, kind]
              target_name: [spec, targetRef, name]
           metrics:
              - name: "verticalpodautoscaler_labels"
                help: "VPA container recommendations. Kubernetes labels converted to Prometheus labels"
                each:
                  type: Info
                  info:
                    labelsFromPath:
                      name: [metadata, name]
              - name: "verticalpodautoscaler_status_recommendation_containerrecommendations_target"
                help: "VPA container recommendations for memory. Target resources the VerticalPodAutoscaler recommends for the container."
                each:
                  type: Gauge
                  gauge:
                    path: [status, recommendation, containerRecommendations]
                    valueFrom: [target, memory]
                    labelsFromPath:
                      container: [containerName]
                commonLabels:
                  resource: "memory"
                  unit: "byte"
              - name: "verticalpodautoscaler_status_recommendation_containerrecommendations_lowerbound"
                help: "VPA container recommendations for memory. Minimum resources the container can use before the VerticalPodAutoscaler updater evicts it"
                each:
                  type: Gauge
                  gauge:
                    path: [status, recommendation, containerRecommendations]
                    valueFrom: [lowerBound, memory]
                    labelsFromPath:
                      container: [containerName]
                commonLabels:
                  resource: "memory"
                  unit: "byte"
              - name: "verticalpodautoscaler_status_recommendation_containerrecommendations_upperbound"
                help: "VPA container recommendations for memory. Maximum resources the container can use before the VerticalPodAutoscaler updater evicts it"
                each:
                  type: Gauge
                  gauge:
                    path: [status, recommendation, containerRecommendations]
                    valueFrom: [upperBound, memory]
                    labelsFromPath:
                      container: [containerName]
                commonLabels:
                  resource: "memory"
                  unit: "byte"
              - name: "verticalpodautoscaler_status_recommendation_containerrecommendations_uncappedtarget"
                help: "VPA container recommendations for memory. Target resources the VerticalPodAutoscaler recommends for the container ignoring bounds"
                each:
                  type: Gauge
                  gauge:
                    path: [status, recommendation, containerRecommendations]
                    valueFrom: [uncappedTarget, memory]
                    labelsFromPath:
                      container: [containerName]
                commonLabels:
                  resource: "memory"
                  unit: "byte"
              - name: "verticalpodautoscaler_status_recommendation_containerrecommendations_target"
                help: "VPA container recommendations for cpu. Target resources the VerticalPodAutoscaler recommends for the container."
                each:
                  type: Gauge
                  gauge:
                    path: [status, recommendation, containerRecommendations]
                    valueFrom: [target, cpu]
                    labelsFromPath:
                      container: [containerName]
                commonLabels:
                  resource: "cpu"
                  unit: "core"
              - name: "verticalpodautoscaler_status_recommendation_containerrecommendations_lowerbound"
                help: "VPA container recommendations for cpu. Minimum resources the container can use before the VerticalPodAutoscaler updater evicts it"
                each:
                  type: Gauge
                  gauge:
                    path: [status, recommendation, containerRecommendations]
                    valueFrom: [lowerBound, cpu]
                    labelsFromPath:
                      container: [containerName]
                commonLabels:
                  resource: "cpu"
                  unit: "core"
              - name: "verticalpodautoscaler_status_recommendation_containerrecommendations_upperbound"
                help: "VPA container recommendations for cpu. Maximum resources the container can use before the VerticalPodAutoscaler updater evicts it"
                each:
                  type: Gauge
                  gauge:
                    path: [status, recommendation, containerRecommendations]
                    valueFrom: [upperBound, cpu]
                    labelsFromPath:
                      container: [containerName]
                commonLabels:
                  resource: "cpu"
                  unit: "core"
              - name: "verticalpodautoscaler_status_recommendation_containerrecommendations_uncappedtarget"
                help: "VPA container recommendations for cpu. Target resources the VerticalPodAutoscaler recommends for the container ignoring bounds"
                each:
                  type: Gauge
                  gauge:
                    path: [status, recommendation, containerRecommendations]
                    valueFrom: [uncappedTarget, cpu]
                    labelsFromPath:
                      container: [containerName]
                commonLabels:
                  resource: "cpu"
                  unit: "core"
  selfMonitor:
    enabled: true

prometheusOperator:
  enabled: true
prometheus:
  enabled: true
  agentMode: false
  prometheusSpec:
    persistentVolumeClaimRetentionPolicy:
     whenDeleted: Retain
     whenScaled: Retain
    retention: 30d
    storageSpec:
     volumeClaimTemplate:
       spec:
         accessModes: ["ReadWriteOnce"]
         resources:
           requests:
             storage: 2Gi
    serviceMonitorSelectorNilUsesHelmValues: true
  ingress:
    enabled: true
    ingressClassName: nginx
    hosts:
      - prometheus.kreintoconfigs.io
    path: /
helm repo add prometheus-community https://prometheus-community.github.io/helm-charts
helm install kube-prometheus-stack prometheus-community/kube-prometheus-stack --namespace monitoring --create-namespace
2. Configure VPA to Use Prometheus Metrics
By default, the Vertical Pod Autoscaler (VPA) retains up to 7 days of historical metrics. While this might be sufficient for many use cases, extending the retention period to 30 days can provide a broader view of resource usage patterns, leading to more accurate recommendations. This extension is especially useful for workloads with fluctuating usage patterns over longer periods, such as end-of-month reporting or seasonal spikes.
Why Extend Historical Metrics Retention?
Extending the retention period of metrics allows VPA to analyze a larger dataset, capturing a wider range of usage scenarios. This can result in more balanced recommendations that consider both short-term and long-term trends. For example, a workload that experiences occasional spikes may need different resource recommendations compared to one with consistent usage. With a 30-day retention period, VPA can better differentiate between these patterns, avoiding over-provisioning during peaks and under-provisioning during lulls.
Update vpa-values.yaml:
recommender:
  enabled: true
  extraArgs:
    v: "4"
    pod-recommendation-min-cpu-millicores: 15
    pod-recommendation-min-memory-mb: 100
    prometheus-address: |
      http://prometheus-agent-operated.monitoring.svc.cluster.local:9090
    storage: prometheus
    history-length: 30d
    history-resolution: 1h
    prometheus-cadvisor-job-name: kubelet
    container-pod-name-label: pod
    container-name-label: container
    metric-for-pod-labels:  kube_pod_labels{job="kube-state-metrics"}[30d]
    pod-namespace-label: namespace
    pod-name-label: pod
Upgrade VPA:
helm upgrade vpa fairwinds-stable/vpa --namespace vpa -f vpa-values.yaml
Considerations
Performance Impact: Storing a larger amount of historical data can increase the load on both your monitoring system (e.g., Prometheus) and the VPA itself. Ensure that your infrastructure can handle the increased data volume without performance degradation.
Fine-Tuning: The 30-day retention period is a starting point, but it may require adjustment based on your specific workload patterns and infrastructure capacity. You may need to perform load testing and adjust the retention period accordingly to achieve optimal results.
Data Relevance: While more data can lead to better recommendations, it's important to balance this with the relevance of the data. Older data might not always reflect current usage patterns, especially in environments with rapidly changing workloads.
Extending the retention period for historical metrics allows the VPA to make more informed and precise recommendations, enhancing the optimization of your Kubernetes environment. With an extended retention period, VPA can analyze a broader dataset, leading to more accurate resource adjustments.
Once VPA is configured, it will automatically start using the metrics from Prometheus to generate its recommendations.
Since Goldilocks doesn't have built-in authentication, it's a good practice to send the recommendation metrics to Prometheus. This approach enables secure visualization through Grafana, ensuring that your metrics are accessible only through a secured interface.
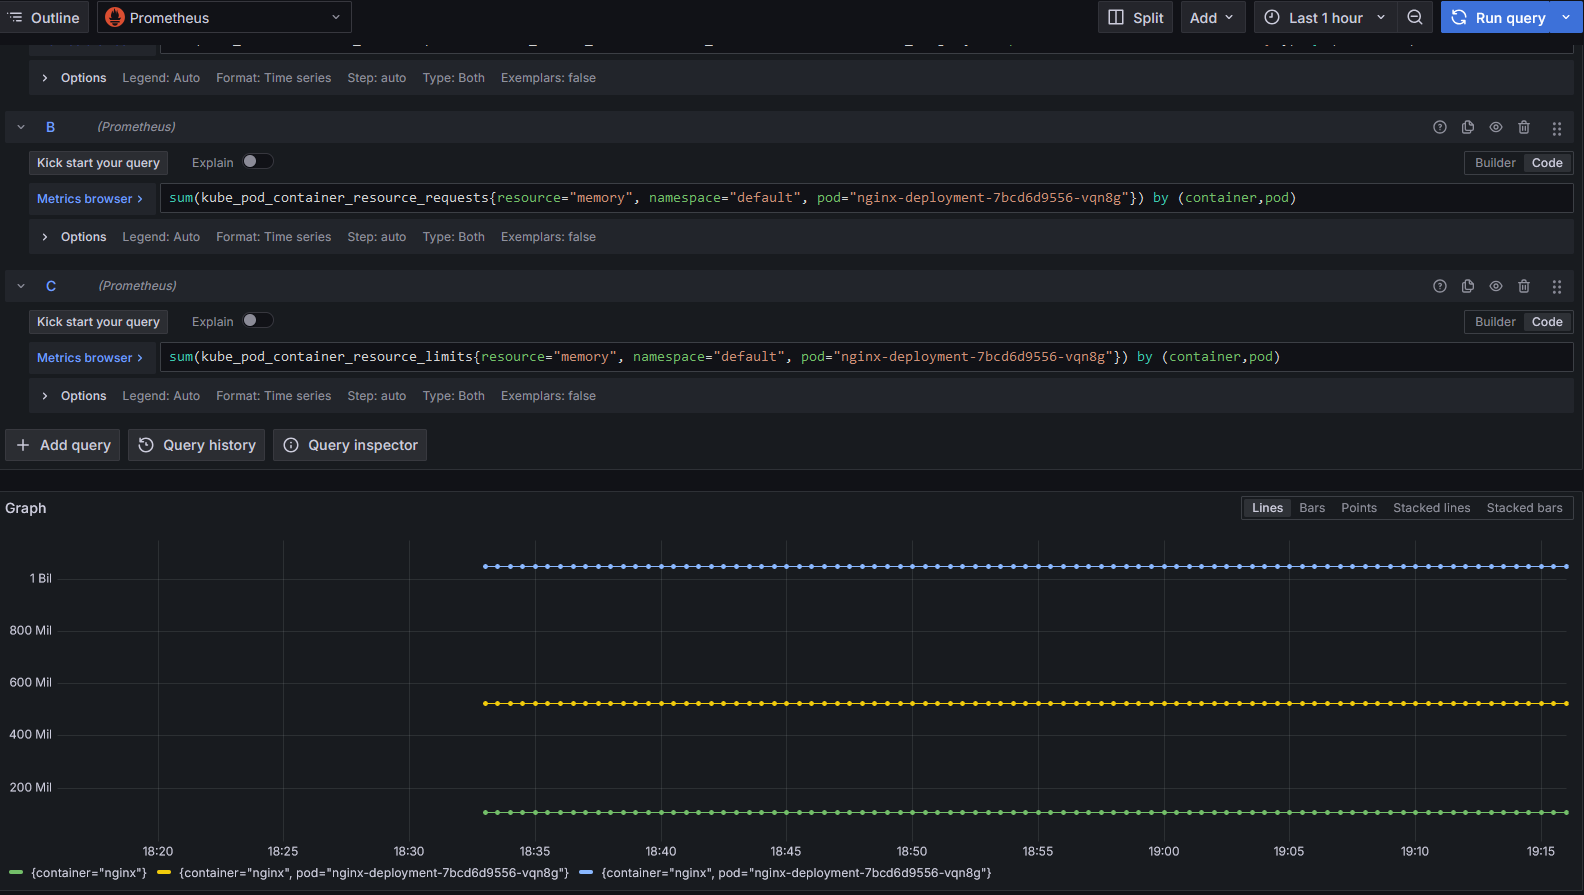
Step 8: Securing Goldilocks Dashboard (Optional)
Since Goldilocks does not include built-in authentication, you can either add a layer of security with an OAuth proxy or use Grafana to visualize the recommendations securely. Alternatively, you can scale down the Goldilocks dashboard deployment to zero replicas to disable it when not needed.
Conclusion
With Goldilocks and VPA set up on your Kubernetes cluster, and optionally enhanced with Prometheus for deeper insights, you're now equipped to maintain an optimized, cost-effective environment. Regularly review and apply the recommendations provided by Goldilocks to ensure your applications remain stable and your resources are efficiently utilized.
This guide has taken you through each step—from setting up your cluster to deploying sample workloads and integrating with Prometheus. By following these practices, you can confidently manage resources in your Kubernetes cluster, ensuring both performance and cost efficiency.
Subscribe to my newsletter
Read articles from Ravichandra directly inside your inbox. Subscribe to the newsletter, and don't miss out.
Written by

Ravichandra
Ravichandra
A DevOps consultant with a robust background in cloud technologies and infrastructure management. With extensive experience across Linux systems, AWS, GCP, and database administration, I specialize in cloud architecture and cost optimization. My journey includes deep expertise in Kubernetes, particularly with Amazon EKS and GKE, where I focus on optimizing cloud resources and enhancing system performance. I’m passionate about solving complex problems and improving efficiencies through innovative cloud strategies. This blog marks my debut into tech writing, where I’ll share my insights and practical tips on navigating the dynamic world of cloud infrastructure and Kubernetes management. I’m excited to connect with fellow tech enthusiasts and professionals as I embark on this new blogging adventure!