Analysing and Visualising Time Series Data with the NottemWeather Dataset
 Ogaga Agofure
Time series analysis is essential for understanding patterns, trends, and seasonality in datasets with time-dependent information. In this blog, I'll guide you through analysing and visualising weather data from this repository. You can find the whole project here.
This repository provides a dataset of monthly average temperatures in Nottingham from 1920 to 1939 and uses R for analysis and visualisation. Here's a work breakdown with code snippets and resources for further reading.
Dataset Overview
The dataset contains monthly average temperatures for Nottingham over the past twenty years. Time series analysis helps identify trends and seasonal patterns.
Setup
First, let's install the required packages and read the data. You can use the built-in sample data library or download the data from here.
# Install necessary packages
install.packages("ggplot2")
install.packages("forecast")

# Load libraries
library(ggplot2)
library(forecast)

# Load dataset
data <- read.csv("Nottemweather.csv")
Time Series Plot
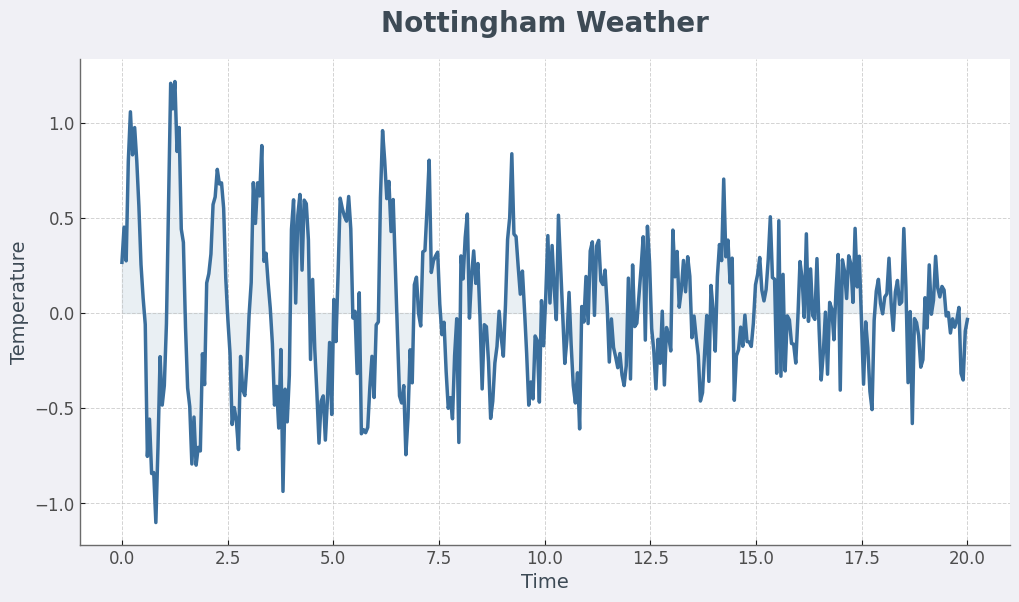
We begin by plotting the time series to visually inspect trends or seasonality.
# Convert data to time series object
nottem_ts <- ts(data$Temperature, start = c(1920, 1), frequency = 12)

# Plot time series
autoplot(nottem_ts, main = "Nottingham Monthly Temperatures (1920-1939)", ylab = "Temperature (°C)")
This produces a simple but insightful plot showing temperature variations over the years.
Decomposing the Time Series
To delve deeper, we decompose the time series into its components—trend, seasonality, and noise:
# Decompose time series
decomposed_ts <- decompose(nottem_ts)

# Plot components
autoplot(decomposed_ts, main = "Decomposition of Time Series")
Forecasting Future Temperatures
Finally, we can use the ARIMA model for forecasting:
# Fit ARIMA model
fit <- auto.arima(nottem_ts)

# Forecast for the next 24 months
forecast_values <- forecast(fit, h = 24)

# Plot forecast
autoplot(forecast_values, main = "Temperature Forecast for Next 2 Years")
Conclusion
This analysis demonstrates the ease of working with time-series data in R using the NottemWeather dataset. My GitHub has a more detailed analysis explaining the trend, seasonality, and how to choose the best model.
Happy coding!
Subscribe to my newsletter
Read articles from Ogaga Agofure directly inside your inbox. Subscribe to the newsletter, and don't miss out.
Written by

Ogaga Agofure
Ogaga Agofure
I am a professional Cloud DevOps Engineer. I work with our engineering team to identify, assess and implement the most optimal and secure cloud-based solutions.