GSOC 2024 – The Virtual Brain (FINAL REPORT)
 Priya
Priya
This blog describes the work done during the GSOC period for The Virtual Brain (INCF) organization.
PROJECT GOALS
Simulating the human brain is the holy grail of neuroscience – offering a pioneering tool for understanding how our brain works and how to deal with its disorders like stroke, epilepsy or neurodegenerative diseases like Alzheimer’s or Parkinson’s.
While large-scale research initiatives simulate neurons and small brain regions at the cellular level on massively parallel hardware, they are still years away from clinical applications.
The Virtual Brain (TVB) takes a different approach and reduces complexity on the micro level to attain the macro organization: a TVB model of a patient's brain generates sufficiently accurate EEG, MEG, BOLD and SEEG signals by reducing the complexity millionfold through methods from statistical physics. The key is TVB’s hybrid approach of merging individual anatomy from brain imaging data with state-of-the-art mathematical-modeling.
In the TVB ecosystem there is a new code repository called tvb-widgets offering neat UI widgets for Jupyterlab environments. These widgets are compatible with TVB data formats and able to display these data in different forms: 2D, 3D.
The purpose of this project is to implement a new set of widgets, which would allow users to work in Jupyter Lab with the connectivity matrices.
MENTORS
Lia Domide, Romina Baila, Teodora Misan
MY CONTRIBUTION
During this time, I have implemented two new widgets in the tvbwidgets repository.
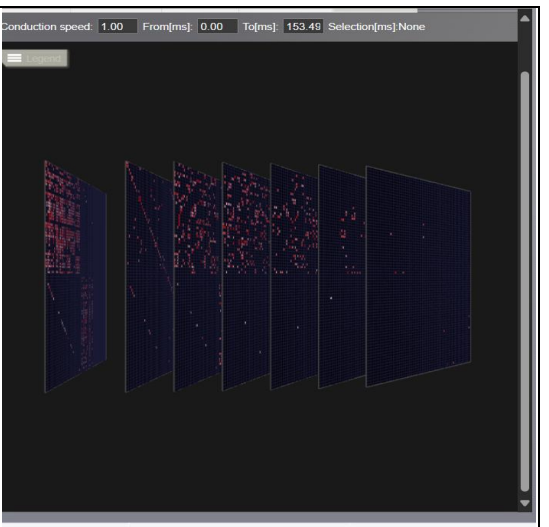
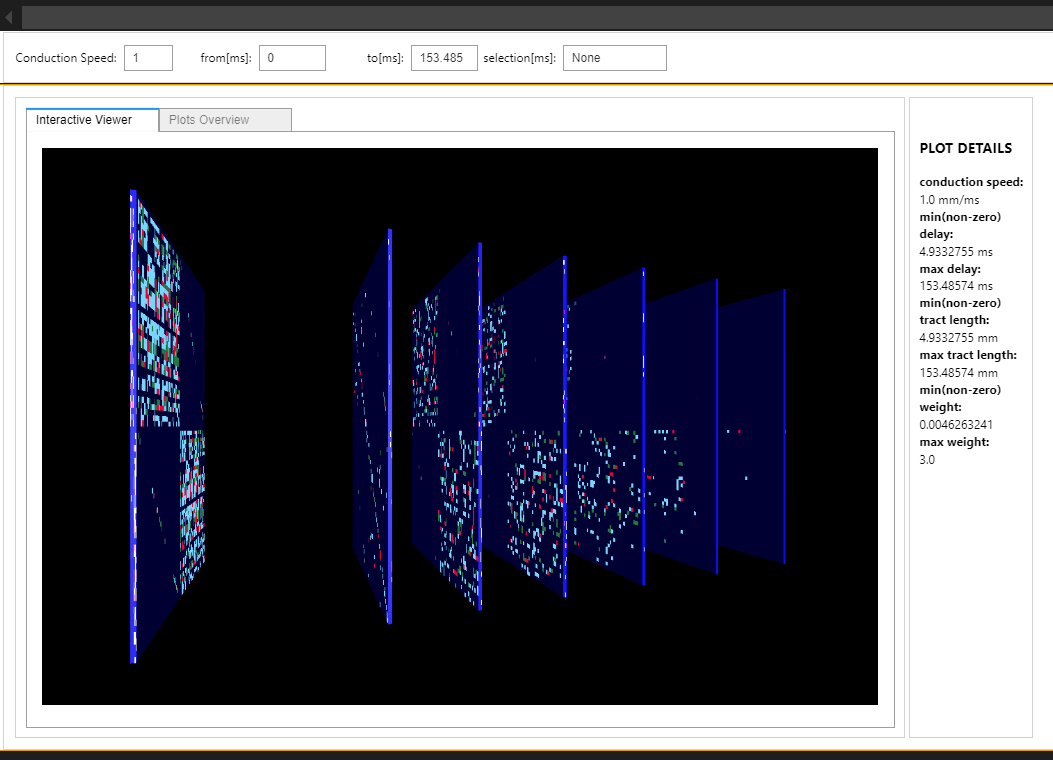
A Spacetime widget which displays a large-scale Connectivity split into time slices, based on the delays of passing the signals to adjacent regions.
The original Spacetime visualizer in tvb-web -
The Spacetime widget in tvbwidgets -
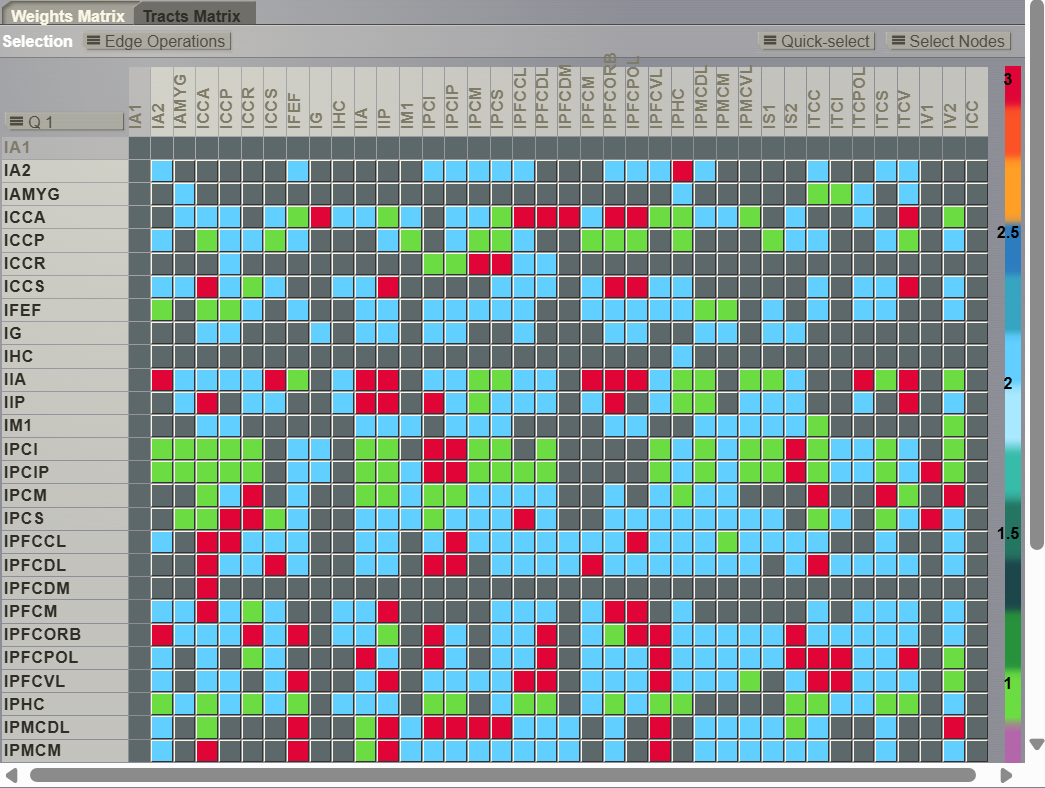
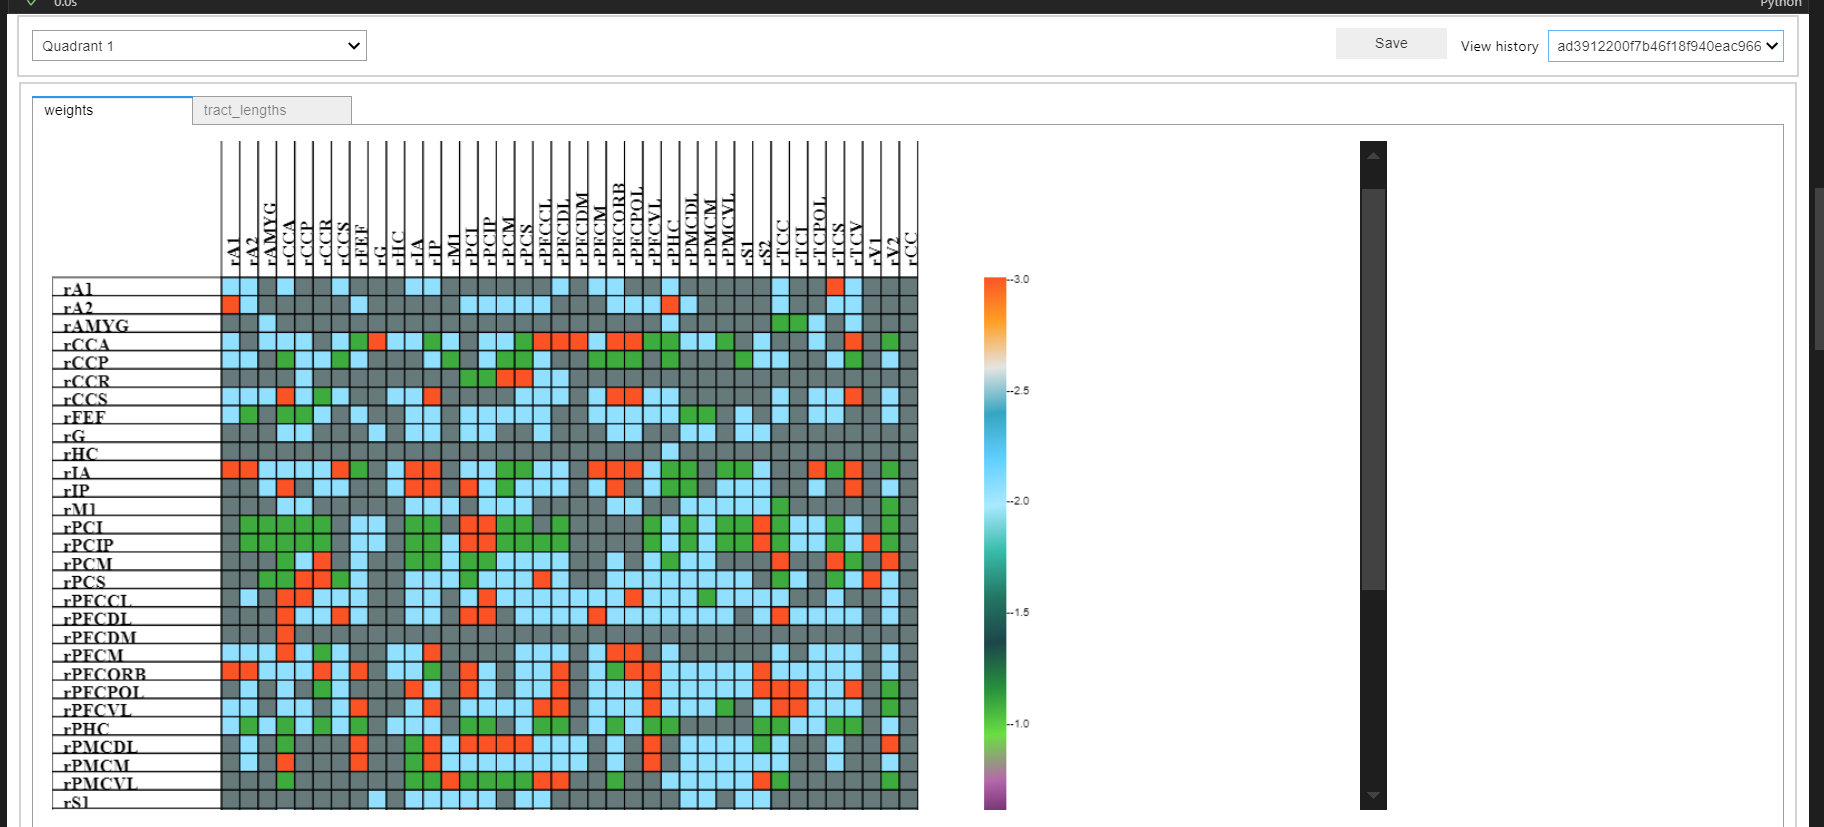
A Connectivity Matrix Editor widget which lets you edit the connectivity weights or tract lengths, save the new connectivity, and view saved connectivities.
The original connectivity Matrix Editor in tvb-web -
The Connectivity Matrix Editor widget in tvbwidgets -
Here are the pull requests -
LIBRARIES
Ipycanvas, Ipywidgets, Pythreejs
WEEKLY PROGRESS
WEEK - 1
After the kick-off call, I started implementing the space-time widget, which was the first task, I had already prepared a mock-up for the proposal, so I had the idea of what exactly I had to do, I just had to code it.
I created a scene using the Pythreejs library, I had to show the graphs, I used flattened 3D box geometry for that, I displayed the graph as a texture mounted on that box and implemented functions which would take the connectivity data and preprocess it.
I did face challenges during setting up the project in editable mode and making the grid lines, I experimented a lot, and finally got good grid lines, but I enjoyed that process.
By the end of first week however I was in confusion, that it was not necessary to show the graphs in 3D, they could have just been displayed nicely in 2D, it would have been less complicated and neat. My mentor had told me about it, So I talked about this to my mentor, so we agreed on displaying both 2D and 3D views as different tabs.
WEEK - 2
I had three goals for this week. As suggested by my mentor, I began working on the 2D graphs, I displayed the graphs in a nice grid using matplotlib's gridspec.
Then I started working on picking the slices, I had to use pythreejs picker class for that, but I was stuck so, I looked at threejs docs, blogs, and honestly, I was fascinated by all the examples of 3D animation given there, then I searched on GitHub for similar projects to get an idea, it really helped me. Earlier, I was thinking of using a raycaster, it was good knowing about new concepts, I watched couple of videos on raycaster, but I didn't need it eventually.
Then I implemented some options for time range and conduction speed as I thought it would be a smaller task, it was pretty much smooth, but I got into another problem, the changes were taking place too slowly after selecting the options, it was because of the grid.
Because, to display the grid, I was repeating the data the five times, so that the thickness of grid lines is 1/5th. But it was causing the 5 times more calculation. That was a bad idea. I had to separate the grid from the graph texture so that the grid texture is only calculate once and not every time an option's value is changed. So, I displayed two objects on the same place, making one's texture transparent with a grid and another's had the graph
Overall, this week was adventurous, the whole approach was basically experimenting a lot till getting desired result. I had to make tradeoffs too between speed and looks, and I learnt many new things.
WEEK - 3
This week, I wrote tests for the spacetime widget, I felt a bit like I am not doing well. And there were some issues with the spacetime widget. I worked on fixing those. Also, I am using chatgpt and copilot quite a lot during my work, so, I felt like whether I am using AI tools the right way or not? Will taking help of these tools affect my learning ?
WEEK - 4
This week I started with fixing things, like removing unused import, fixing hardcoded values, then increasing text area, fixing some tests, then I had to make two features - an option for showing the picked slice and an option for plot details, I worked on those.
But before that I had some confusion, so I had a call with my mentor, we discussed things, and come up with additional things to implement. I had some doubt about strange behavior of the widget I asked that doubt to my mentor, after that I had completed first widget and told my mentor, then I began moving on the second widget, I started making the widget, 3 features are implemented in that widget till now.
WEEK - 5
My intended approach for making the second widget did not work, I wanted to use a library called ipydatagrid to show the interactive grid in jupyterlab and I did implement some features of the widget using that library but soon I began to realize that it was a smaller library and was not suitable for many behaviors that I wanted from the grid. Also, It did not had much documentation so it was not that easy for me to work with it. So, I began looking for other approaches. I finally re-implemented that widget using a different library called ipycanvas. It is better than the previous one.
WEEK - 6
This week I began with finishing up things with the second widget, So, I made rotated titles, I made grids, colorbars, then made options for quadrants, then I created a pull request for the second widget. I was quite happy with my work so far. After that I worked on saving connectivity, I looked at already implemented widgets to get an idea, and implemented it based on a previous widget. Overall, I am quite happy with this week’s performance of mine.
WEEK - 7
I had to solve an issue which my mentor had mentioned so I worked on that and it was a tough one, I spent two days on solving that, then I asked my mentor what to do next but I found out that there are more bugs in my code, also there have been lately some issues with skype on my pc, it's not behaving properly, it stopped during some of the weekly calls.
WEEK - 8
I wrote a blog for the final submission, also did the rebase for my second pull request.
ACKNOWLEDGEMENTS
GSoC 2024 has been a great learning opportunity for me. I have learnt so many new skills and got familiar with new topics. I would like to thank my mentors – Lia Domide, Romina Baila and Teodora Misan for their guidance and support during the GSoC period. Also, thanks to Google for organizing such a wonderful program.
Subscribe to my newsletter
Read articles from Priya directly inside your inbox. Subscribe to the newsletter, and don't miss out.
Written by
