Optimize Memory Management in JavaScript Pivot Table: Best Practices and Tips
 syncfusion
TL;DR: Learn the best practices for optimizing memory management in Syncfusion JavaScript Pivot Table, including tips on virtual scrolling, data processing, and memory profiling to ensure smooth performance with large datasets.
Memory management is crucial in optimizing web applications, especially when handling large datasets and complex data visualizations.
Syncfusion JavaScript Pivot Table is a robust tool for analyzing and displaying data. However, ensuring that it runs efficiently requires effective memory management strategies.
This blog will cover the best practices and tips for optimizing memory usage in the JavaScript Pivot Table, allowing for smoother performance and better user experience.
Understanding the memory challenges
When working with large datasets, the Pivot Table can consume significant memory, leading to performance issues such as slow rendering times, laggy interactions, and potential browser crashes. The key challenges include:
Large data sets – Rendering thousands of rows and columns can overwhelm memory resources.
Complex calculations – Aggregating and calculating real-time data can be resource-intensive.
Frequent updates – Dynamic data that frequently updates can lead to memory leaks if not appropriately managed.
Memory consumption test results
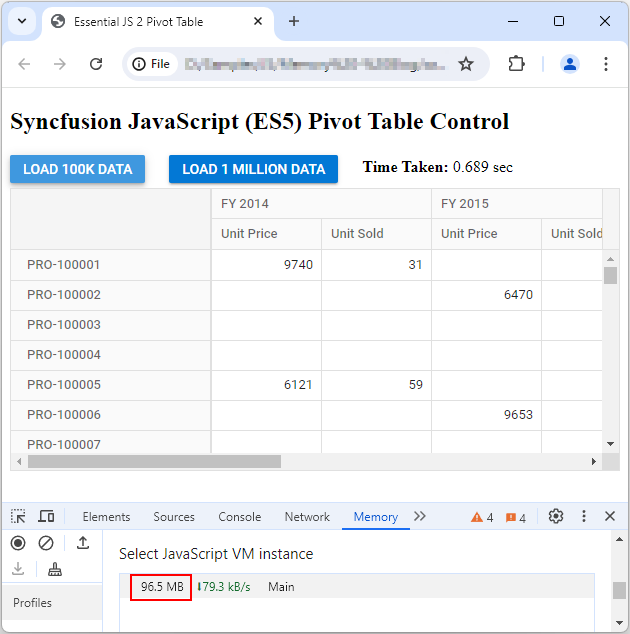
We obtained the test results in the Chrome browser by binding JSON data to the JavaScript Pivot Table via client and server engine modes. The following table shows the browser memory consumed to bind the 100K and 1 million unique dataset counts to the Syncfusion JavaScript Pivot Table.
| Unique dataset count | Rendering mode | Memory consumption (In MB) |
| 100K | Client | 96.5 |
| Server | 19.5 | |
| 1 million | Client | 792 |
| Server | 20.4 |
The following image shows the Chrome browser’s memory consumption for 100K and 1 million data points using the client-side engine.
100K data:

Memory usage for 100K data in the Chrome browser
1 million data:

Memory usage for 1 million data in the Chrome browser
Note: Memory usage may vary depending on the pivot report configuration and features enabled.
Best practices for memory management in JavaScript Pivot Table
Let’s see some of the best practices to optimize memory management in the JavaScript Pivot Table component:
Virtual scrolling or paging
Loading large data is one of the primary causes of increased memory usage. Implementing virtual scrolling or paging allows us to load data for the current viewport alone and load the remaining data on demand instead of loading all rows and columns in the Pivot Table. This will reduce the initial loading time and memory usage.
var pivotGridObj = new ej.pivotview.PivotView({
    enableVirtualization: true, // Enable virtualization to load data as needed.
    enablePaging: true, // Enable paging and page settings to load data as needed.
    pageSettings: {
        rowPageSize: 10,
        columnPageSize: 5,
        currentColumnPage: 1,
        currentRowPage: 1
    },
    dataSourceSettings: {
        dataSource: largeDataSet,
        columns: [{ name: 'Product' }],
        rows: [{ name: 'Country' }],
        values: [{ name: 'Sales', caption: 'Total Sales' }]
    }
});
pivotGridObj.appendTo('#PivotView');
Dispose of unused instances
Properly dispose of the JavaScript Pivot Table instances when they are no longer needed to free up memory.
Refer to the following code example.
function destroyPivotTable() {
    if (pivotGridObj) {
        pivotGridObj.destroy(); // Method used to destroy the Pivot Table.
        pivotGridObj = null;
    }
}
Optimize data processing
Reduce the number of real-time calculations and aggregations by preprocessing data on the server-side engine whenever possible.
var pivotObj = new ej.pivotview.PivotView({
    dataSourceSettings: {
        url: 'https://localhost:44350/api/pivot/post', // Preprocess data using the server-side engine to minimize client-side processing.
        mode: 'Server',
        rows: [{
            name: 'ProductID', caption: 'Product ID'
        }],
        columns: [{
            name: 'Year', caption: 'Production Year'
        }],
        values: [
            { name: 'Sold', caption: 'Units Sold' },
            { name: 'Price', caption: 'Sold Amount' }
        ],
    }
    //Other codes here...
});
pivotObj.appendTo('#PivotTable');
Optimize the Pivot Table rendering
Use efficient rendering techniques to minimize the Pivot Table’s memory usage. This includes avoiding unnecessary re-renders and refreshing the Pivot Table’s UI only when it has changed. When necessary, use the public functions originally used to refresh the Pivot Table; otherwise, update the Pivot Table through property binding.
For example, we can use the dataSource and dataSourceSettings properties to dynamically change data or bound field settings such as row, column, value, and filter axes. This will update the Pivot Table.
Refer to the following code example.
var pivotObj = new ej.pivotview.PivotView({
    dataSourceSettings: {
        dataSource: window.pivotData, // Assign the data to the Pivot Table.
        rows: [{
            name: 'ProductID', caption: 'Product ID'
        }],
        columns: [{
            name: 'Year', caption: 'Production Year'
        }],
        values: [
            { name: 'Sold', caption: 'Units Sold' },
            { name: 'Price', caption: 'Sold Amount' }
        ],
    }
    //Other codes here...
});
pivotObj.appendTo('#PivotTable');

var applyBtn = new ej.buttons.Button({
        isPrimary: true
});
applyBtn.appendTo('#update');
document.getElementById(update'').onclick = function () {
     // Set the modified/updated data to the Pivot Table using the ‘dataSource’ property.
     pivotObj.dataSourceSettings.datasource = updatedPivotData;

     // Set the formatting to the value field “Price” using the ‘formatSettings’ property within the ‘dataSourceSettings’.
     pivotObj.dataSourceSettings.formatSettings = [{ name: 'Price', format: 'C0' }];
}
Regular memory profiling
Regularly profile your app’s memory usage to identify potential leaks and improve performance. The recommended tools for memory profiling are:
Chrome DevTools: Use the Performance and Memory tabs to monitor memory utilization and detect leaks.
Firefox Developer Tools: Like Chrome DevTools, it provides precise insights into memory consumption.
GitHub reference
Also, refer to the optimizing memory management in the JavaScript Pivot Table GitHub demo. Here, the client-side engine is used to collect the performance and memory statistics.
Conclusion
Thanks for reading! In this blog, we’ve seen how to optimize memory management in the Syncfusion JavaScript Pivot Table. By applying a combination of efficient data handling, proper instance disposal, and virtualization techniques, you can ensure your Pivot Table performs seamlessly, even with large datasets, providing a smooth and responsive experience for users.
Implementing these best practices helps you effectively manage memory utilization, leading to enhanced performance and a better overall user experience. Try out these tips and leave your feedback in the comments section given below!
If you’re already a Syncfusion user, the latest version of Essential Studio is available on the License and Downloads page. We offer our new users a 30-day free trial to explore all our components’ features and capabilities.
If you need further assistance, contact us via our support forum, support portal, or feedback portal. We’re always here to help!
Related blogs
Subscribe to my newsletter
Read articles from syncfusion directly inside your inbox. Subscribe to the newsletter, and don't miss out.
Written by

syncfusion
syncfusion
Syncfusion provides third-party UI components for React, Vue, Angular, JavaScript, Blazor, .NET MAUI, ASP.NET MVC, Core, WinForms, WPF, UWP and Xamarin.