Real-Time Log Monitoring with Splunk using Docker and Terraform
 Sakeena Shaik
Project Overview
Automated the provisioning and configuration of AWS EC2 instances to run Splunk Enterprise and Splunk Universal Forwarder in Docker containers using Terraform. Established a Docker Bridge network for seamless container communication, securely managed Splunk passwords with HashiCorp Vault, and used AWS SSM for Vault token retrieval. The setup ensures automated data ingestion into the Splunk indexer, dynamic creation of security groups and key pairs, and real-time monitoring of various logs using Splunk's NIX app. Created dashboards for effective log visualization and event handling.
PREREQUISITES:
1) Aws account creation
Check out the official site to create aws account Here
2) Terraform Installed
Check out the official website to install terraform Here
3) GITHUB Account
4) Hashicorp vault to store secrets
Follow the steps in the blog below, which includes the complete process of installing Vault, adding policies, retrieving role ID and secret ID, before integrating with Terraform.
5) Code editor (Vscode)
Download it from Here
6) AWS CLI Installed
Navigate to the IAM dashboard on AWS, then select "Users." Enter the username and proceed to the next step

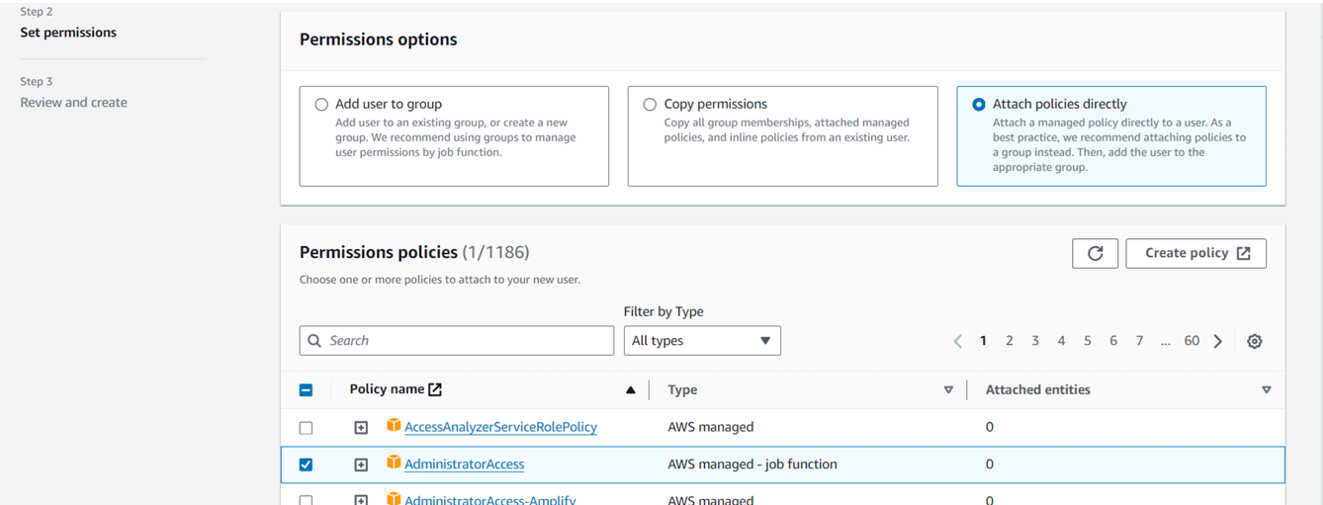
Assign permissions by attaching policies directly, opting for "Administrator access," and then create the user.

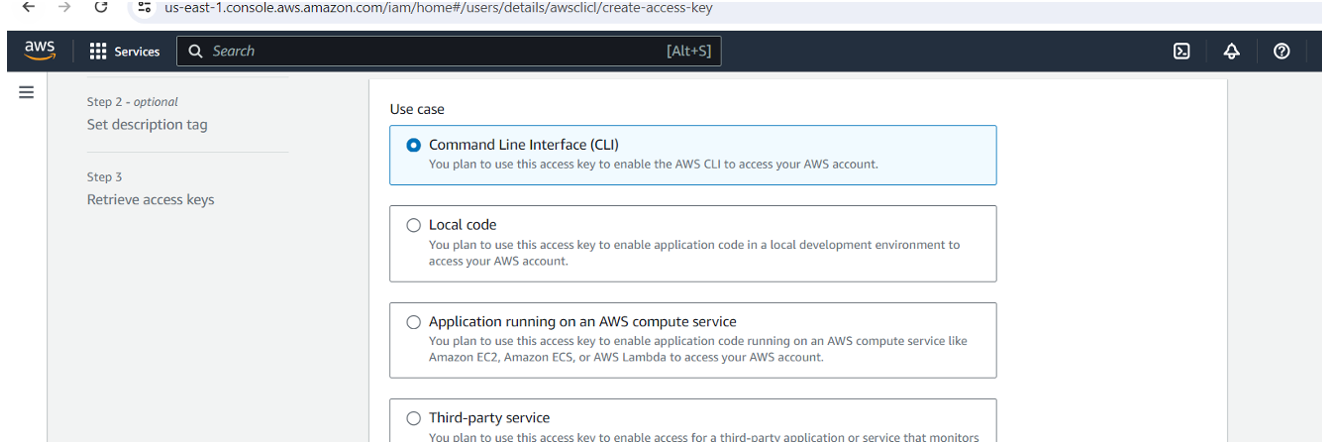
Within the user settings, locate "Create access key," and choose the command line interface (CLI) option to generate an access key.
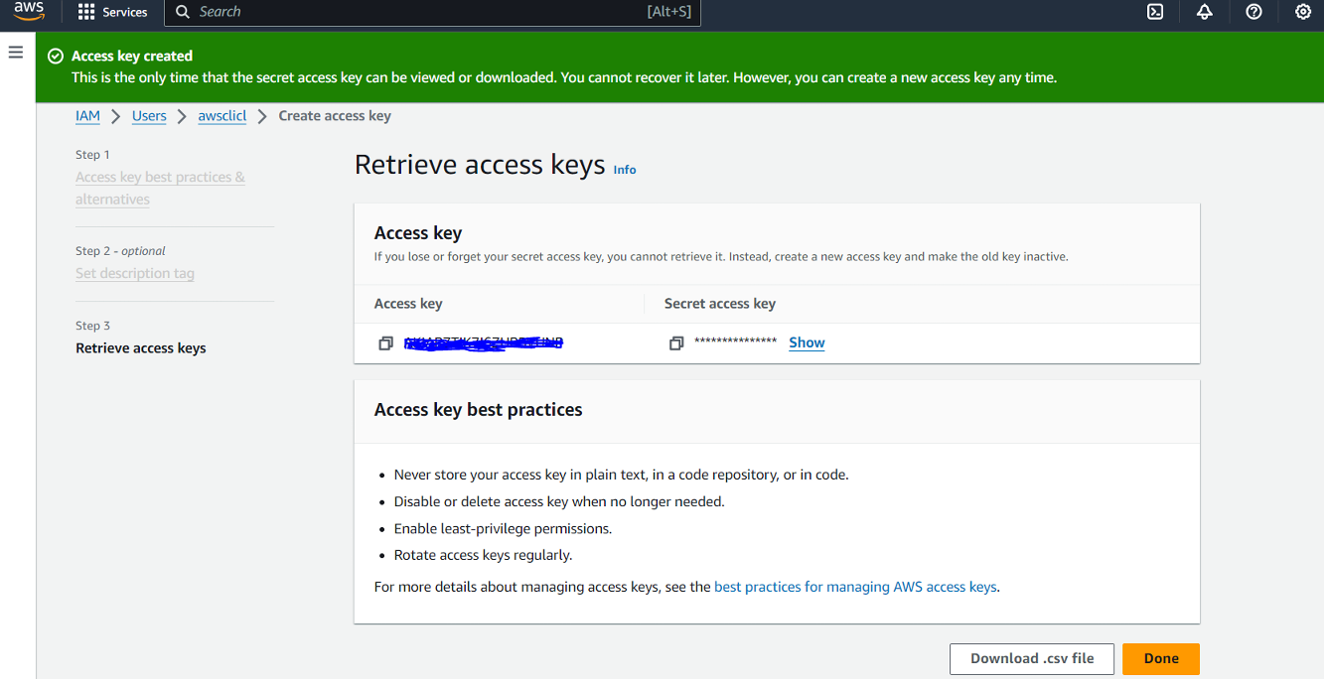
Upon creation, you can view or download the access key and secret access key either from the console or via CSV download.
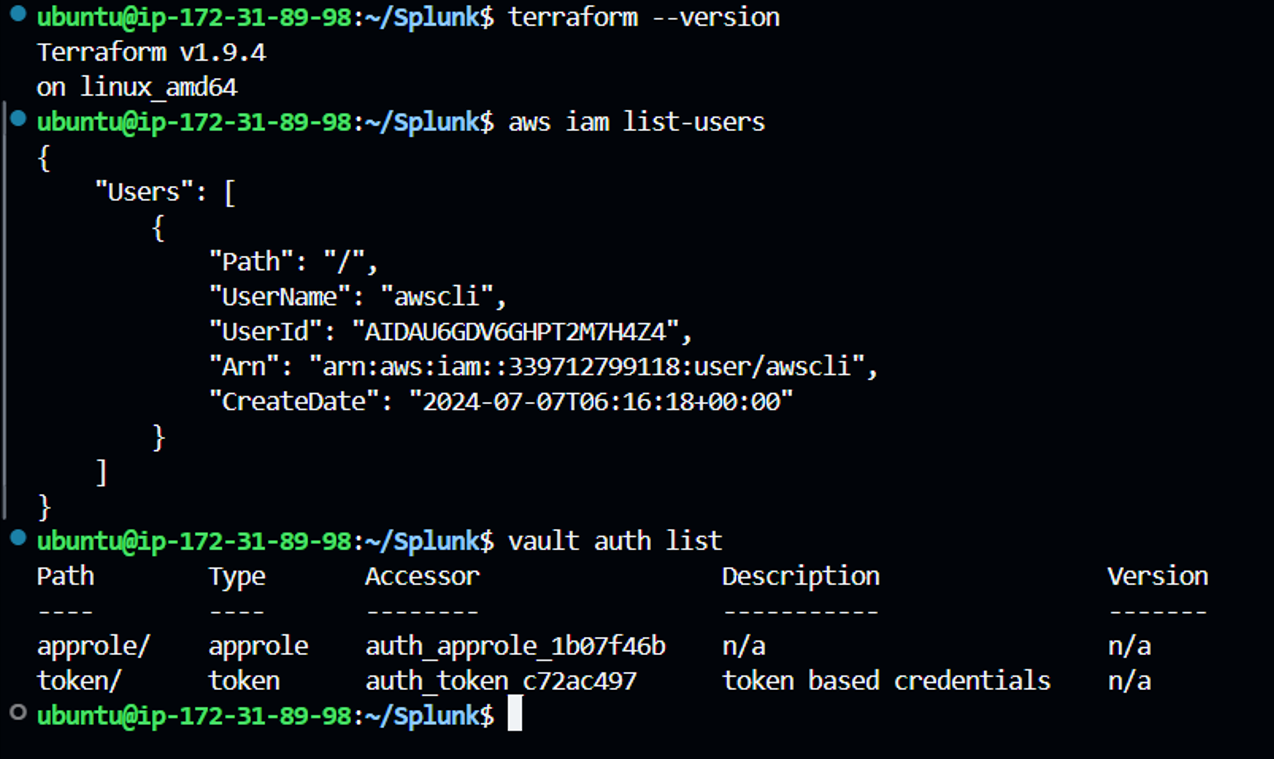
Navigate to your terminal and follow below steps:
sudo apt install unzip
curl "https://awscli.amazonaws.com/awscli-exe-linux-x86_64.zip" -o "awscliv2.zip"
unzip awscliv2.zip
sudo ./aws/install
aws configure (input created accesskeyid and secret access key)
cat ~/.aws/config
cat ~/.aws/credentials
aws iam list-users (to list all IAM users in an AWS account)
Let’s begin with the project:
Step1: Make sure to complete all the above prerequisites to being with the project.
Step2: Open VS Code, connect to your remote server via SSH, and start writing your script. The main.tf file and user-data.sh.tpl script is as follows:
Code Explanation(main.tf):
🔹AWS Provider Configuration: Configures the AWS provider to interact with resources in the us-east-1 region.
🔹Vault Provider Configuration: Sets up the Vault provider to manage secrets, connecting to the Vault server at http://18.206.114.175:8200 and authenticating using AppRole credentials (Role ID and Secret ID).
🔹 Retrieve Vault Token from AWS SSM Parameter Store: Retrieves the VAULT_TOKEN from AWS SSM Parameter Store, ensuring the token is decrypted for secure access during the provisioning process.
🔹Fetch Secrets from Vault: Fetches a secret (Splunk password) from the Vault using the v2 KV secrets engine, allowing secure access to sensitive information needed for container setup.
🔹Create an AWS Key Pair: Generates an AWS key pair named TF-key for SSH access to the EC2 instance, utilizing a public RSA key for secure login.
🔹Save the Private Key Locally: Stores the private key locally in a file named tfkey for later use in accessing the EC2 instance.
🔹Generate RSA Private Key: Creates a 4096-bit RSA private key that is used to generate the key pair for secure access to the EC2 instance.
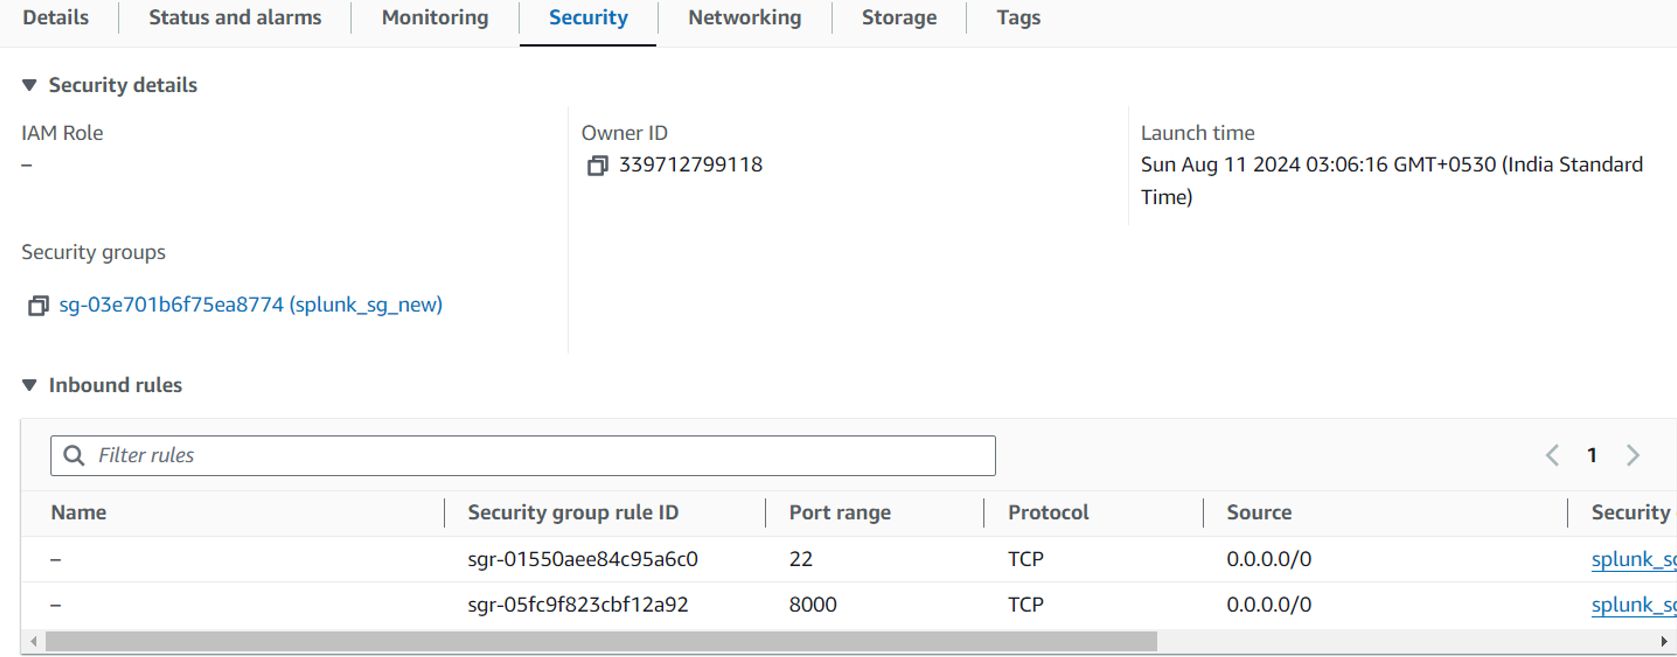
🔹Security Group Configuration: Establishes a security group (splunk_sg_new) to allow inbound SSH (port 22) and HTTP (port 8000) traffic, along with unrestricted outbound traffic to facilitate communication.
🔹Provision EC2 Instance for Splunk: Deploys an AWS EC2 instance using a specified AMI (Ubuntu 20.04 LTS) and instance type (t3.medium), configuring it with the created security group and key pair. A user data script is provided to automate further configuration upon instance startup.
🔹Configure Root Block Device: Sets the root volume size of the EC2 instance to 50 GB, ensuring adequate storage for Splunk and its data.
🔹 Tagging the Instance: Tags the EC2 instance with a name (SplunkInstance) and includes the Vault token for identification and easy management.
User Data script Explanation:
This script automates the setup of a Splunk environment by:
Installing Software: Updates the package index and installs Docker, AWS CLI, and Vault CLI for managing containers and secrets.
Configuring Docker: Starts the Docker service and creates a bridge network for container communication.
Retrieving Secrets: Fetches the Splunk password from Vault for secure access.
Running Containers: Launches Splunk Enterprise and Splunk Universal Forwarder containers in the Docker network for log management.
This ensures a streamlined and efficient deployment process for your Splunk environment.
Make use of below repository where all the script files, splunk queries updated.
https://github.com/Sakeena19/Splunk-setup-using-TF-and-Docker.git
Step3:
Before running Terraform commands, manually export the following values in the terminal, which will be retrieved by the script:
vault read auth/approle/role/terraform/role-id
vault write -f auth/approle/role/terraform/secret-id
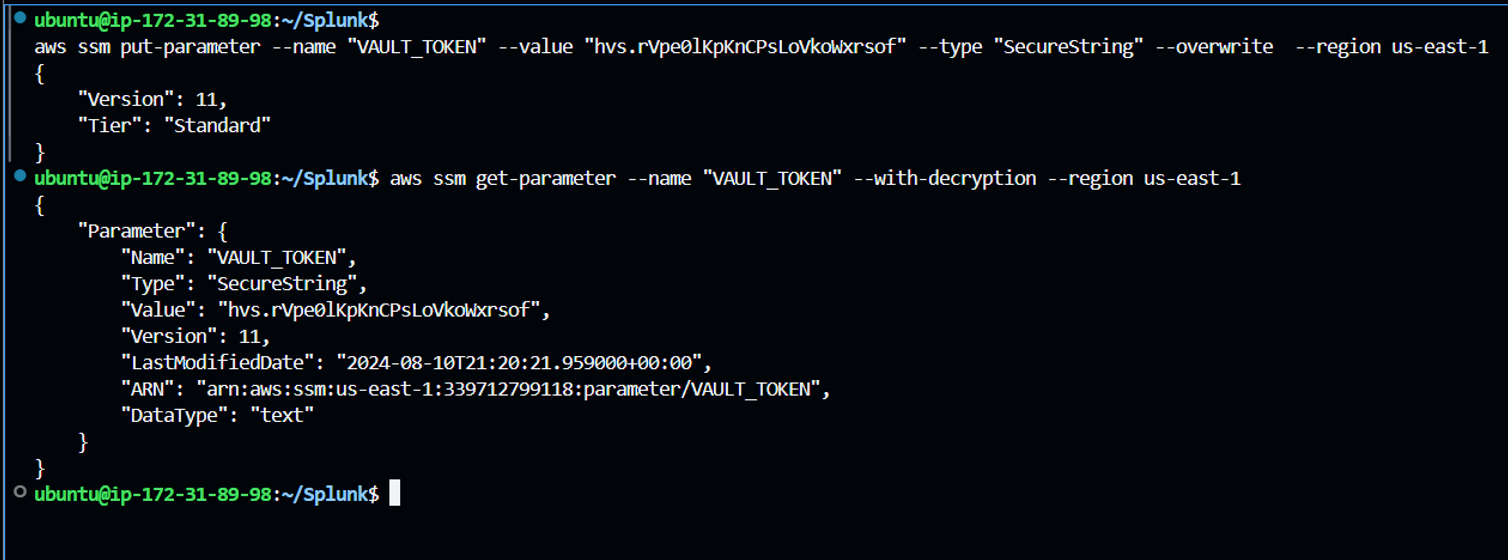
Next, store the Vault token in AWS Systems Manager Parameter Store
aws ssm put-parameter --name "VAULT_TOKEN" --value "hvs.rVpe0lKpKnCPsLoVkoWxrsof" --type "SecureString" --overwrite --region us-east-1
aws ssm get-parameter --name "VAULT_TOKEN" --with-decryption --region us-east-1 (for rechecking the input provided)
Sample output is as follows:

Step4:
let’s run terraform commands. Make sure to connect aws with terraform (using aws configure) before running and save all the files if not done already.
To initialize terraform, use “terraform init” command which setups everything necessary for terraform to manage your infrastructure such as modules, plugins, backend config etc., as defined in your configuration files.
To check if our code is valid, use “terraform validate” command.
Run “terraform plan” command, used to create an execution plan to see what changes terraform will make to your infrastructure without actually applying those changes.
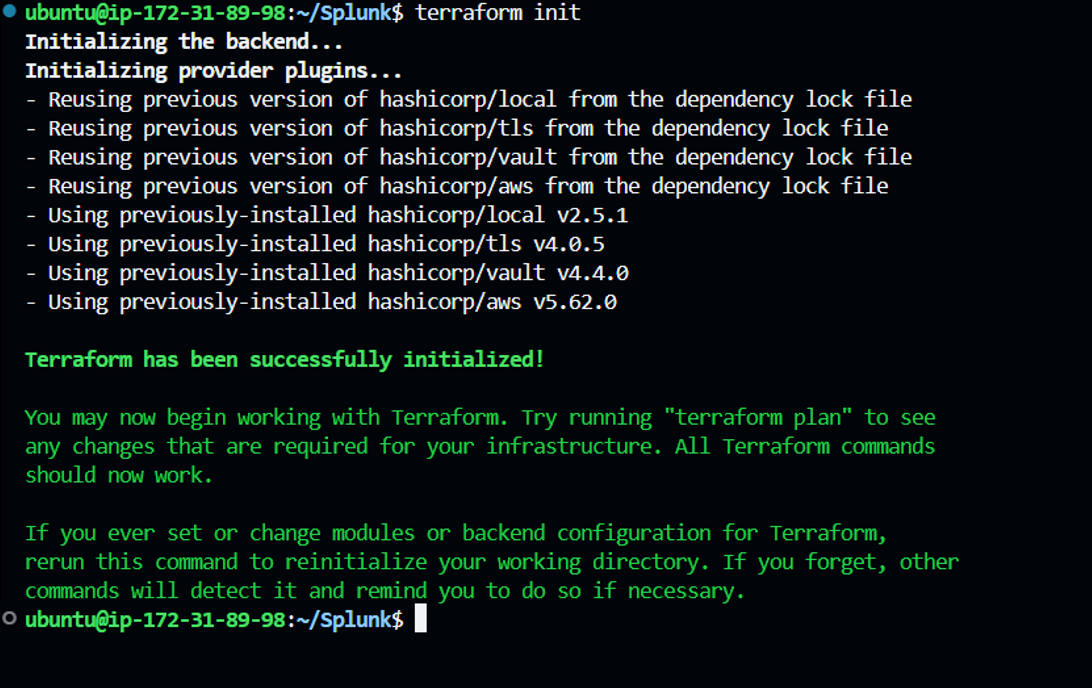
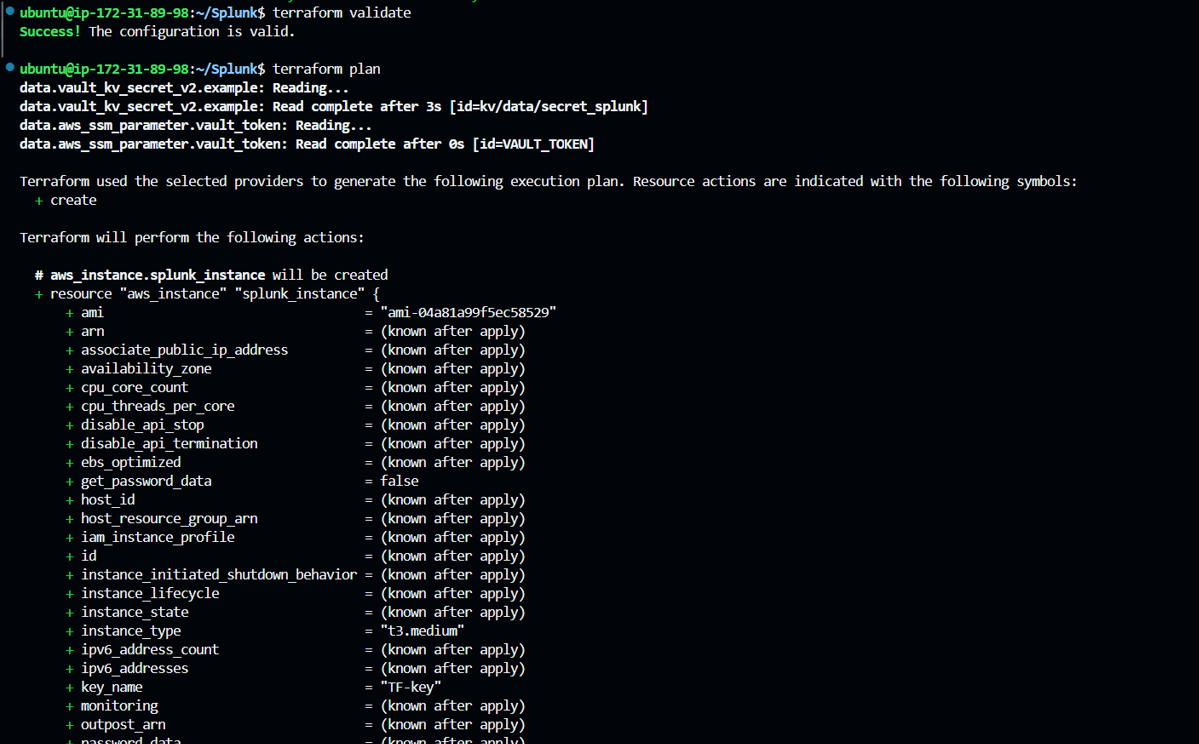
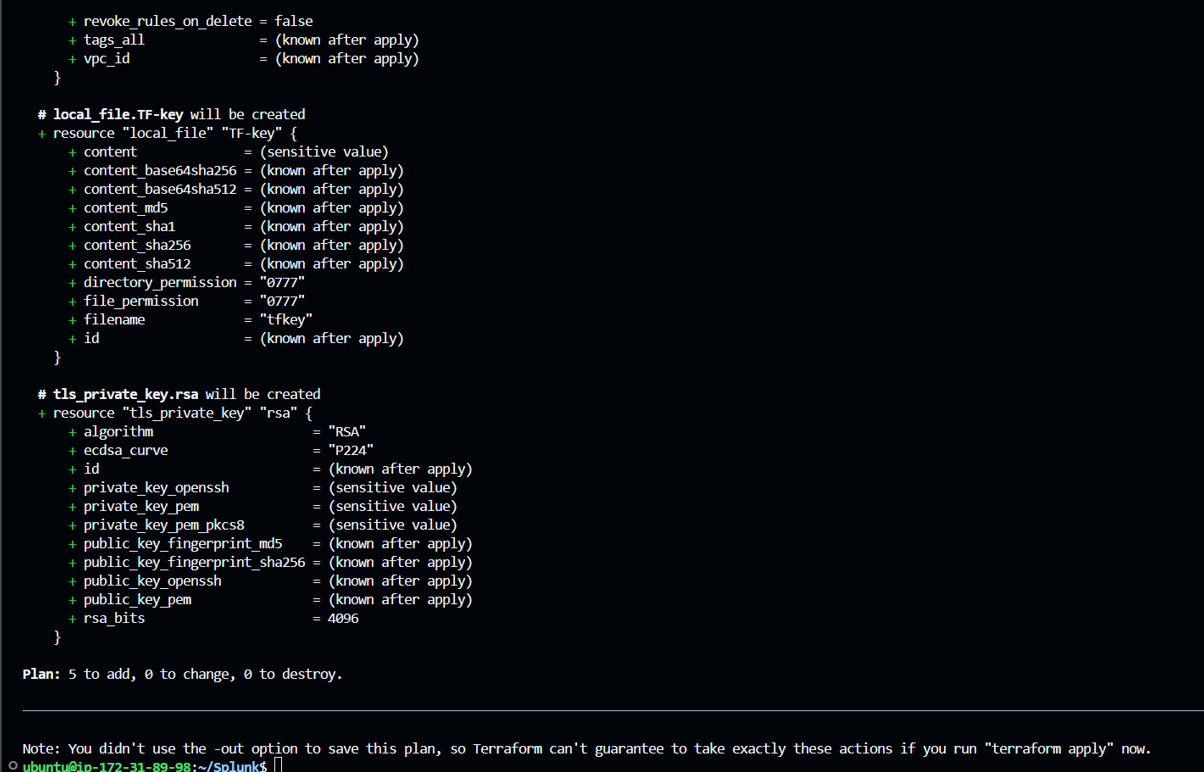
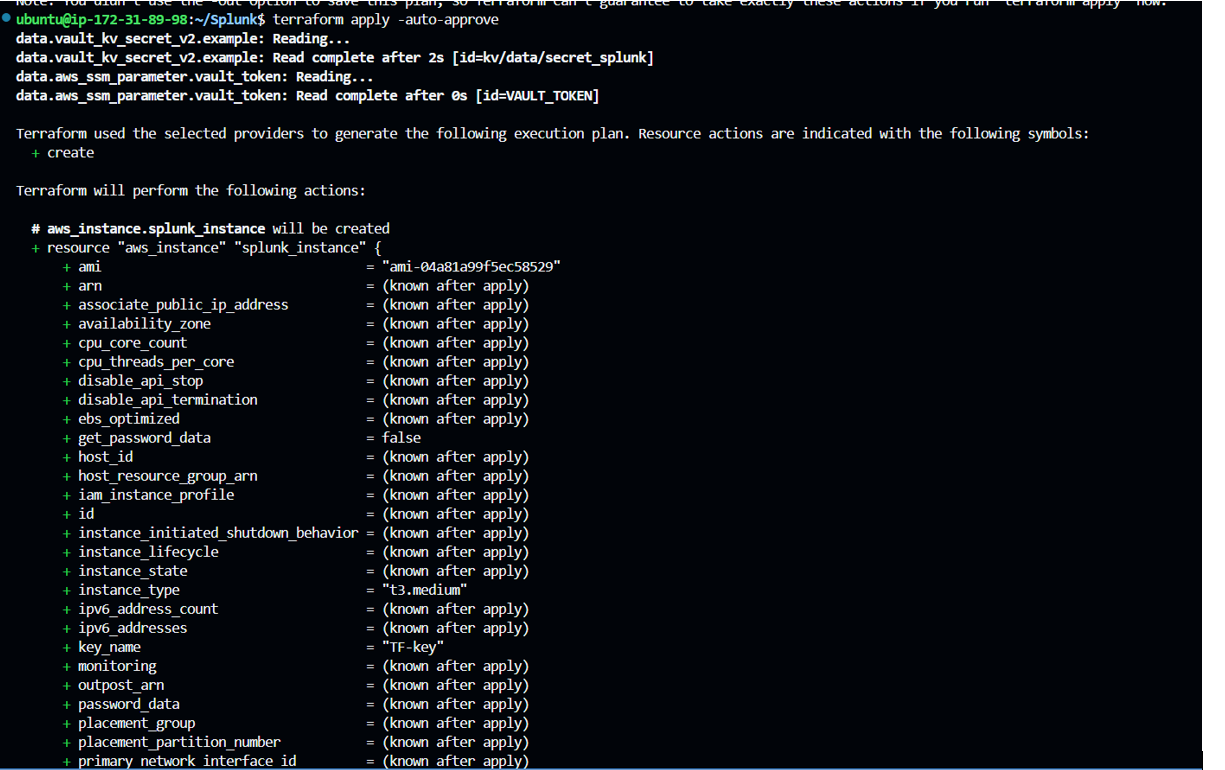
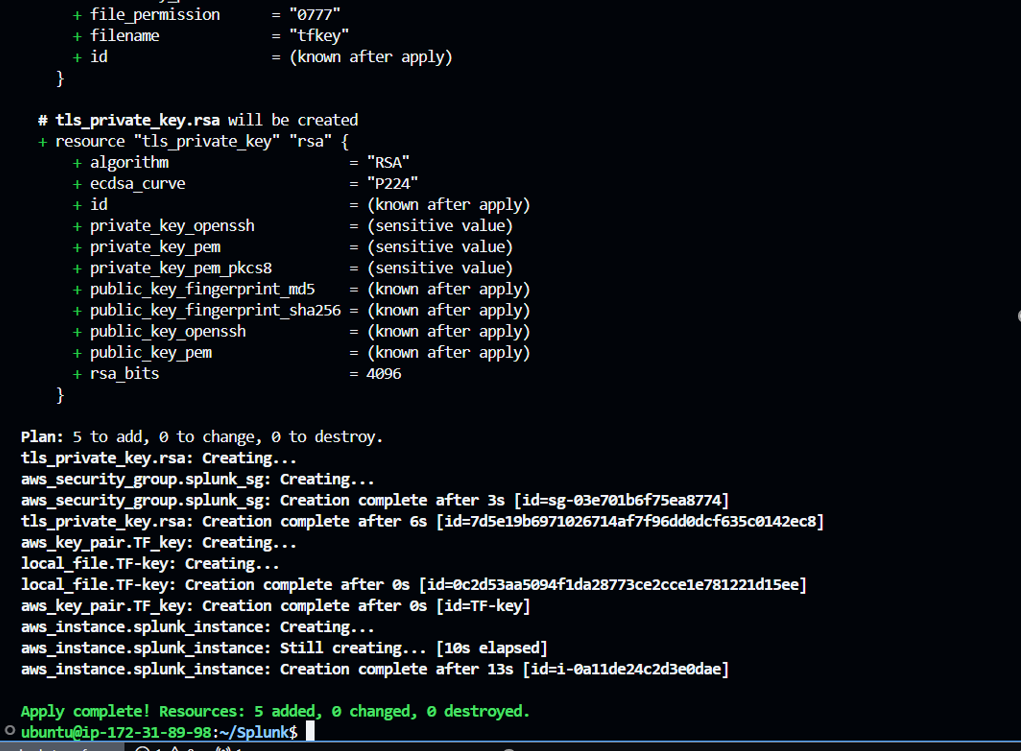
Run “terraform apply -auto-approve” which will apply changes which will setup your infrastructure as defined in your terraform configuration files, Here -auto-approve skips the manual approval during command execution.
Step5: Post execution, below changes happens:
"Creates a new EC2 instance (SplunkInstance) with the specified instance type(t3.medium), security group(splunk_sg_new), inbound rules, key pair(TF-key), and a token stored in AWS SSM."


Step6:
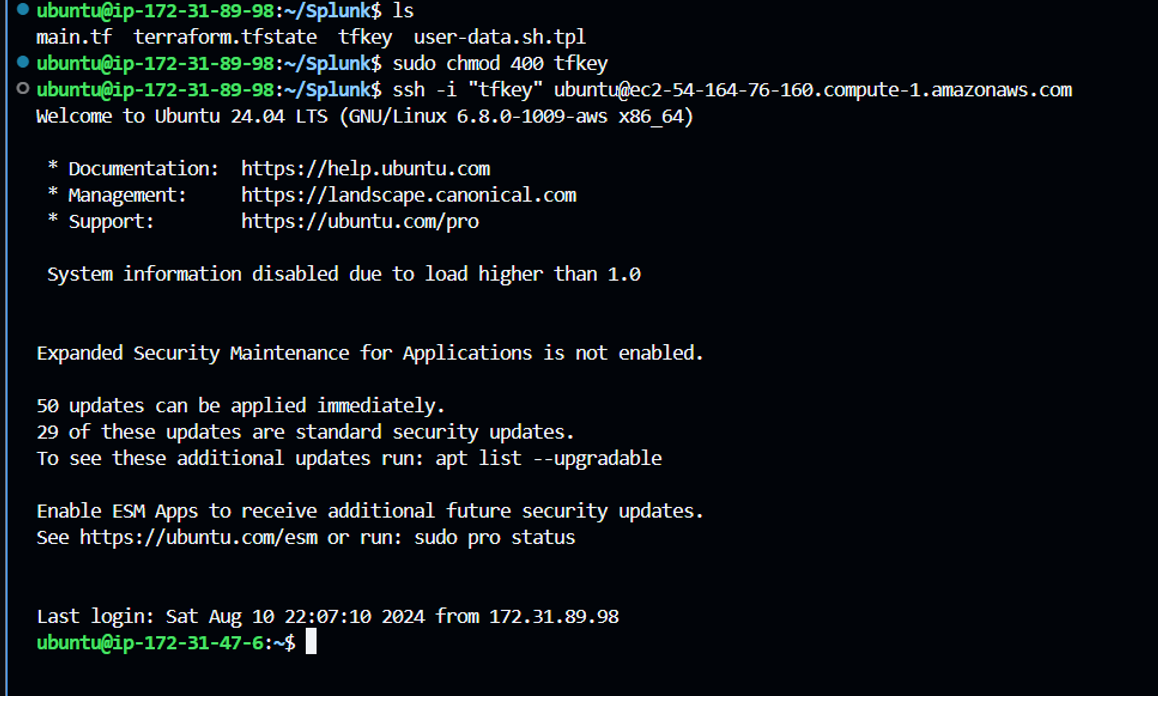
In your local, a private key(tfkey) will be created which can be used to login to the splunk Instance created via ssh as follows:
Step7:
Once logged into your newly created instance, you can verify the Docker version and check the running Docker containers, specifically Splunk Enterprise and Splunk Universal Forwarders.

You can verify logs of the container to check the container status using “ docker logs <containername/containerid>”
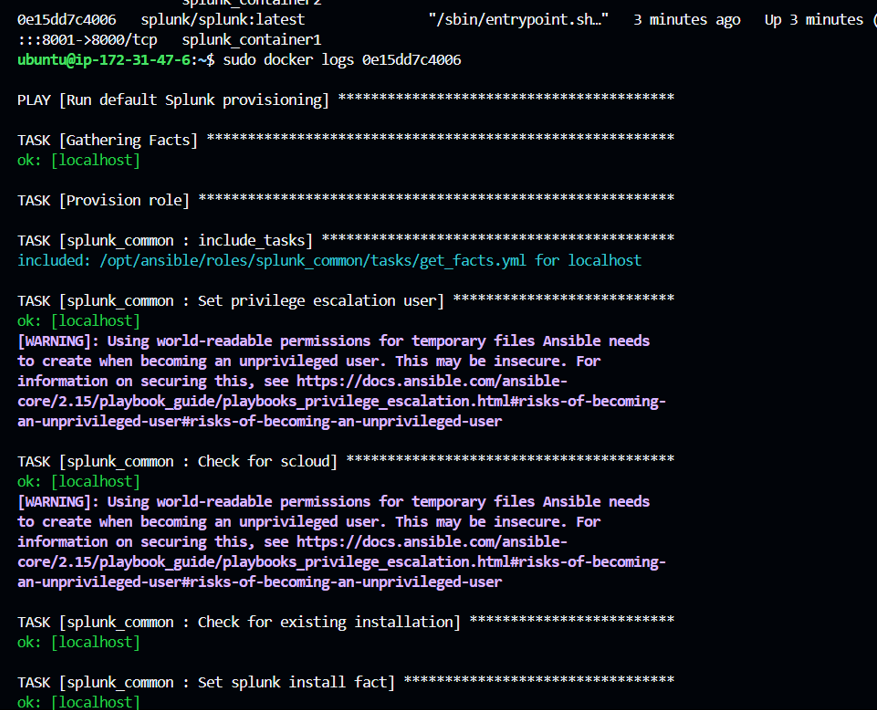
Step8: If the container is running properly, you can access the Splunk UI via http://<your_public_ip>:8001.
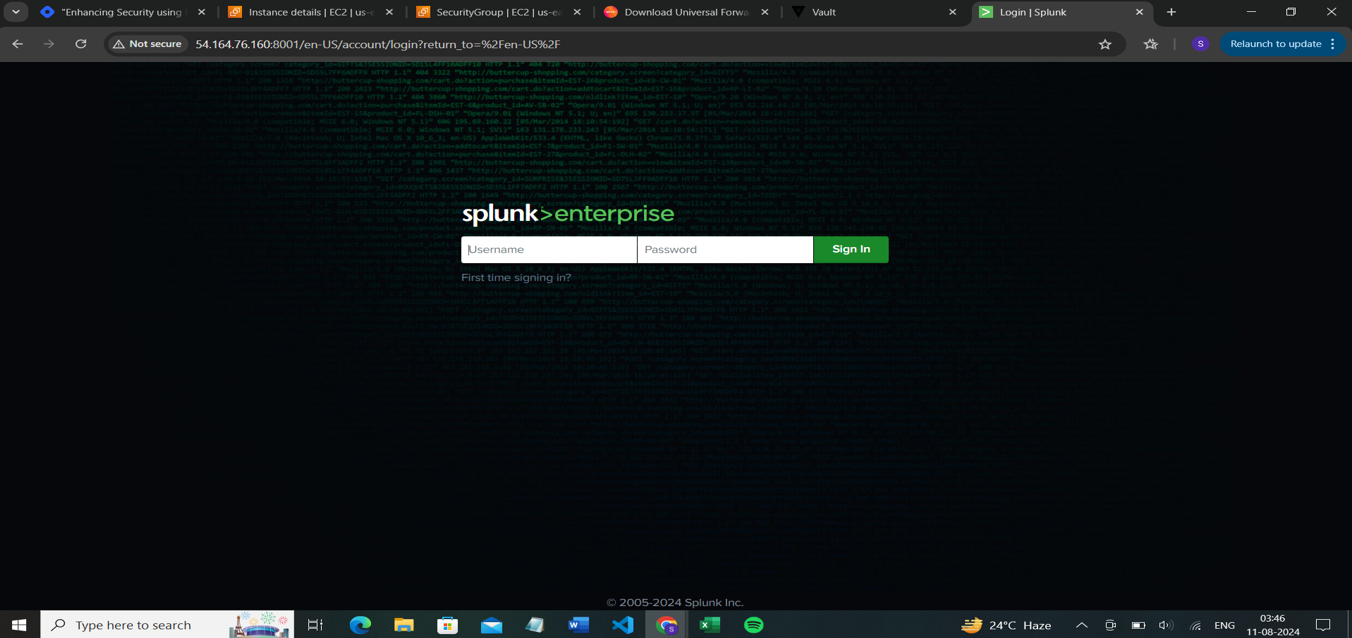
The default username is 'admin,' and the password is the one stored in HashiCorp Vault. If you want to set a new password, you can run the command below, which will prompt you to create a new password.
Log in to your Splunk container where Splunk Enterprise is running; in this case, it's splunk_container1:
sudo docker exec -it splunk_container1 bash
cd /opt/splunk/bin
sudo ./splunk start --accept-license
Once you accept the license, you can set a new password or use the same password stored in Vault.
The login page is as follows:
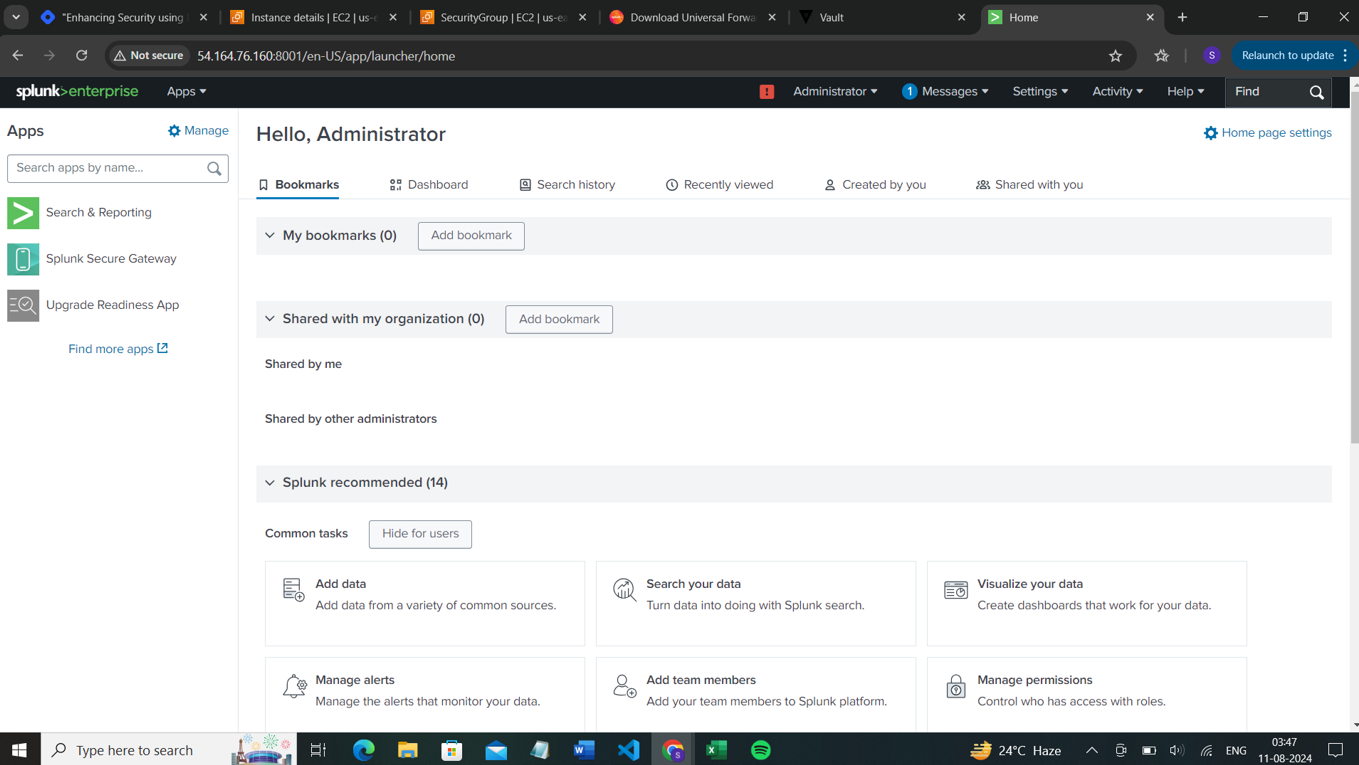
Step9:
As we are running Splunk containers via a Docker bridge network, Splunk Enterprise and the Splunk Universal Forwarder will communicate with each other, allowing logs to be ingested automatically into Splunk.
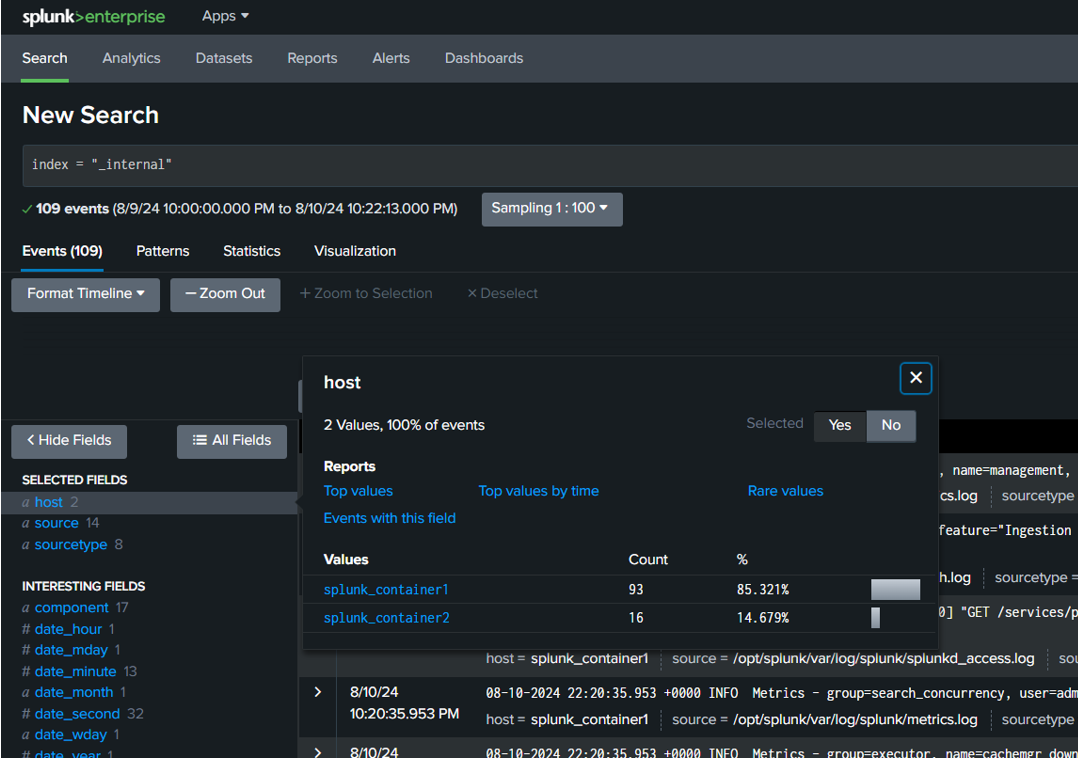
The logs will be indexed under index=_internal, where all internal system logs will be reported to Splunk. A sample screenshot is as follows:
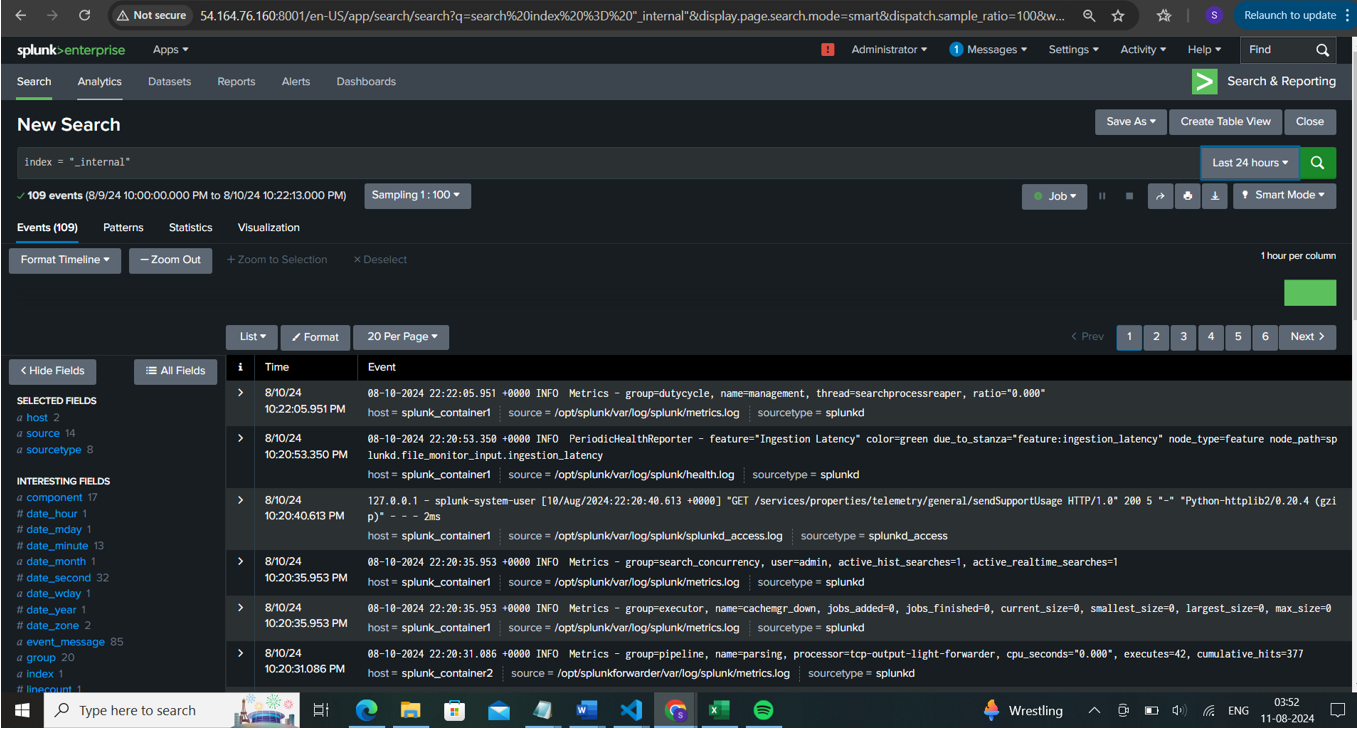
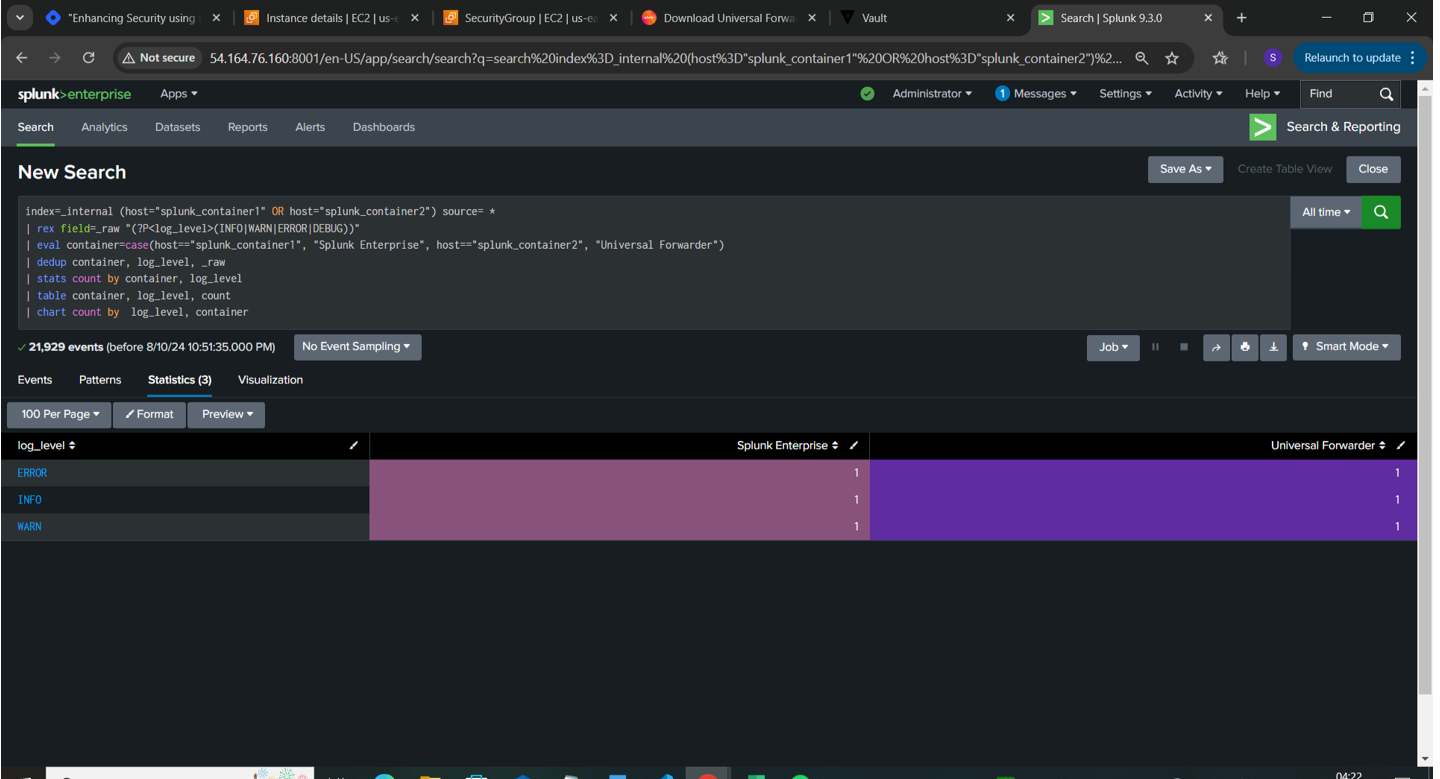
The below is the sample query which extracts the required fields for log monitoring in the defined hosts

Usage:
This Splunk query retrieves and analyses log data from the internal index, specifically from the hosts splunk_container1 (Splunk Enterprise) and splunk_container2 (Universal Forwarder).
🔸Filter logs: It filters logs from both containers using index="_internal".
🔸Extract log levels: The rex command extracts log levels (INFO, WARN, ERROR, DEBUG) from the raw log data.
🔸Categorize containers: The eval command categorizes logs by container type.
🔸Remove duplicates: The dedup command eliminates duplicate entries based on container name, log level, and raw log data.
🔸Count occurrences: The stats command counts the occurrences of each log level by container.
🔸Display results: Finally, the table and chart commands format the results into a table and a chart for easier visualization.
Output :
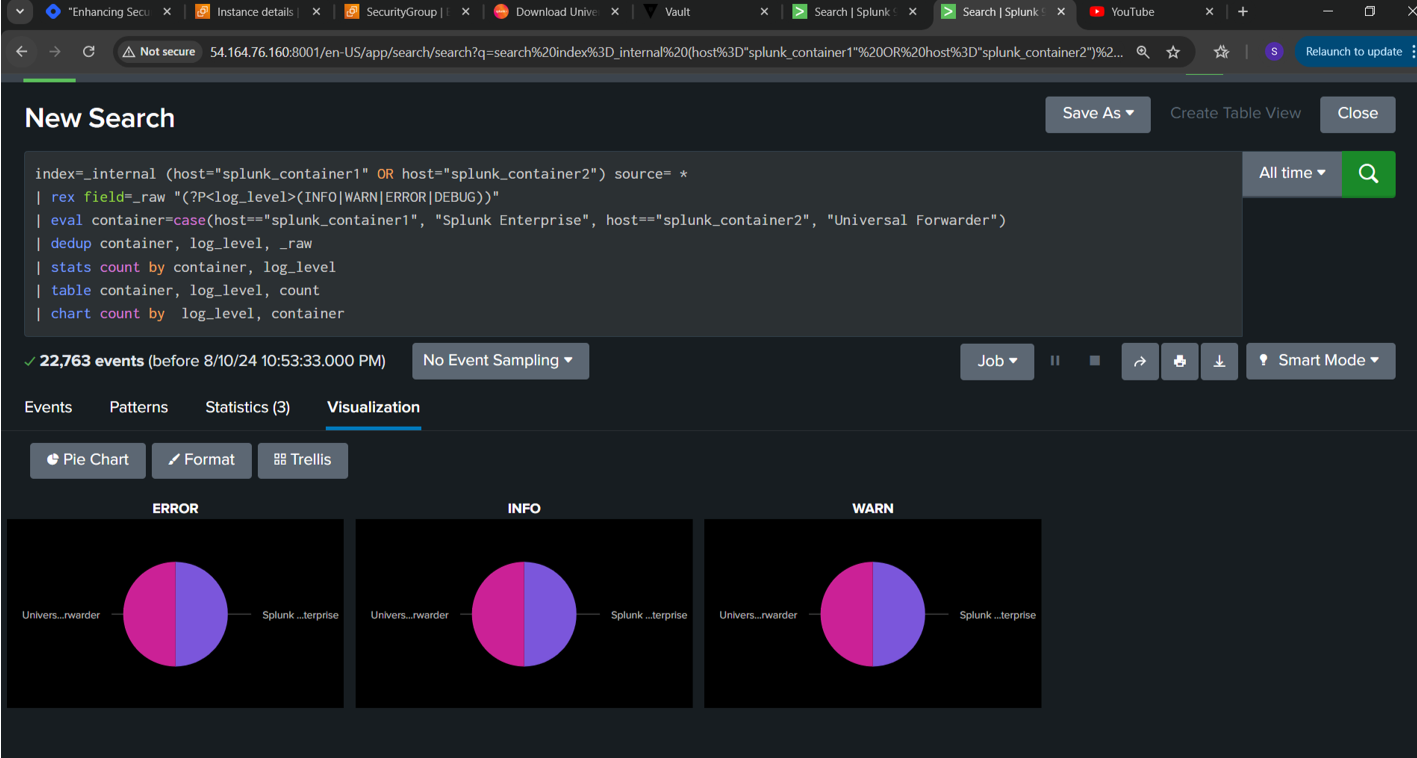
Output displayed via pie chart using Trellis Visualization:
Different types of Log monitoring Using Splunk:
We can make use of splunk inbuilt application called “Splunk Add-on for Unix and Linux” which has default inputs.conf used for splunk configuration
✨Login to Splunk-> Apps -> Manage more apps -> search for “Splunk Add-on for Unix and Linux” -> provide username and password (you can create account under splunk.com and use those creds here) -> Install.
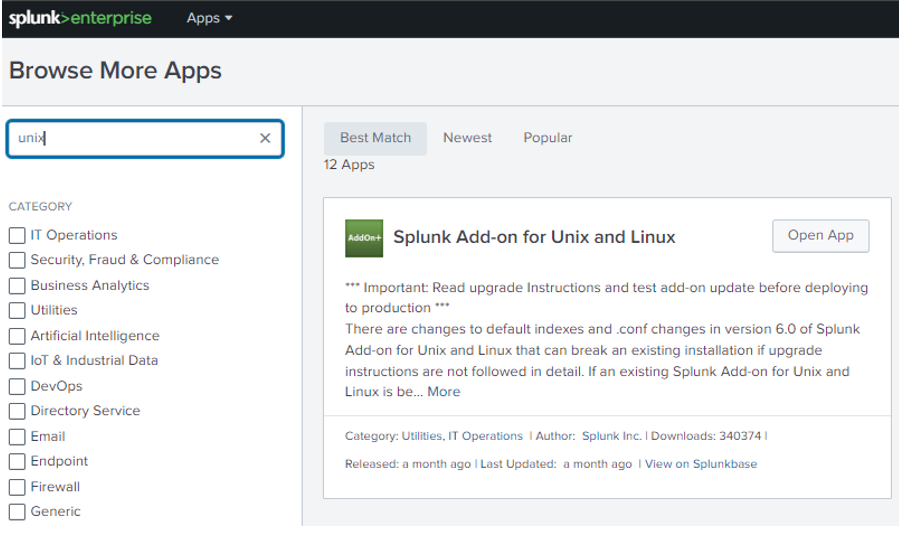
✨ Open the installed app on your splunk homepage and click on the Add configuration tab and select the type of files you want to enable it under inputs.conf file.
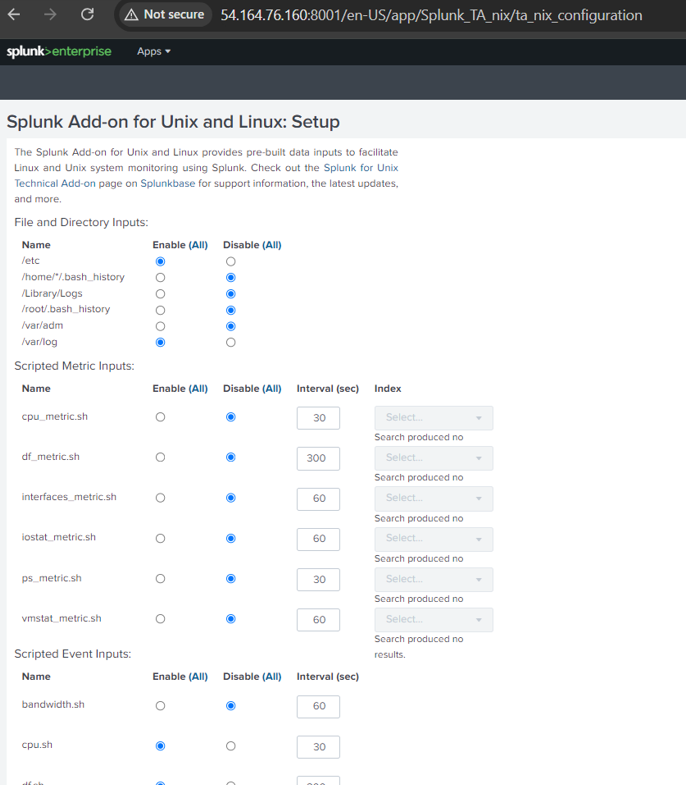
✨ Save the file and go to your terminal, navigate inside your container where splunk enterprise is running(splunk_container1) and reconfigure inputs.conf file as per your requirements. You can define index, source, source type, intervals etc in your inputs.conf file.
**Inputs.conf Usage:
**The inputs.conf file in Splunk is used to configure data inputs, specifying what data to collect, how to collect it, and from where. It defines the source types, directories, files, or network ports to monitor, and sets parameters such as data indexing intervals, log rotation, and filtering. This file is essential for telling Splunk where to find data and how to process it before indexing.
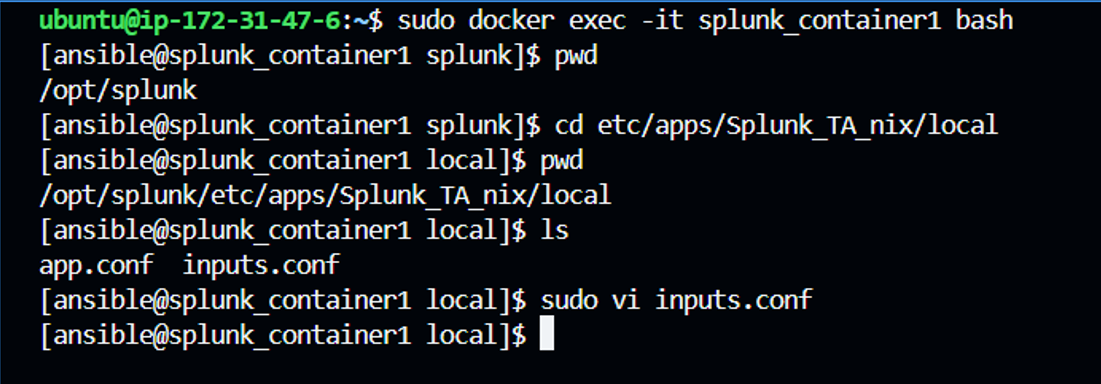
I have uploaded the sample inputs.conf file in my GitHub repo as specified before, check out there.
After inputting the values under inputs.conf, restart your splunk container to reflect the changes
“docker restart splunk_container1”

In splunk UI, you can navigate to source controls tab to restart.
You can view the new changes by searching internal logs.
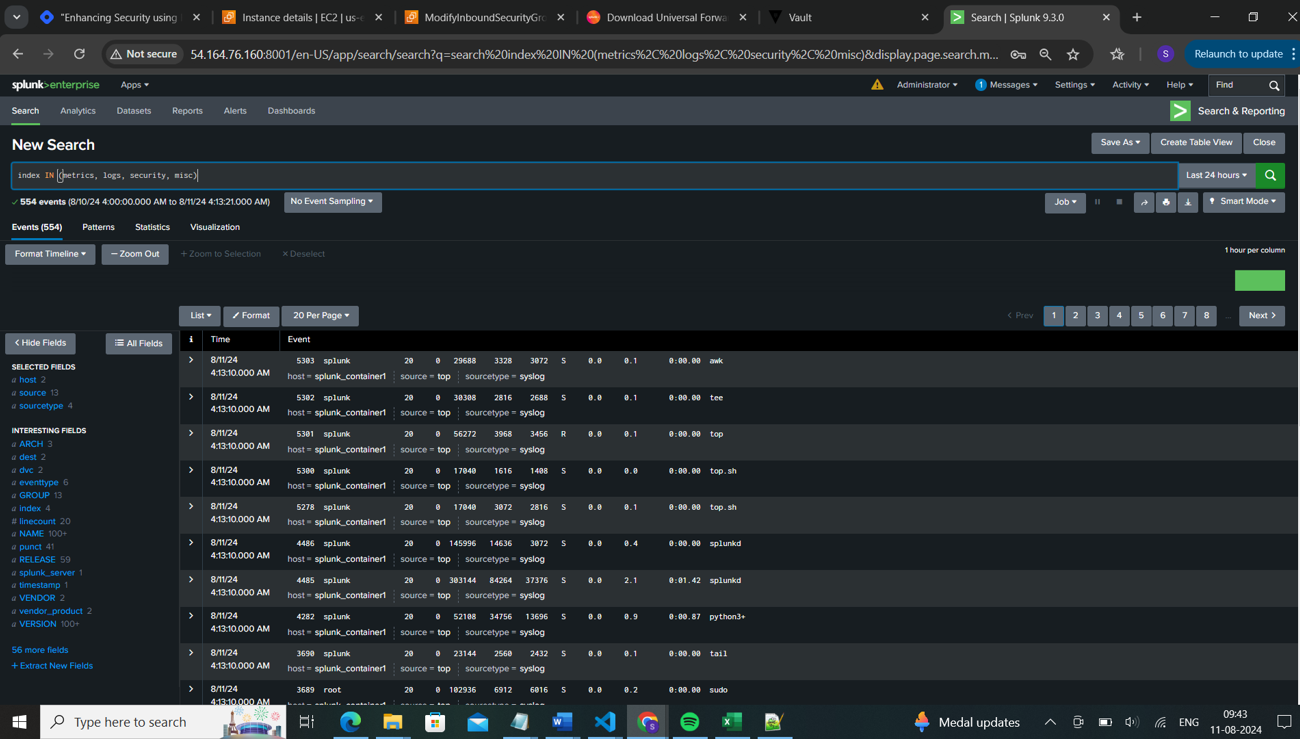
💎Now we will create a comprehensive search query as below which is segregated as per the type of logs.
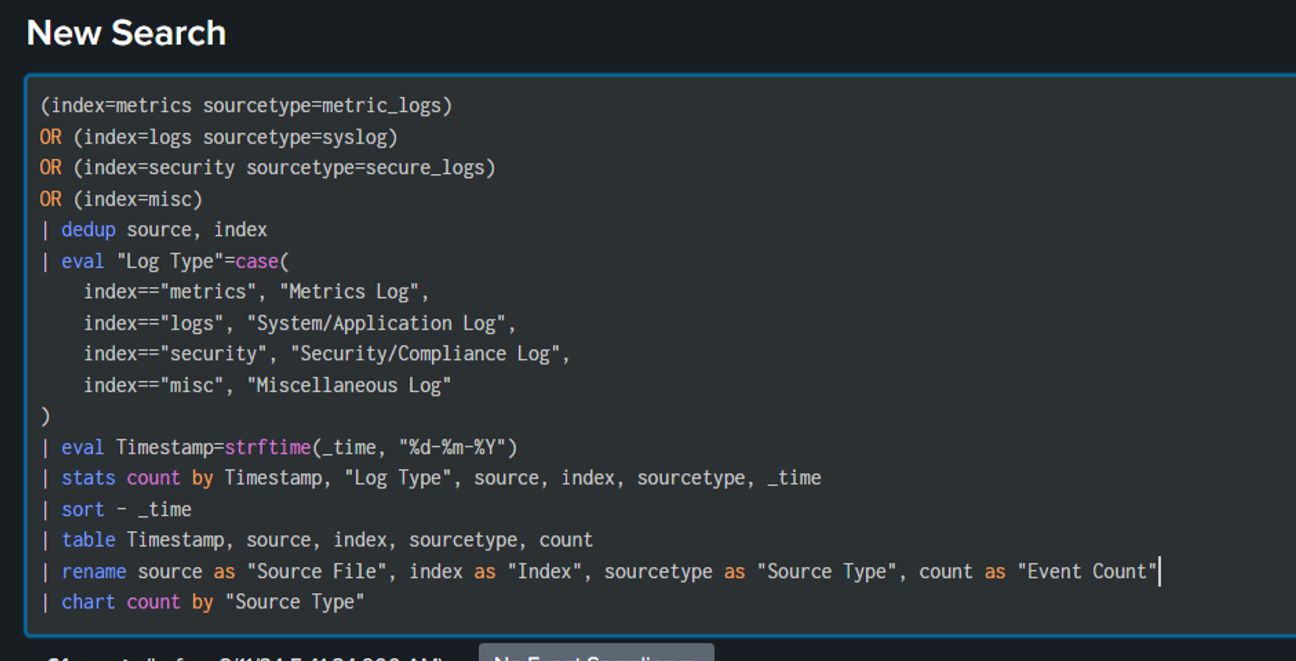
Query explanation:
Retrieve logs: Fetches logs from multiple indexes based on the specified sourcetypes.
dedup: Removes duplicate entries based on the source and index.
eval: Categorizes logs into different log types based on their index.
strftime: Converts the timestamp into a readable date format (DD-MM-YYYY).
stats: Counts the number of events grouped by timestamp, log type, source, index, sourcetype, and time.
sort: Sorts the results in descending order by time, showing the most recent logs first.
table: Displays only the specified fields: timestamp, source, index, sourcetype, and event count.
rename: Renames fields for better clarity in the output and chart: Visualizes the event counts in a pie chart, grouped by source type
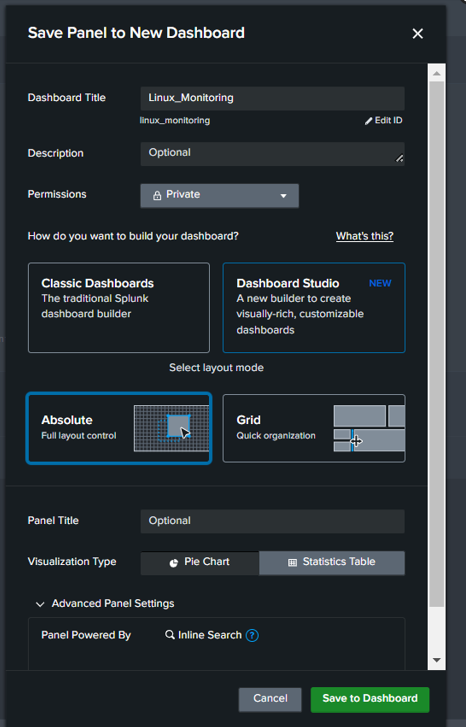
The Query results can be further converted in to Dashboard.
Save as -> create new Dashboard or you can move the search results to an existing Dashboard as well.
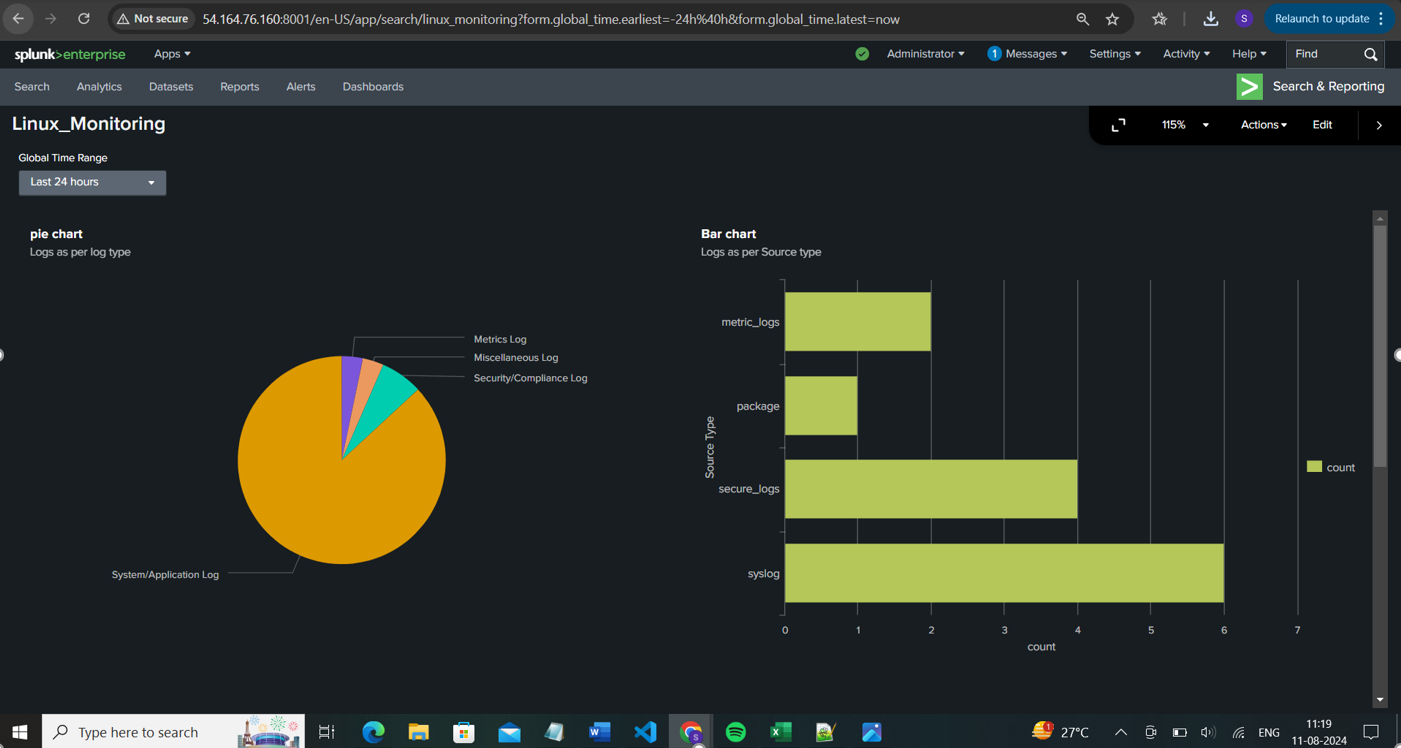
In the below Snap as shown, I have indexed the logs as per the Log type using Pie chart and based on Source Type using Bar chart
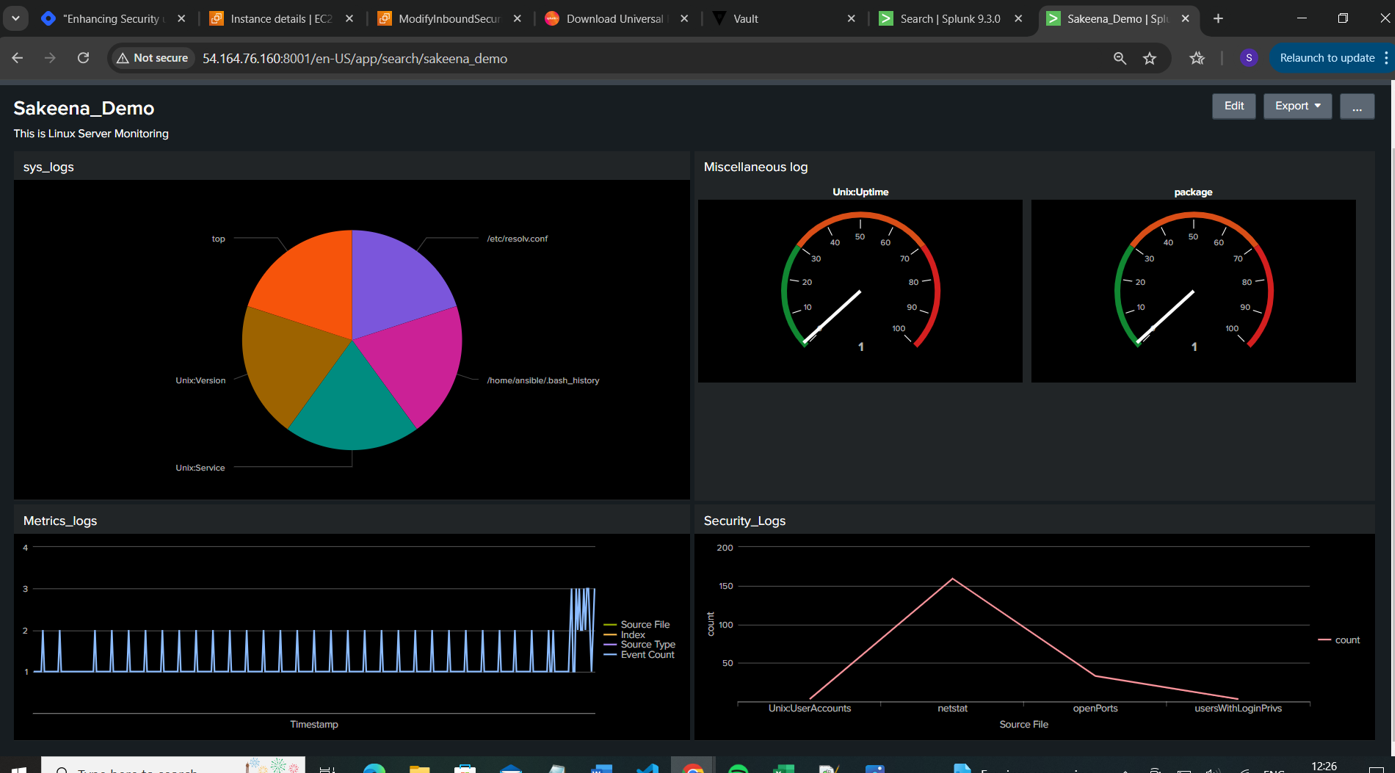
💡 Now we will fetch the results of each source type (type of logs) separately and incorporate them into a single dashboard using different visualizations.
Search query for SourceType “metrics logs”:

Search query for SourceType “System and application logs”:

Search query for SourceType “Security and Compliance logs”:

Search query for SourceType “Miscellaneous Logs”:

Traditional Splunk Dashboard view:
Listing out some of the issues I faced and fixes done in this project:
1) Warning: Attempting to revert the SPLUNK_HOME ownership
Warning: Executing "chown -R splunk:splunk /opt/splunkforwarder"
STDERR:
Not Found
soln: This is an known issue in splunk forwarder and it will not effect your application.
refer: https://docs.splunk.com/Documentation/Forwarder/9.0.4/Forwarder/KnownIssues
2) WARNING: No password ENV var. Stack may fail to provision if splunk.password is not set in ENV or a default.yml [WARNING]: * Failed to parse /opt/ansible/inventory/environ.py with script plugin: Inventory script (/opt/ansible/inventory/environ.py) had an execution
getSecrets(defaultVars) File "/opt/ansible/inventory/environ.py", line 439, in getSecrets raise Exception("Splunk password must be supplied!") Exception: Splunk password must be supplied!
Soln: if the password set by you not met with splunk complexity requirements. Refer splunk official page for more details.
Debug if any issue under below path.
cd /opt/splunk/var/log
less user-data.log
3) Fetching Splunk password from Vault /var/lib/cloud/instance/scripts/part-001: line 17: vault: command not found
Soln: It indicates that Vault CLI is not installed on the splunk instance when its attempting to run, you have to specify it as part of your script or if you are launching the instance manually then you can install it manually
sudo apt-get install -y unzip
wget https://releases.hashicorp.com/vault/${VAULT_VERSION}/vault_${VAULT_VERSION}_linux_amd64.zip
unzip vault_${VAULT_VERSION}_linux_amd64.zip
sudo mv vault /usr/local/bin/
sudo chmod +x /usr/local/bin/vault
4) permission denied while trying to connect to the Docker daemon socket at unix:///var/run/docker.sock: Post "http://%2Fvar%2Frun%2Fdocker.sock/v1.24/auth": dial unix /var/run/docker.sock: connect: permission denied
soln: To resolve this issue, add your user to the docker group or run with sudo with the current user
sudo usermod -aG docker ubuntu
5) ubuntu@ip-172-31-89-98:~/Splunk$ vault auth list
WARNING! VAULT_ADDR and -address unset. Defaulting to https://127.0.0.1:8200.
Error listing enabled authentications: Get "https://127.0.0.1:8200/v1/sys/auth": dial tcp 127.0.0.1:8200: connect: connection refused
Soln: when you move to one terminal to other, you have to export the vault address again. Run, below and check the status again.
export VAULT_ADDR='http://0.0.0.0:8200'
if still issue, check whether your vault UI is accessible, if not accessible run below
vault server -dev -dev-listen-address="0.0.0.0:8200"
6) │ Error: Error making API request.
│ URL: PUT http://54.204.71.250:8200/v1/auth/approle/login
│ Code: 400. Errors:
│ * invalid role or secret ID
Soln: The above errors indicates that either your secret id is expired or wrongly scripted, reconfigure your secret-id using below and rerun the script.
vault write -f auth/approle/role/terraform/secret-id
Tip:
If you face any issue from splunk end, you can always rely on splunk community page where you can get support on your issues from Splunk experts(https://community.splunk.com)
Subscribe to my newsletter
Read articles from Sakeena Shaik directly inside your inbox. Subscribe to the newsletter, and don't miss out.
Written by

Sakeena Shaik
Sakeena Shaik
🌟 DevOps Specialist | CICD | Automation Enthusiast 🌟 I'm a passionate DevOps engineer who deeply loves automating processes and streamlining workflows. My toolkit includes industry-leading technologies such as Ansible, Docker, Kubernetes, and Argo-CD. I specialize in Continuous Integration and Continuous Deployment (CICD), ensuring smooth and efficient releases. With a strong foundation in Linux and GIT, I bring stability and scalability to every project I work on. I excel at integrating quality assurance tools like SonarQube and deploying using various technology stacks. I can handle basic Helm operations to manage configurations and deployments with confidence. I thrive in collaborative environments, where I can bring teams together to deliver robust solutions. Let's build something great together! ✨