Feature Engineering: A Key Step in Building Effective Machine Learning Models
 Kshitij Shresth
Before feeding raw data into a machine learning model, we need to process and transform it to create features that the model can understand and learn from. This process is known as feature engineering. It involves several steps, each aimed at enhancing the quality of the data so that the machine learning model can perform more accurately and efficiently.
Feature Transformation:
Sometimes, the values in the dataset's columns are not optimized to produce accurate results. Feature transformation involves modifying these values to make them more suitable for the model. This could include:
Handling missing values: Replacing missing values with the mean, median, or a specified value.
Managing outliers: Capping extreme values or removing them altogether.
For example If a dataset has outliers in the "income" column, we might log-transform the data to reduce the impact of these outliers on the model's performance.
Feature Construction:
This step involves creating new features from existing ones. By combining or transforming existing columns, we can create new variables that might be more predictive.
In a housing prediction dataset, we could create a new feature called "price_per_square_foot" by dividing the "price" column by the "square_footage" column. Then plotting a heatmap to analyse corelations with this new feature could be insightful.
Feature Selection:
Not all features in our dataset will be relevant to the model. Feature selection is the process of identifying and retaining the most important features while discarding the irrelevant ones. This helps in reducing model complexity and improving performance.
Techniques like correlation analysis, Recursive Feature Elimination (RFE), and feature importance from tree-based models can help in selecting the right features.
Feature Extraction:
Feature extraction involves identifying and extracting relevant information from the raw data to produce a more concise dataset, improving model performance and efficiency.
In different domains, such as text, image, or time series data, feature extraction involves techniques like TF-IDF for text, edge detection for images, or statistical measures for time series, enabling algorithms to better understand and process the underlying data patterns
Feature Scaling:
Feature scaling is a technique used to standardize the independent features present in the data within a fixed range. It's important because many machine learning algorithms are sensitive to the scale of the data.
There are two main types of feature scaling:
Standardization (Z-score normalization)
This method scales features to have a mean of 0 and a standard deviation of 1. It’s useful when features have different units or ranges.
import pandas as pd

ages = [
    56, 46, 32, 60, 25, 37, 42, 50, 29, 33,
    28, 62, 34, 40, 44, 57, 35, 36, 38, 55,
    49, 30, 45, 53, 47, 39, 41, 51, 31, 58,
    43, 63, 26, 48, 54, 27, 52, 61, 24, 59,
    64, 65, 23, 22, 21, 20, 19, 18, 19, 21,
    22, 23, 24, 25, 26, 27, 28, 29, 30, 31,
    32, 33, 34, 35, 36, 37, 38, 39, 40, 41,
    42, 43, 44, 45, 46, 47, 48, 49, 50, 51,
    52, 53, 54, 55, 56, 57, 58, 59, 60, 61,
    62, 63, 64, 65, 64, 63, 62, 61, 60, 59
]

#Creating the DataFrame with the 'age' column
df = pd.DataFrame({'age': ages})

#Calculate the mean (x̄) and standard deviation (σ) of the 'age' column.
mean_age = df['age'].mean()
std_age = df['age'].std()

#Creating a new column 'zage' by standardizing the 'age' values
df['zage'] = (df['age'] - mean_age) / std_age

  '''age      zage
0    56  0.914312
1    46  0.202785
2    32 -0.793353
3    60  1.198923
4    25 -1.291422
..  ...       ...
95   63  1.412381
96   62  1.341229
97   61  1.270076
98   60  1.198923
99   59  1.127770

[100 rows x 2 columns]
'''
That's the longer way of doing things. For the values we get in '"zage" the mean is 0 with 1 as standard deviation.
We can do this directly by importing StandardScaler
import pandas as pd
from sklearn.preprocessing import StandardScaler
ages = [
    56, 46, 32, 60, 25, 37, 42, 50, 29, 33,
    28, 62, 34, 40, 44, 57, 35, 36, 38, 55,
    49, 30, 45, 53, 47, 39, 41, 51, 31, 58,
    43, 63, 26, 48, 54, 27, 52, 61, 24, 59,
    64, 65, 23, 22, 21, 20, 19, 18, 19, 21,
    22, 23, 24, 25, 26, 27, 28, 29, 30, 31,
    32, 33, 34, 35, 36, 37, 38, 39, 40, 41,
    42, 43, 44, 45, 46, 47, 48, 49, 50, 51,
    52, 53, 54, 55, 56, 57, 58, 59, 60, 61,
    62, 63, 64, 65, 64, 63, 62, 61, 60, 59
]
df = pd.DataFrame({'age': ages})
scaler = StandardScaler()
df['zage'] = scaler.fit_transform(df[['age']])

Normalization
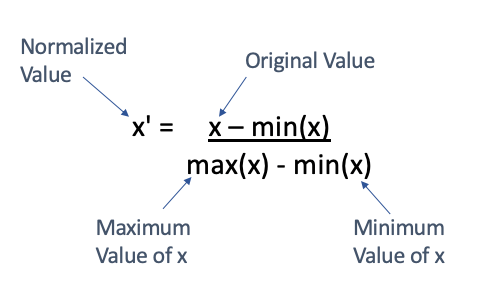
This technique scales the features to a fixed range, typically between 0 and 1, although it can also be used to scale data between -1 and 1. It ensures that all features contribute equally to the model, especially in algorithms like k-Nearest Neighbours and Neural Networks, which are sensitive to the scale of the input data.
from sklearn.preprocessing import MinMaxScaler
import pandas as pd

ages = [56, 46, 32, 60, 25, 37, 42, 50, 29, 33]
df = pd.DataFrame({'age': ages})

scaler = MinMaxScaler()
df['norm_age'] = scaler.fit_transform(df[['age']])
In this example, MinMaxScaler is used to transform the "age" column into "norm_age," with values scaled between 0 and 1. This process ensures that all features have the same importance when training the model.
Without normalization, features with larger ranges could dominate the model's learning process, leading to biased predictions. It ensures that each feature contributes proportionately to the outcome.
While standardization and normalization are commonly used, there are other scaling techniques that can be more appropriate depending on the data distribution and the specific requirements of the machine learning model.
MaxAbs Scaling
MaxAbs Scaling scales each feature by its maximum absolute value. This technique preserves the sparsity of the data, making it particularly useful for data with a lot of zeros or when we don't want to center the data (mean = 0). Each feature is scaled by dividing by its maximum absolute value, resulting in values between -1 and 1.
MaxAbs Scaling is ideal for sparse datasets, such as term frequency matrices in text processing or when dealing with features that already include zero values and we won't want to shift them.
Consider a dataset with both positive and negative values, and we wish to scale them to lie within the range of -1 to 1 without altering the original data's sparsity:
import numpy as np
from sklearn.preprocessing import MaxAbsScaler

data = np.array([[ 1., -1.,  2.],
                 [ 2.,  0.,  0.],
                 [ 0.,  1., -1.]])
scaler = MaxAbsScaler()
scaled_data = scaler.fit_transform(data)
MinAbs Scaling
MinMax Scaling is a normalization technique that scales the data to a fixed range, usually [0, 1]. Unlike MaxAbs Scaling, MinMax Scaling shifts and scales the data, adjusting both the minimum and maximum values.

MinMax Scaling is useful when the data has a well-defined range and you want to preserve the relationships between the values while scaling them to a smaller range.
from sklearn.preprocessing import MinMaxScaler
scaler = MinMaxScaler()
df['minmax_scaled'] = scaler.fit_transform(df[['feature']])
Robust Scaling
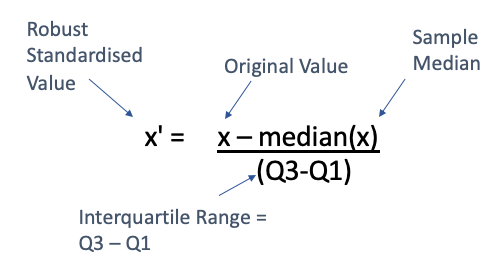
Robust Scaling uses the median and the interquartile range (IQR) for scaling. It is designed to be robust to outliers, meaning it reduces the influence of outliers compared to standard scaling methods like Z-score normalization.

from sklearn.preprocessing import RobustScaler
scaler = RobustScaler()
df['robust_scaled'] = scaler.fit_transform(df[['feature']])
Robust Scaling is particularly useful when the data contains many outliers. For instance, if the dataset includes salary information where most salaries are around the average but a few extremely high or low values exist, Robust Scaling would prevent these outliers from disproportionately affecting the scaling.
For a dataset with financial data, where the median is more representative than the mean due to a few very high outliers, Robust Scaling would provide a better scaling approach.
Handling Outliers
While scaling techniques adjust the range of data, they don’t handle outliers which can skew model predictions. They can be handled in other ways:
Capping/Flooring: Limiting the values to a certain range.
Removing: Discarding rows with extreme outliers.
Transforming: Applying transformations (e.g., log transformation) to reduce the impact of outliers.
Statistical Methods: like the IQR (Interquartile Range) or Z-score
Automating Feature Engineering
Feature engineering is a critical component in the machine learning pipeline. In industry scale projects, the demand for high-quality features grows exponentially with the complexity of the data. As organizations collect more data from diverse sources, the manually performing feature engineering becomes impractical. This is where automated feature engineering comes into play, by rapidly generating and evaluating features, automated systems can accelerate the development cycle and shorten the time to produce and deploy high quality machine learning solutions.
Benefits of Automating Feature Engineering:
Efficiency and Speed: Automation significantly reduces the time and effort required to engineer features, enabling engineers to focus on higher-level tasks such as model tuning and interpretation.
Scalability: Automated feature engineering is particularly valuable in big data contexts, where the sheer volume and variety of data make manual feature engineering impractical. These systems can handle large datasets with thousands of variables, systematically exploring a vast feature space to identify the most relevant features.
Exploration of Complex Patterns: Automated feature engineering tools can uncover complex relationships and patterns in the data that might be overlooked by human analysts.
Consistency and Reproducibility: Human-generated features can vary depending on the data scientist’s experience and intuition, leading to inconsistent results across projects. Automated systems, on the other hand, apply a consistent methodology, ensuring that the feature engineering process is reproducible and less susceptible to human biases.
While feature engineering requires a good understanding of the data and domain knowledge, the effort invested in crafting high-quality features often yields substantial improvements in model performance. As machine learning continues to evolve, the importance of thoughtful and innovative feature engineering will only grow, making it a critical skill to develop robust and reliable models. It serves as the bridge between raw data and actionable insights, allowing machine learning models to achieve their full potential.
Subscribe to my newsletter
Read articles from Kshitij Shresth directly inside your inbox. Subscribe to the newsletter, and don't miss out.
Written by

Kshitij Shresth
Kshitij Shresth
hi.