Building a Production-Ready CI/CD Pipeline: A Comprehensive Guide to DevOps
 Shubham Taware
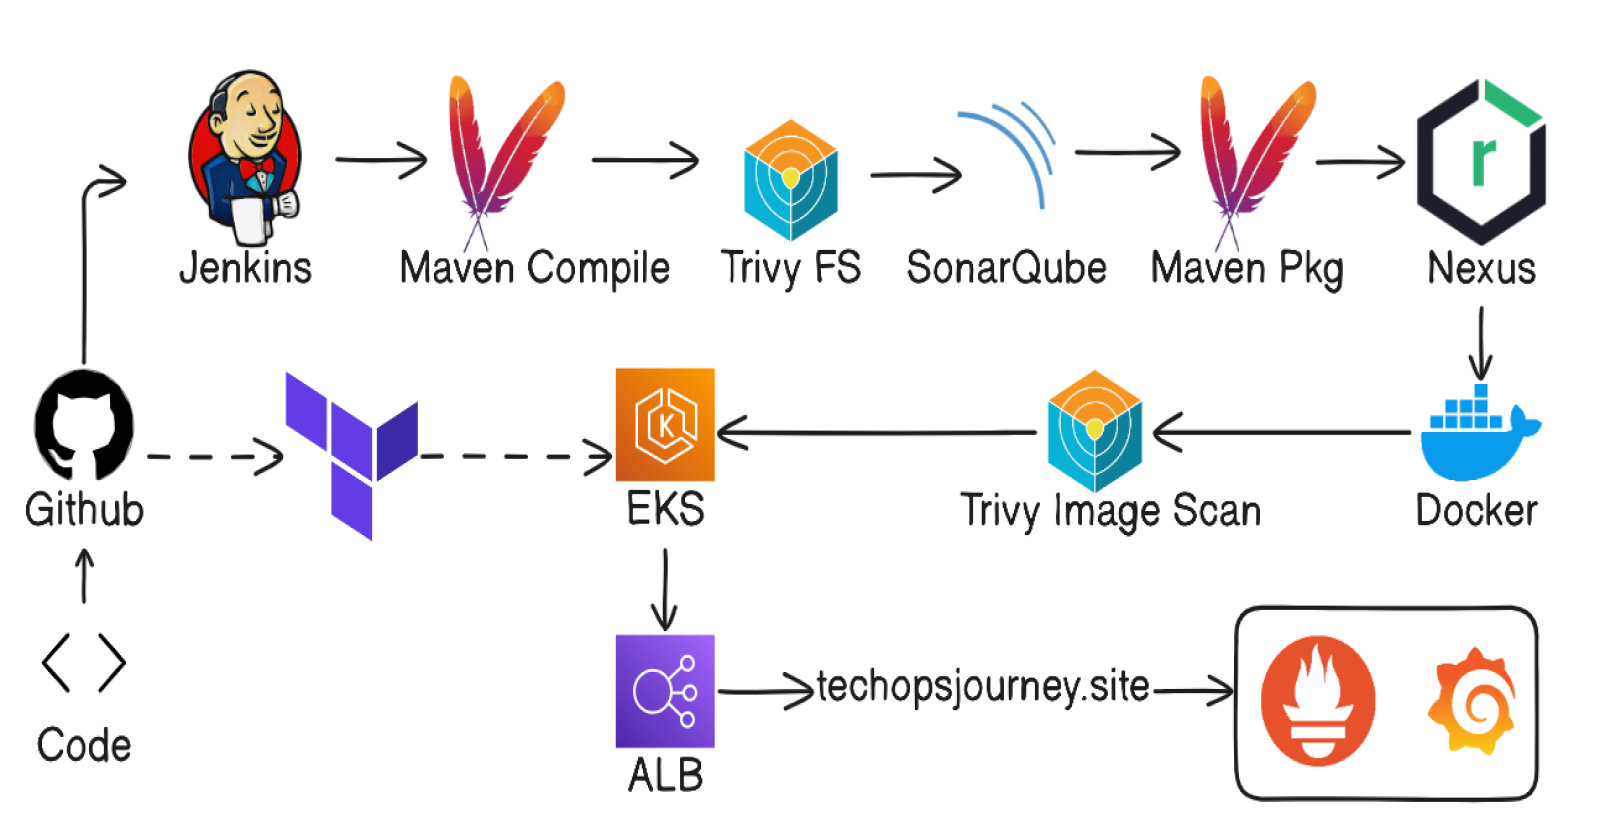
In this blog, we explore the creation of a production-level CI/CD pipeline that automates the entire development and deployment process. By integrating essential tools like GitHub for source code management, Maven for builds, Trivy for security scanning, SonarQube for code quality, Docker for containerization, Terraform for infrastructure provisioning, Kubernetes for deployment, Prometheus and Grafana for monitoring, and a custom domain for hosting or accessing the deployed application, we’ll guide you through setting up a seamless and efficient workflow from code to production. Whether you're a DevOps enthusiast or a seasoned professional, this guide will elevate your CI/CD practices.
Technologies/Tools Used:
GitHub: Github for source code management.
Maven: For building the Java application.
Trivy: For scanning the code and Docker images for vulnerabilities.
SonarQube: For analyzing code quality, code smells, and code coverage.
Docker: For containerizing the application.
Docker Hub: For storing the Docker images.
Terraform: For provisioning the EKS cluster on AWS.
Kubernetes (EKS): For deploying the application on cluster.
Prometheus: Collecting the metrics in time series database.
Grafana: Visualize and explore metrics.
Prerequisites:
Github repository: clone repository for source code management and terraform files.
Github: https://github.com/jaiswaladi246/Full Stack-Blogging-App.git
AWS Account: for provisioning the EKS.
Domain name ( optional )
1 - Configuring SonarQube, Jenkins and Nexus:
Creating t2.medium instances for SonarQube and Nexus with minimum 12 GB of storage.
Nexus:
SSH into nexus ec2 instance and run the update command.
sudo apt updateInstall docker and run the nexus docker container using the command:
sudo docker run -d -p 8081:8081 sonatype/nexus3You can access the nexus using the <nexus-ec2-public-ip>:8081.
Next to you need to sign in into nexus using the username: admin and password we need to check for the file /nexus-data/admin.password inside the nexus container for that follow below commands:
  sudo docker exec -it containerid /bin/bash
  cd sonatype-work
  cd nexus3
  cat admin.password
SonarQube:
SSH into nexus ec2 instance and run the update command.
Install docker and run the sonarqube docker container using the command:
docker run -d --name sonar -p 9000:9000 sonarqube:lts-communityYou can access the sonarqube using the <sonar-ec2-public-ip>:9000.
Next to sign in into sonarqube enter username: admin and password: admin.
Create token by clicking Administration > Security > Users > Generate token > copy token.
Jenkins:
Here we will be create instance for Jenkins as well as we will go through steps for installing and configuring Jenkins.
Create t2.large with 25 GB of storage for Jenkins.
SSH into the instance.
Install Java (17 preferred).
Install Jenkins.
Install Docker and give permission to the users for the docker.sock file (not recommended).
  #Give read, write permissions to all users for docker.sock file
  sudo chmod 666 /var/run/docker.sock
Access the jenkins server on <ec2-public-ip>:8080 and provide username as admin and password we will get using the command:
sudo cat /var/lib/jenkins/secrets/initialAdminPasswordAs you login go with the install suggested plugin option
Install Plugins:
- SonarQube scanner
- Config File Provider
- Maven Integration
- Pipeline Maven Integration
- Kubernetes
- Kubernetes Credentials
- Kubernetes CLI
- Kubernetes Client API
- Docker
- Docker Pipeline
- Eclipse Temurin Installer
- Pipeline stage view
Installing Tools:
In Jenkins > Tools
Docker Installations: name= docker; installer=download from docker.com
Maven: name= maven3; Install from apache; version=3.9.8
SonarQube Scanner: name=sonar-scanner; Install from maven central; version=6.1.0.4477
JDK: name= jdk17; install automatically from adoptium.net; version=17.0.11+9
2 - Configure SonarQube Server:
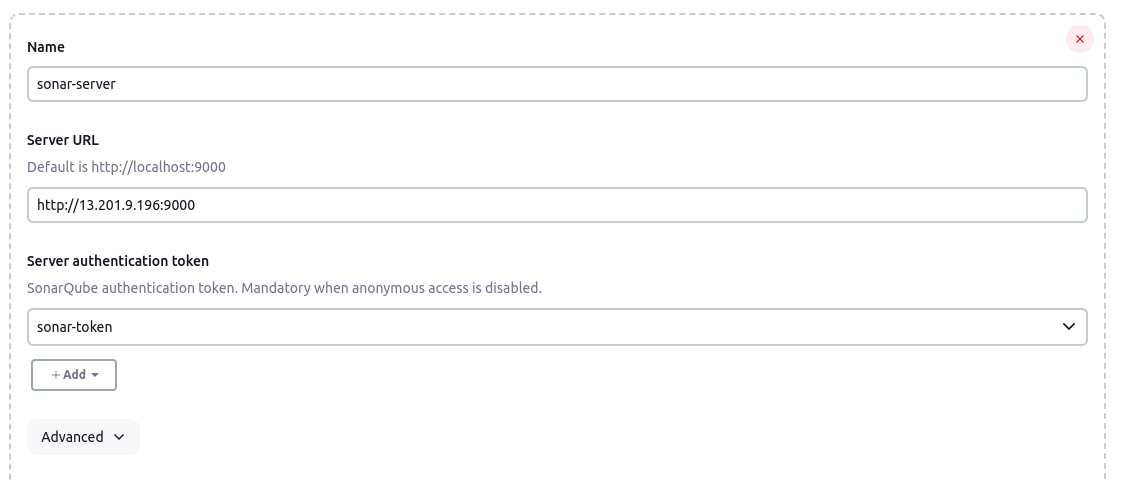
To configure sonarqube server go to Jenkins server > Dashboard > Manage Jenkins > System
Under SonarQube server click on add SonarQube
Add name= sonar-server
url= <sonarserver-ip>:9000
Select created credential as token. Click Apply.
3 - Configure Nexus:
Add URL to pom.xml
To configure nexus first go to nexus > browse > copy maven releases url and paste it in the <maven-release> url section inside pom.xml of source code.
For maven-snapshot copy the url from nexus > browse > copy maven-snapshot url and paste in the <maven-snapshots> url section inside pom.xml of source code.
 <distributionManagement>
         <repository>
             <id>maven-releases</id>
             <url>http://3.110.172.144:8081/repository/maven-releases/</url>
         </repository>
         <snapshotRepository>
             <id>maven-snapshots</id>
             <url>http://3.110.172.144:8081/repository/maven-snapshots/</url>
         </snapshotRepository>
     </distributionManagement>
Nexus Credentials:
Go to Jenkins > Dashboard > Manage Jenkins > Managed Files > Click Add new config > Id= maven-settings > Next
You will get the maven settings file, inside file find the <server> </server> section and uncomment it. And make 2 copies of it.
 <server>
     <id>maven-releases</id>
     <username>nexus_username</username>
     <password>nexus_password</password>
 </server>
 <server>
     <id>maven-snapshots</id>
     <username>nexus_username</username>
     <password>nexus_password</password>
 </server>
Click Save.
4 - Install Trivy:
SSH into the Jenkins EC2 and run the following commands for installing Trivy:
  sudo apt-get install wget apt-transport-https gnupg lsb-release
  wget -qO - https://aquasecurity.github.io/trivy-repo/deb/public.key | sudo apt-key add -
  echo deb https://aquasecurity.github.io/trivy-repo/deb $(lsb_release -sc) main | sudo tee -a /etc/apt/sources.list.d/trivy.list
  sudo apt-get update
  sudo apt-get install trivy
5 - Configure Terraform and provision EKS Cluster:
Create t2.medium instance for terraform with 10 GB of storage.
SSH into instance and follow the below commands to install terraform and aws cli:
  #Install AWS CLI
  curl "https://awscli.amazonaws.com/awscli-exe-linux-x86_64.zip" -o "awscliv2.zip"
  unzip awscliv2.zip
  sudo ./aws/install

  #Install Terraform
  sudo snap install terraform --classic
Next, we have to login to the aws cli using the access keys to get access keys follow the below commands (root access keys not recommended):
Create user in IAM with administrator access(no good practice).

Click on use and click on security credentials.
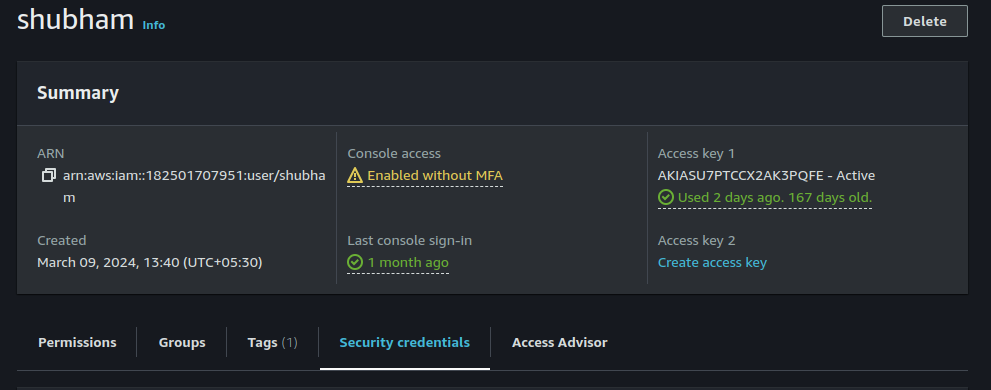
Next, click on access keys > select CLI and download the access keys.

Using the access keys login to the aws cli:
  #Command to login to aws using access keys
  aws configure
You will be asked for the access key and secret access keys paste it and press enter you will be logged in to the aws cli.
Copy files from terraform .tf files from github to the terraform instance.You can get files in repository/EKS-Terraform

You need to change the ssh_key_name to yours ssh_key_name in variable.tf file.
Next run terraform commands to provision the EKS cluster.
  #Initializing terraform
  terraform init

  #Terraform planning the resources
  terraform plan

  #Apply changes to aws
  terraform apply
Now the cluster is created, you need kubectl to access the cluster to install kubectl run the below command:
sudo snap install kubectl --classicNow we will be accessing the cluster using the command:
  #Access the cluster
  aws eks --region ap-south-1 update-kubeconfig --name devopsshack-cluster

  #Verify cluster
  kubectl get nodes
6 - Configure credentials in EKS cluster:
To access the EKS cluster using the Jenkins pipeline we need Jenkins to have access to EKS, for that we will be creating the Service Account in webapps namespace which jenkins will use to access the EKS resources.
Creating namespace webapps in EKS:
kubectl create ns webappsCreating service account first create service_acc.yml with content as:
  apiVersion: v1
  kind: ServiceAccount
  metadata:
    name: jenkins
    namespace: webapps
To create service account run command:
kubectl apply -f service_acc.ymlNow we will be creating role to attach with the service account we will create a file role.yml with content:
  apiVersion: rbac.authorization.k8s.io/v1
  kind: Role
  metadata:
    name: app-role
    namespace: webapps
  rules:
    - apiGroups:
          - ""
          - apps
          - autoscaling
          - batch
          - extensions
          - policy
          - rbac.authorization.k8s.io
      resources:
        - pods
        - secrets
        - componentstatuses
        - configmaps
        - daemonsets
        - deployments
        - events
        - endpoints
        - horizontalpodautoscalers
        - ingress
        - jobs
        - limitranges
        - namespaces
        - nodes
        - pods
        - persistentvolumes
        - persistentvolumeclaims
        - resourcequotas
        - replicasets
        - replicationcontrollers
        - serviceaccounts
        - services
      verbs: ["get", "list", "watch", "create", "update", "patch", "delete"]
To create role run command:
kubectl apply -f role.ymlNext step is to assign the created role to the service account i.e. binding the role to service account for that create file bind_role.yml with content:
  apiVersion: rbac.authorization.k8s.io/v1
  kind: RoleBinding
  metadata:
    name: app-rolebinding
    namespace: webapps
  roleRef:
    apiGroup: rbac.authorization.k8s.io
    kind: Role
    name: app-role
  subjects:
  - namespace: webapps
    kind: ServiceAccount
    name: jenkins
To bind role with service account run command:
kubectl apply -f bind_role.ymlNext create secret token for the jenkins service account, will create file jenkins_token.yml with content:
  apiVersion: v1
  kind: Secret
  type: kubernetes.io/service-account-token
  metadata:
    name: mysecretname
    annotations:
      kubernetes.io/service-account.name: jenkins
To create secret in webapps namespace run command:
kubectl apply -f jenkins_token.yml -n webappsWe will be using this secret for jenkins to EKS communication, to get the token run command:
kubectl describe secret mysecretname -n webappsYou will get the secret copy that secret.
Next, as we are using the private docker repository we need to have the dockerhub username and password with EKS to pull image from dockerhub.
We will create secret with dockerhub username and password using command:
  kubectl create secret docker-registry regcred \
     --docker-server=https://index.docker.io/v1/ \
     --docker-username=<your-name> \
     --docker-password=<your-pword> \
     --namespace=webapps
7 - Credentials:
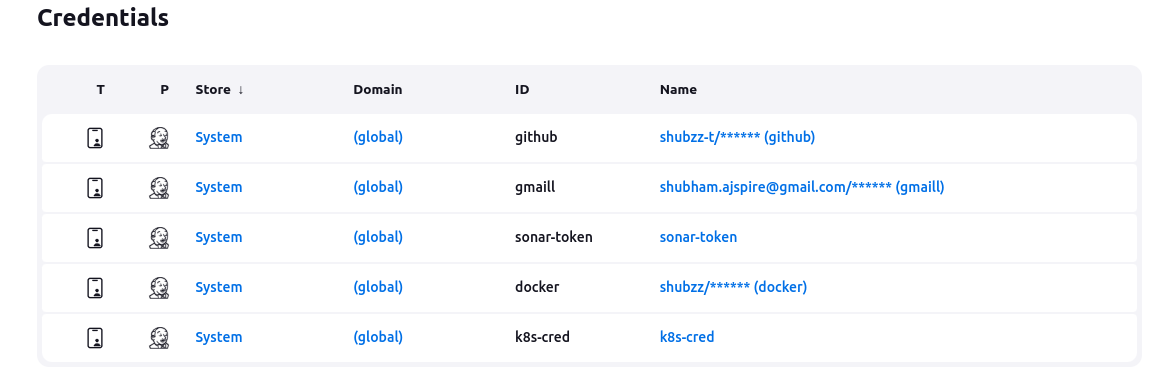
To store credentials inside Jenkins, go to Jenkins > Manage Jenkins > Manage Credentials > System > Global Credentials > Add credentials >
Git Credentials: Username & Password (github username:token)
DockerHub: Username with password ( dockerhub username:password ).
SonarQube: Secret Text ( Copied SonarQube token).
Kubernetes: Secret Text ( jenkins service account token).
Gmail(optional): Username with password ( gmail-id:application token).
8 - Creating Pipeline:
Click Dashboard > New Item > Project name > select pipeline > OK
Click Discard old builds > Max build =2
Next create pipeline:
 pipeline {
     agent any
     tools {
         jdk 'jdk17'
         maven 'maven3'
     }
     environment {
         SCANNER_HOME = tool 'sonar-scanner'
     }
     stages {
         stage('Git Checkout') {
             steps {
                 git branch: 'main', credentialsId: 'github', url: 'https://github.com/shubzz-t/Blogging_App_Java.git'
             }
         }
         stage('Compile') {
             steps {
                 sh "mvn compile"
             }
         }
         stage('Test') {
             steps {
                 sh "mvn test"
             }
         }
         stage('File System Scan') {
             steps {
                 sh "trivy fs --format table -o trivy-fs-report.html ."
             }
         }
         stage('SonarQube Analysis') {
             steps {
                 withSonarQubeEnv('sonar-server') {
                     sh ''' $SCANNER_HOME/bin/sonar-scanner -Dsonar.projectName=Blogging-App -Dsonar.projectKey=Blogging-App \
                             -Dsonar.java.binaries=target '''
                 }
             }
         }
         stage('Quality Gate') {
             steps {
                 script {
                     waitForQualityGate abortPipeline: false, credentialsId: 'sonar-token'
                 }
             }
         }
         stage('Build') {
             steps {
                 sh "mvn package"
             }
         }
         stage('Publish To Nexus') {
             steps {
                 withMaven(globalMavenSettingsConfig: 'global-settings', jdk: 'jdk17', maven: 'maven3', mavenSettingsConfig: '', traceability: true) {
                     sh "mvn deploy"
                 }
             }
         }
         stage('Build & Tag Docker Image') {
             steps {
                 script {
                     withDockerRegistry(credentialsId: 'docker', toolName: 'docker') {
                         sh "docker build -t shubzz/blogging-app:latest ."
                     }
                 }
             }
         }
         stage('Docker Image Scan') {
             steps {
                 sh "trivy image --format table -o trivy-image-report.html shubzz/blogging-app:latest "
             }
         }

         stage('Push Docker Image') {
             steps {
                script {
                    withDockerRegistry(credentialsId: 'docker', toolName: 'docker') {
                             sh "docker push shubzz/blogging-app:latest"
                     }
                }
             }
         }

         stage('Deploy to K8S'){
             steps{
                 withKubeConfig(caCertificate: '', clusterName: 'devopsshack-cluster', contextName: '', credentialsId: 'k8s-cred', namespace: 'webapps', restrictKubeConfigAccess: false, serverUrl: 'https://99A9506919BFC33E6952F062312B02F4.sk1.ap-south-1.eks.amazonaws.com') {
                     sh "kubectl apply -f deployment-service.yml"
                     sh "sleep 10"
                 }
             }
         }

         stage('Verify Deployment'){
             steps{
                 withKubeConfig(caCertificate: '', clusterName: 'devopsshack-cluster', contextName: '', credentialsId: 'k8s-cred', namespace: 'webapps', restrictKubeConfigAccess: false, serverUrl: 'https://99A9506919BFC33E6952F062312B02F4.sk1.ap-south-1.eks.amazonaws.com') {
                     sh "kubectl get pods -n webapps"
                     sh "kubectl get svc -n webapps"
                 }
             }
         }

     }
     post {
         always {
             script {
                 def jobName = env.JOB_NAME
                 def buildNumber = env.BUILD_NUMBER
                 def pipelineStatus = currentBuild.result ?: 'UNKNOWN'
                 def bannerColor = pipelineStatus.toUpperCase() == 'SUCCESS' ? 'green': 'red'
                 def body = """
                 <html>
                 <body>
                 <div style="border: 4px solid ${bannerColor}; padding: 10px;">
                 <h2>${jobName} - Build ${buildNumber}</h2>
                 <div style="background-color: ${bannerColor}; padding: 10px;">
                 <h3 style="color: white;">Pipeline Status: ${pipelineStatus.toUpperCase()}</h3>
                 </div>
                 <p>Check the <a href="${BUILD_URL}">console output</a>.</p>
                 </div>
                 </body>
                 </html>
             """
                 emailext (
                     subject: "${jobName} - Build ${buildNumber} - ${pipelineStatus.toUpperCase()}",
                     body: body,
                     to: 'shubhamtaware2001@gmail.com',
                     from: 'shubham.ajspire@gmail.com',
                     replyTo: 'shubham.ajspire@gmail.com',
                     mimeType: 'text/html',
                     attachmentsPattern: 'trivy-image-report.html'
                 )
             }
         }
     }
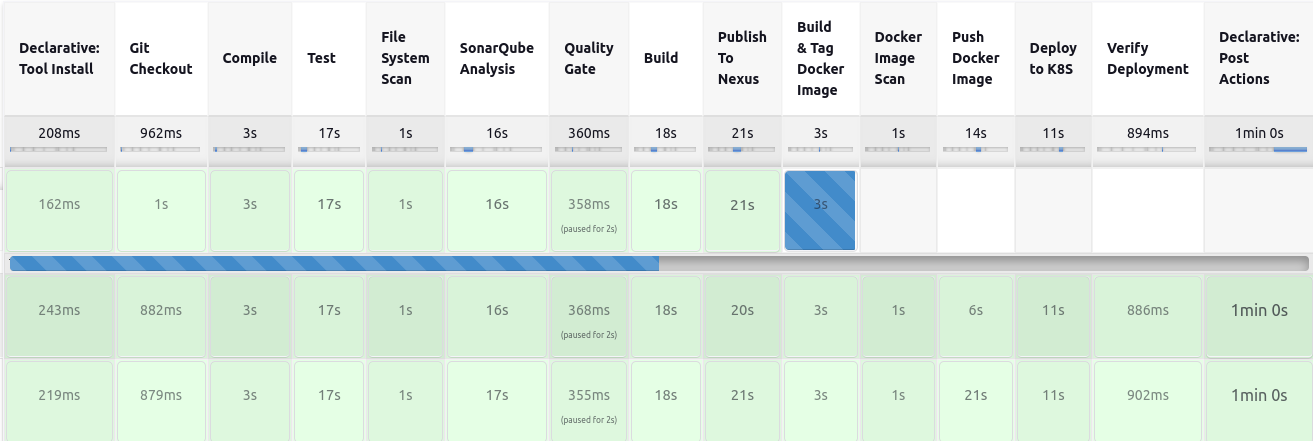
 }
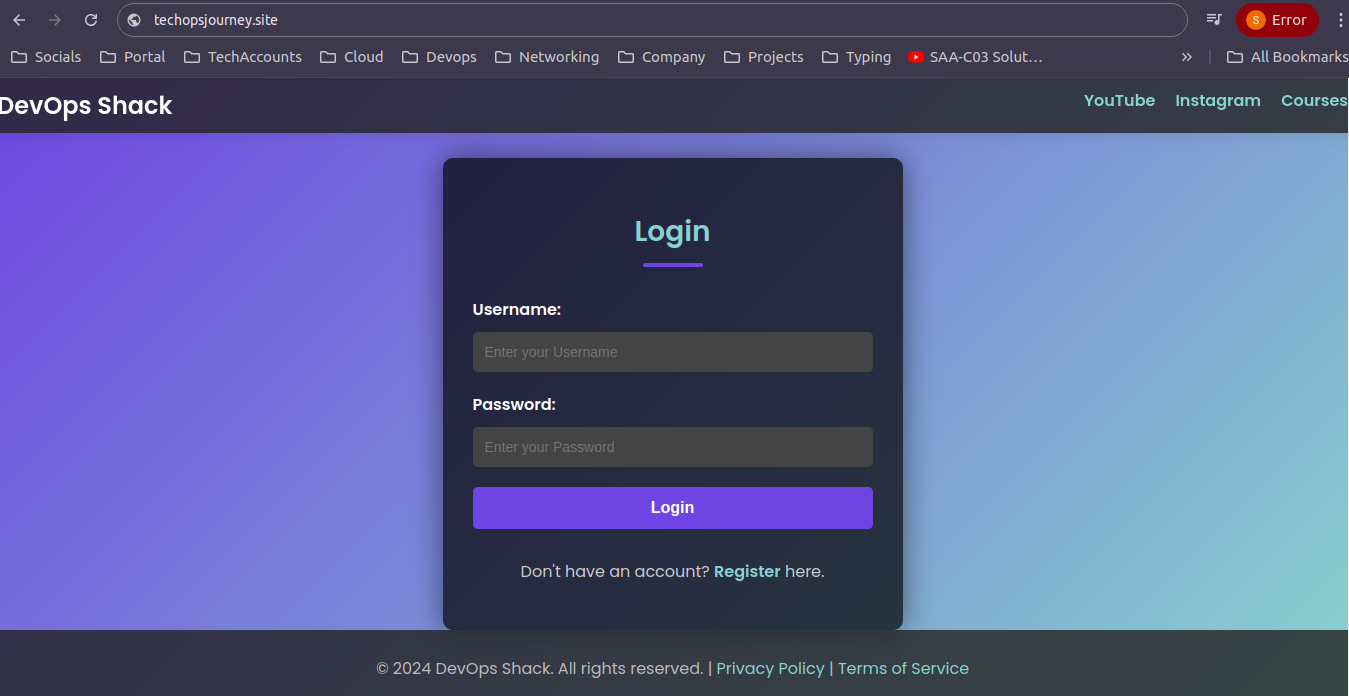
9 - Getting Domain Ready:
This step is optional step if you don't have any domain name registered you can skip this step.
Go to your domain provider in my case it is GoDaddy.com.
Click on DNS and you will get all the records in that click on the CNAME record.
Add your load balancer dns so that all request coming to your domain will be routed to load balancer dns.

Click Save and it will take time to reflect.
10 - Monitoring Application:
Create t2.large instance for installing Prometheus and Grafana which we will be using for monitoring our application.
SSH into the ec2 and run update command.
Download and install prometheus using below commands:
  wget https://github.com/prometheus/prometheus/releases/download/v2.54.0/prometheus-2.54.0.linux-amd64.tar.gz

  tar -xvf prometheus-2.54.0.linux-amd64.tar.gz

  mv prometheus-2.54.0.linux-amd64.tar.gz prometheus

  cd prometheus

  ./prometheus &
Access prometheus on <ec2-public-ip>:9000.
Download Blackbox exporter for monitoring application metrics using:
  wget https://github.com/prometheus/blackbox_exporter/releases/download/v0.25.0/blackbox_exporter-0.25.0.linux-amd64.tar.gz

  tar -xvf blackbox_exporter-0.25.0.linux-amd64.tar.gz

  mv blackbox_exporter-0.25.0.linux-amd64.tar.gz blackbox

  cd blackbox

  ./blackbox-exporter &
Download Grafana using the following commands:
  sudo apt-get install -y adduser libfontconfig1 musl

  wget https://dl.grafana.com/enterprise/release/grafana-enterprise_11.1.4_amd64.deb

  sudo dpkg -i grafana-enterprise_11.1.4_amd64.deb

  sudo /bin/systemctl start grafana-server
Grafana can be accessed on <ec2-publicip>:3000 with username= admin and password= admin.
Configure Prometheus for Blackbox metrics:
Edit the prometheus.yml file to add the blackbox configuration. Add the below snippet in prometheus.yml in scrape_configs section:
   - job_name: 'blackbox'
     metrics_path: /probe
     params:
       module: [http_2xx]  # Look for a HTTP 200 response.
     static_configs:
       - targets:
         - http://prometheus.io    # Target to probe with http.
         - https://prometheus.io   # Target to probe with https.
         - http://techopsjourney.site # Target to probe with http on port 8080.
     relabel_configs:
       - source_labels: [__address__]
         target_label: __param_target
       - source_labels: [__param_target]
         target_label: instance
       - target_label: __address__
         replacement: 127.0.0.1:9115   # The blackbox exporter's real hostname:port.
Stop the running prometheus and then restart using the commands:
 psgrep prometheus

 kill 123  #Replace 123 with the id you get after running above command

 ./prometheus &
Add Prometheus datasource to Grafana:
Go to the Grafana on <ec2-publicip>:3000 with username= admin and password= admin.
Click on connections > Datasources > Select prometheus > Add prometheus url (<ec2-public-ip>:9000)
Click save and test.
Next create dashboard with id 7587 select the datasource as prometheus and click import.
References:
For an in-depth guide on setting up a CI/CD pipeline, I highly recommend this YouTube Full Video for Project . A big thank you to Devops Shack for the excellent tutorial!
Conclusion:
In conclusion, this CI/CD pipeline automates the entire workflow from code commit to production deployment using GitHub, Maven, Trivy, SonarQube, Docker, Terraform, and Kubernetes. With integrated monitoring via Prometheus and Grafana, and seamless access through a custom domain, this project enhances deployment efficiency, security, and application performance. It's a robust solution for streamlined, reliable production deployments.
Thank you for taking the time to read my blog on setting up a CI/CD . I hope you found it informative and helpful.
If you have any questions or need further clarification on any part of the project, feel free to reach out. I'm here to help!
**Streamline, Deploy, Succeed—DevOps Made Simple!**☺️
Subscribe to my newsletter
Read articles from Shubham Taware directly inside your inbox. Subscribe to the newsletter, and don't miss out.
Written by

Shubham Taware
Shubham Taware
👨💻 Hi, I'm Shubham Taware, a Systems Engineer at Cognizant with a passion for all things DevOps. While my current role involves managing systems, I'm on an exciting journey to transition into a career in DevOps by honing my skills and expertise in this dynamic field. 🚀 I believe in the power of DevOps to streamline software development and operations, making the deployment process faster, more reliable, and efficient. Through my blog, I'm here to share my hands-on experiences, insights, and best practices in the DevOps realm as I work towards my career transition. 🔧 In my day-to-day work, I'm actively involved in implementing DevOps solutions, tackling real-world challenges, and automating processes to enhance software delivery. Whether it's CI/CD pipelines, containerization, infrastructure as code, or any other DevOps topic, I'm here to break it down, step by step. 📚 As a student, I'm continuously learning and experimenting, and I'm excited to document my progress and share the valuable lessons I gather along the way. I hope to inspire others who, like me, are looking to transition into the DevOps field and build a successful career in this exciting domain. 🌟 Join me on this journey as we explore the world of DevOps, one blog post at a time. Together, we can build a stronger foundation for successful software delivery and propel our careers forward in the exciting world of DevOps. 📧 If you have any questions, feedback, or topics you'd like me to cover, feel free to get in touch at shubhamtaware15@gmail.com. Let's learn, grow, and DevOps together!