How to Convert Diagrams into Databases in 2 Easy Steps
 Shani Rivers
Table of contents

This is part 2 of the off-platform Codecedemy Data Engineer project to build a database in PostgreSQL using Docker and Azure Data Studio. This post is to show how I built the schema using dbdiagram.io.
Introduction
When I was brushing up on my math in order to study data science, I found it quite difficult to find practice worksheets that I could use for particularly sticky topics in linear algebra and calculus.
The majority of the online worksheet web apps only offer up to algebra.
I could have bought a whole workbook from Amazon on all the topics for a particular math subject, but why waste money on something I only need to use a few practice pages of?
So I plan to build a web app that allows users to output practice problems on individual worksheets that go beyond basic algebra.
Who better to get insight on this than a teacher!
I have a family member who teaches science in middle school. She also indicated that a lot of the math practice worksheets she uses with her class, are ones that she actually has to create herself - using MS Word! 😬
So after interviewing her and getting her perspective on this, I now have a better picture as to how to capture and structure the data that would be needed to create this workbook app.
Step 1: Draw it out
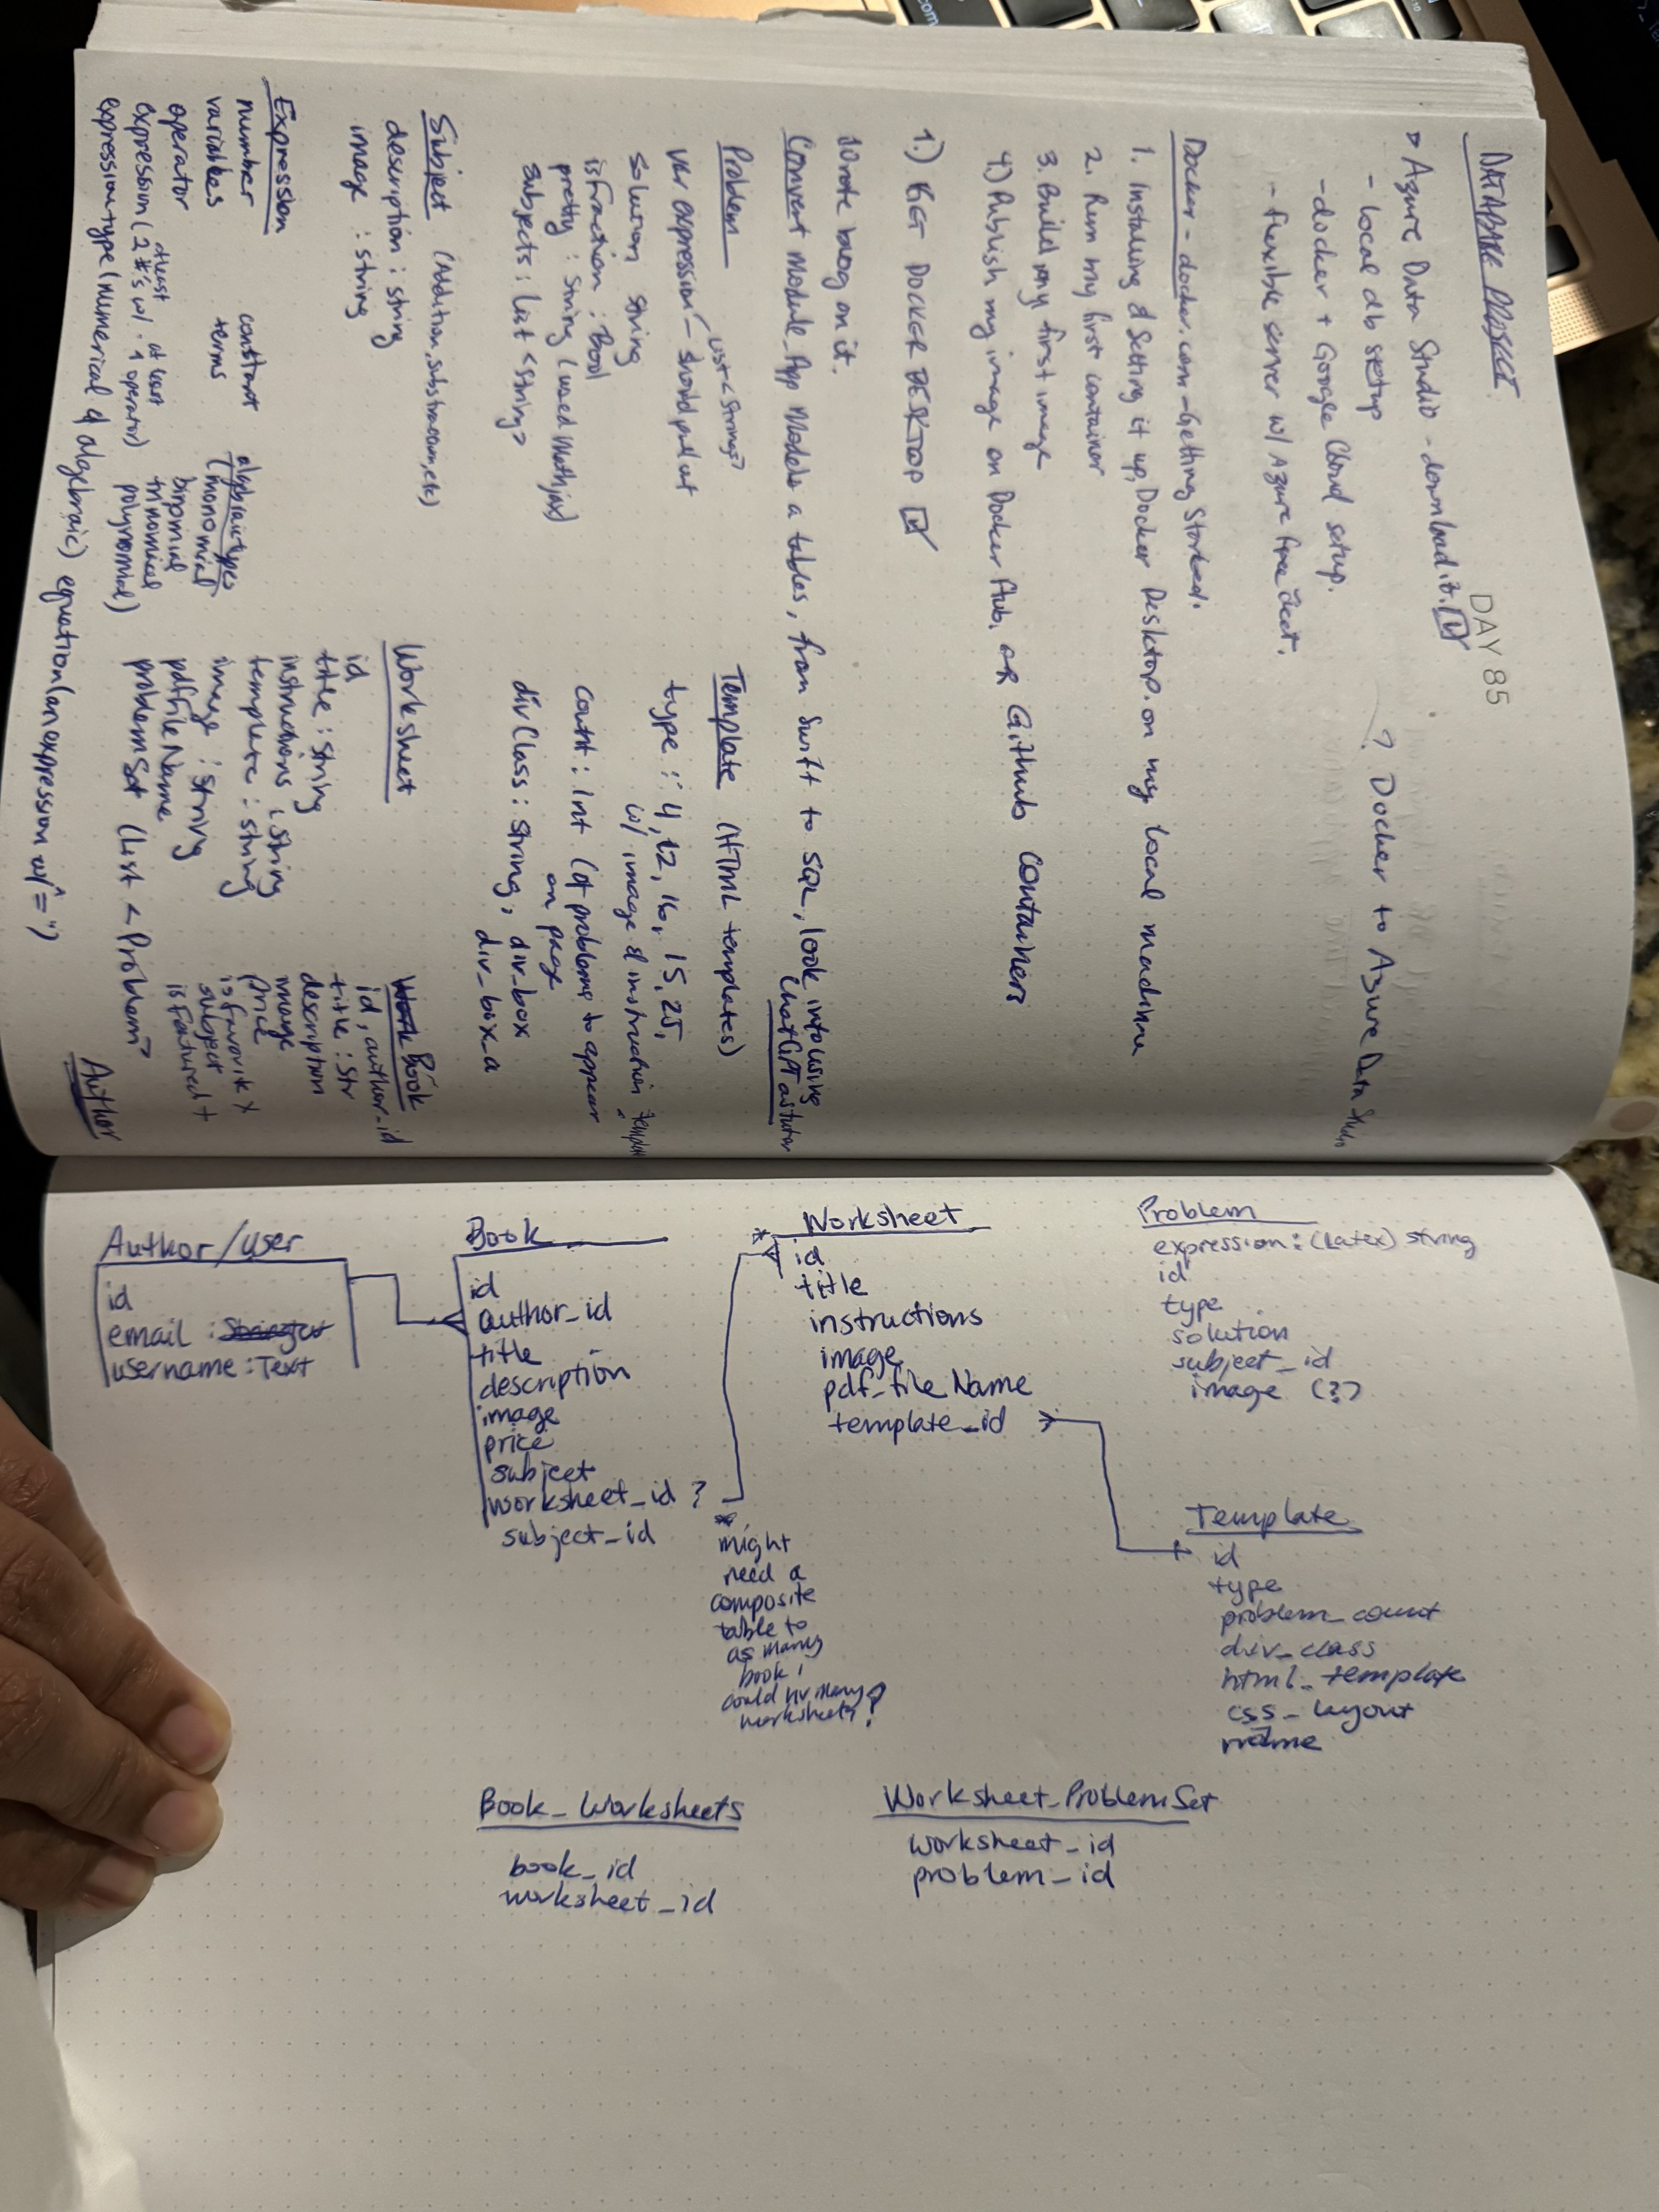
I first drew out a loose diagram in my coding journal. I tried to capture the tables, properties, details and constraints that would be needed for this database.
Sure it is messy, but it is easier to brainstorm how these connections could be made using pen and paper.

At first, I assumed that the user would want to make books then the worksheets, so my hand-drawn diagram shows this thought process.
Step 2: Diagram it with DBDiagram
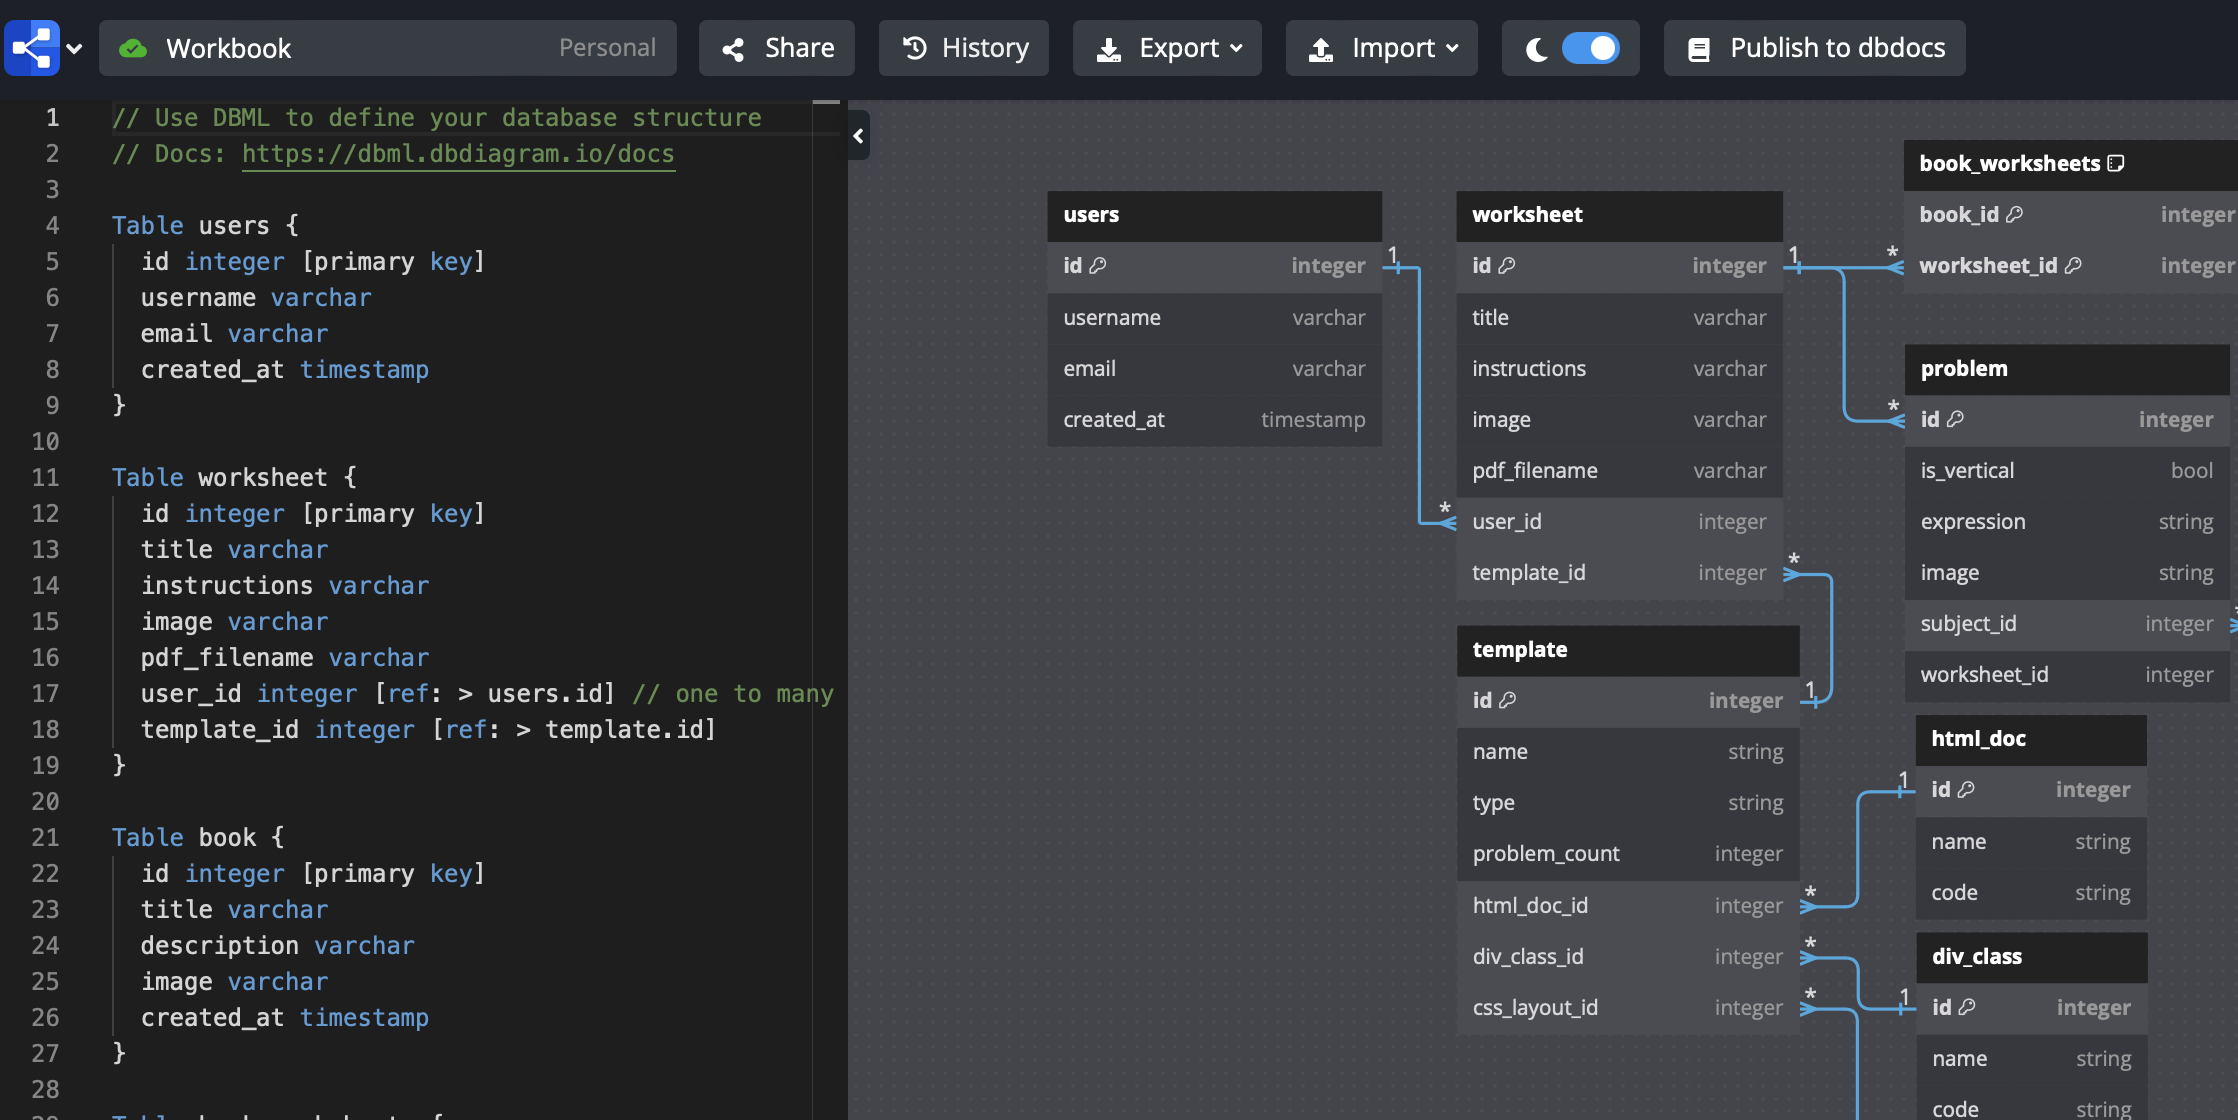
Then I used dbdiagram.io to convert my hand-drawn diagram into a real database schema.
It's super slick and free - you are limited to 10 diagrams on the free version. Plus, it didn't take too long to learn the diagramming pseudocode to build out the relationships and constraints.

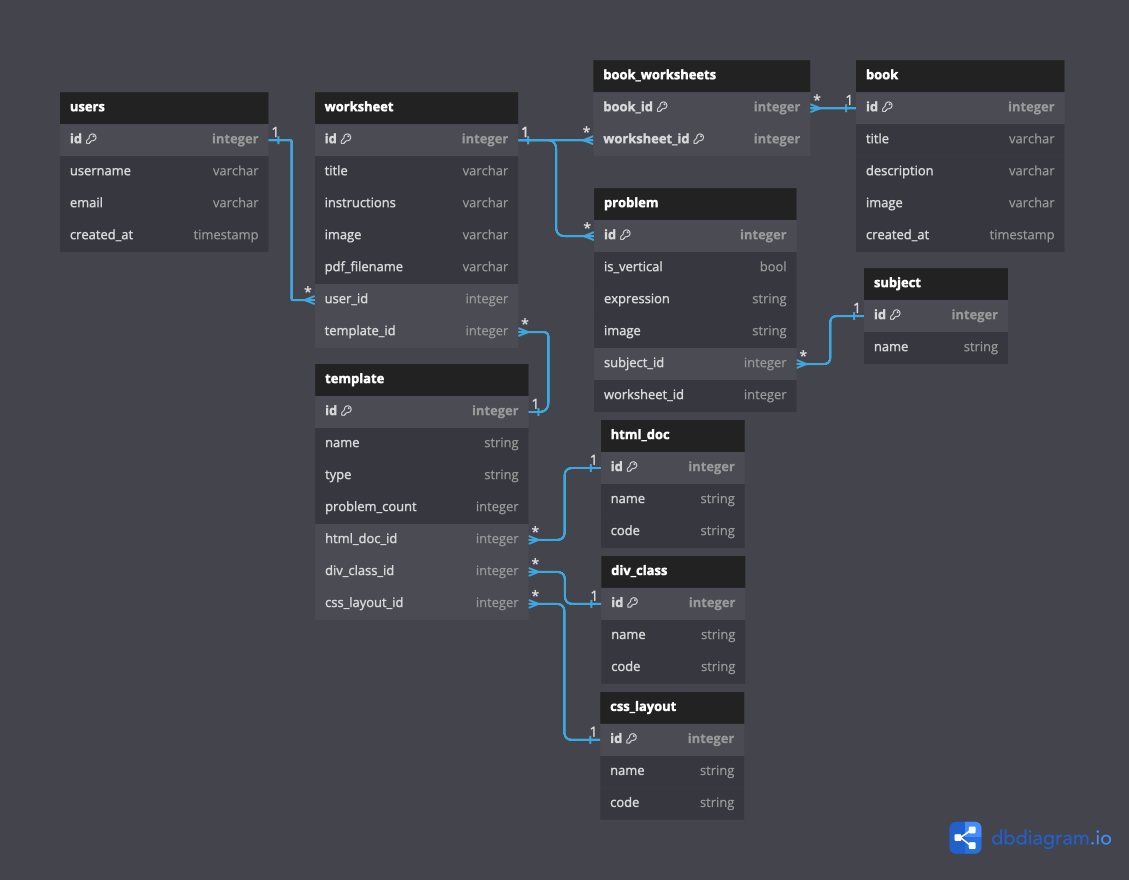
After thinking through and building out the diagram, I came to the conclusion that most users would probably just want to create a one-off worksheets first. If they wanted to curate a workbook, they would have the option to it. So I switched around the book and worksheet entities dependencies to indicate that.

Once I got the diagram to a point that I thought represented how I would like it to manage the data at this stage, I exported not only the diagram image you see above, but also its accompanying PostgreSQL file! 🤩
DBDiagram can also export your diagram as a pdf, svg and a file to create the tables in either MySQL, Oracle and MS SQL Server as well.
So now, I only have to add the file to my database and run it to create the tables.
It really can't get much easier than that! 🦾
Subscribe to my newsletter
Read articles from Shani Rivers directly inside your inbox. Subscribe to the newsletter, and don't miss out.
Written by
Shani Rivers
Shani Rivers
I'm a data enthusiast with web development and graphic design experience. I know how to build a website from scratch, but I sometimes work with entrepreneurs and small businesses with their Wix or Squarespace sites, so basically I help them to establish their online presence. When I'm not doing that, I'm studying and blogging about data engineering, data science or web development. Oh, and I'm wife and a mom to a wee tot.