DataPatternX: Candlestick Pattern Analysis Starter Kit
 Mohammad Sarabi
DataPatternX
Introducing DataPatternX, a versatile and powerful starter kit designed to simplify candlestick pattern detection and data visualization in financial datasets. Whether you're a seasoned data analyst or just getting started with market analysis, DataPatternX offers a streamlined, modular approach to identifying key market patterns using PostgreSQL and Python.
Project Overview
DataPatternX is structured to ensure ease of use and scalability. The project is organized into key modules:
DataPatternX/
│
├── .env                  # Environment variables
├── requirements.txt      # Python dependencies
├── README.md             # Project documentation
├── DataPatternX.py       # Entry point for running your project
├── .gitignore            # Git ignore file
├── LICENSE               # License information
│
├── config/               # Configuration settings
│   └── config.py
│
├── db/                   # Database connection and query execution
│   ├── connection.py
│   └── queries.py
│
├── pattern_query/        # SQL queries for pattern detection
│   ├── patterns.py
│   └── sql_files/
│       ├── engulfing_bearish.sql
│       ├── engulfing_bullish.sql
│       ...
│
└── plotter/              # Plotting functions and classes
    └── plot_chart.py
DataPatternX is structured to ensure ease of use and scalability. The project is organized into key modules:
Configuration (
config/): Manage your environment variables and settings efficiently.Database Operations (
db/): Seamlessly connect to your PostgreSQL database and execute pattern detection queries.Pattern Queries (
pattern_query/): Leverage SQL files to detect various candlestick patterns like engulfing, morning star, and more.Visualization (
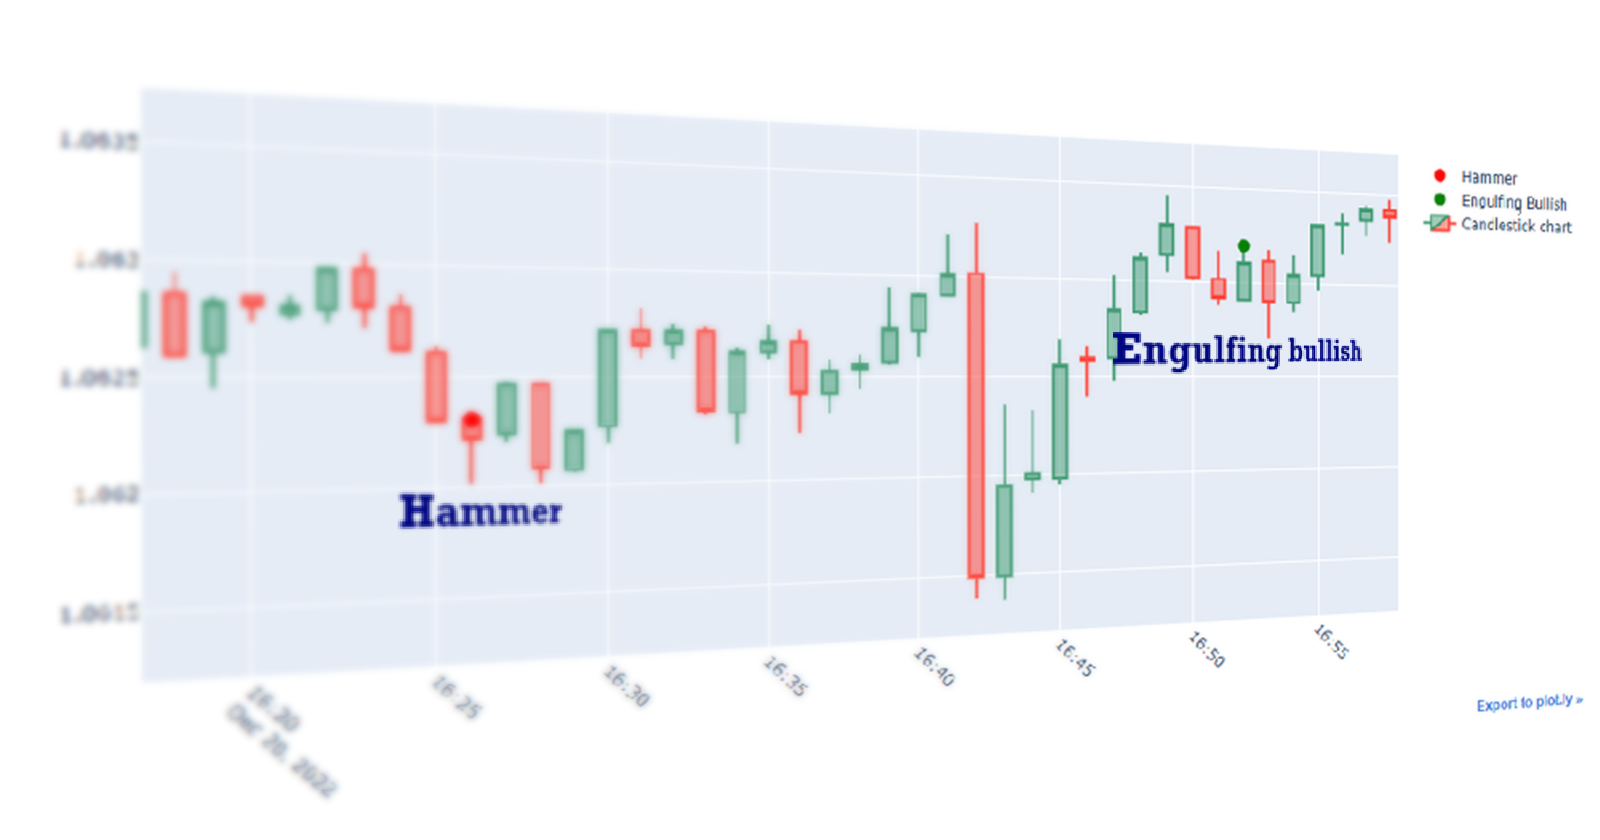
plotter/): Generate dynamic and insightful candlestick charts using Plotly, complete with markers highlighting detected patterns.Main Script (
DataPatternX.py): The entry point for running your project, with options for querying patterns, saving results, and plotting charts.
Key Features
Pattern Detection: Supports a variety of candlestick patterns with customizable SQL queries.
Database Flexibility: Easily connect to any PostgreSQL database.
Data Visualization: Create detailed candlestick charts with pattern markers.
Modular Design: Each component is designed to be reusable and extendable. Example usage:
py DataPatternX.py -t ohlc_data Hammer Engulfing_bullish --plot --save patterns.csv
Link to Kit
You can find the full project on GitHub: DataPatternX. The repository includes a comprehensive README with setup instructions, making it easy to get started.
My Journey
While working on DataPatternX, I aimed to create a tool that would not only simplify pattern detection but also make the process more intuitive for users. The choice of PostgreSQL, especially with the flexibility offered by modern solutions like Neon’s serverless Postgres, was driven by its robust support for window functions, essential for the accurate detection of patterns in time series data. Python, with its rich ecosystem of data libraries, complemented this by providing the tools necessary for analysis and visualization.
This project was meant to be a submission for the Neon Open Source Starter Kit Challenge: Ultimate Starter Kit. However, my journey with this project took an unexpected turn. As an Iranian developer, I was excited to participate in this Challenge, only to discover later that I was ineligible due to my nationality. This was disheartening, but I decided to finish and share the project anyway. Completing this starter kit was a rewarding experience, and I hope it can serve as a useful tool for the community, regardless of the circumstances.
Conclusion
Building DataPatternX allowed me to explore the intersection of financial data analysis and open-source development, pushing the boundaries of what I could achieve despite the challenges. I invite you to check out the project, write your thoughts, and explore what it has to offer.
Your feedback is highly valued
Subscribe to my newsletter
Read articles from Mohammad Sarabi directly inside your inbox. Subscribe to the newsletter, and don't miss out.
Written by

Mohammad Sarabi
Mohammad Sarabi
I am a data analyst and frontend dev from Iran.