GSoC'24 Final Blog Post
 Israel Galadima
I started out GSoC'24 with the aim of making LabPlot a more "Python-friendly" application. The project deliverables were to:
Create Python bindings to LabPlot's C++ backend, and
Enable Python programs to control a running LabPlot application.
Although these new LabPlot features aren't ready for the end-users, I have some promising results, which I'd like to showcase in this blog post.
LabPlot Python Bindings
Some LabPlot classes are now available for use in Qt-based Python applications.
Filter Classes: these classes are used to read data from various sources e.g.
AsciiFilter,JsonFilterandXLSXFilterfor reading data from csv, json and xlsx files respectively. There's also theSpiceFilter,ImageFilter,VectorBLFFilter,OdsFilterand much more.''' A python program reading data from an xlsx file (https://www.w3resource.com/python-exercises/pandas/excel/SaleData.xlsx) using the XLSXFilter class. ''' from pylabplot import XLSXFilter fileName = "SaleData.xlsx" filter = XLSXFilter() filter.setCurrentSheet("SaleData") filter.setCurrentRange("A1:H44") filter.setFirstRowAsColumnNames(True) filter.readDataFromFile(fileName) for i, sheet in enumerate(filter.sheets()): print(f"Found sheet {i + 1}: '{sheet}'") # OUTPUT ''' Found sheet 1: 'Sales Data' Found sheet 2: 'SaleData' '''Data Container Classes: these classes hold data in rows and columns for consumption and manipulation e.g
SpreadsheetandMatrixclasses''' A python program reading data from an xlsx file (https://www.w3resource.com/python-exercises/pandas/excel/SaleData.xlsx) into a Spreadsheet. ''' from PySide2.QtWidgets import QApplication from pylabplot import XLSXFilter, Spreadsheet app = QApplication() fileName = "SaleData.xlsx" container = Spreadsheet("Spreadsheet", False) filter = XLSXFilter() filter.setCurrentSheet("SaleData") filter.setCurrentRange("A1:H44") filter.setFirstRowAsColumnNames(True) filter.readDataFromFile(fileName, container) for i in range(container.columnCount()): column = container.column(i) print(f"Found column {i + 1}: '{column.name()}'") # OUTPUT ''' Found column 1: 'OrderDate' Found column 2: 'Region' Found column 3: 'Manager' Found column 4: 'SalesMan' Found column 5: 'Item' Found column 6: 'Units' Found column 7: 'Unit_price' Found column 8: 'Sale_amt' '''Column Class: this class represents a single dimension used in a
Plot.''' A python program adding numerical data to two columns using equation y = x ^ 2 ''' from PySide2.QtWidgets import QApplication from pylabplot import Column app = QApplication() count = 5 x = Column("x", Column.ColumnMode.Integer) y = Column("y", Column.ColumnMode.Integer) for i in range(count): x.setIntegerAt(i, i) y.setIntegerAt(i, i * i) for i in range(count): print(f"x{i+1} = {x.integerAt(i)}") print(f"y{i+1} = {y.integerAt(i)}") # OUTPUT ''' x1 = 0 y1 = 0 x2 = 1 y2 = 1 x3 = 2 y3 = 4 x4 = 3 y4 = 9 x5 = 4 y5 = 16 '''Plot and Curve Classes: these classes are used to create visualizations from
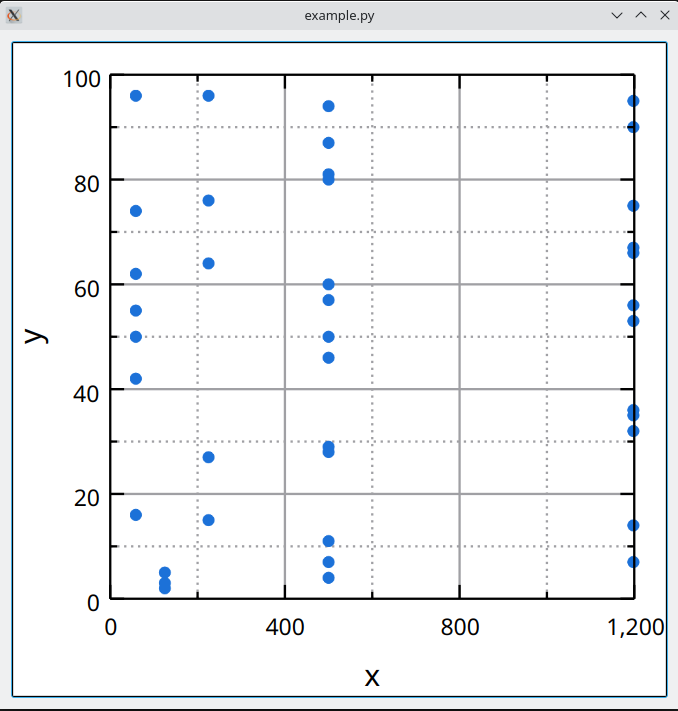
Columndata. There's theHistogram,BoxPlot,XYFitCurve,XYEquationCurveand so much more.''' A python program reading Sales Data from an xlsx file and plotting the Unit Price against Units Sold ''' # Continuing from the second code snippet above... import sys from PySide2.QtWidgets import QWidget, QHBoxLayout from pylabplot import Worksheet, CartesianPlot, XYCurve, CartesianCoordinateSystem, Symbol x2 = container.column(6) y2 = container.column(5) curve2 = XYCurve("Unit Price vs Units Sold") curve2.setXColumn(x2) curve2.setYColumn(y2) curve2.setLineType(XYCurve.LineType.NoLine) curve2.symbol().setStyle(Symbol.Style.Circle) plot2 = CartesianPlot("Plot 2") plot2.setType(CartesianPlot.Type.FourAxes) plot2.addChild(curve2) plot2.autoScale(CartesianCoordinateSystem.Dimension.X) widget = QWidget() layout = QHBoxLayout() widget.setLayout(layout) worksheet = Worksheet("Worksheet") worksheet.addChild(plot2) layout.addWidget(worksheet.view()) widget.show() sys.exit(app.exec_())OUTPUT PLOT

Scripting LabPlot
Its now possible to script a running LabPlot application with Python. Users can create a Script, write Python code in the Script's editor and run the Python code to perform some "action" in the LabPlot application.
We can add new items to the LabPlot project, as seen below.
We can also modify existing items in the LabPlot project, as seen below.
To have synergy between both features, the Python classes from our bindings are the same classes available in a Python script.
What Next?
Like I mentioned earlier these features are far from ready for the end-users. After GSoC'24, I plan to:
beautify the script editor and the output tray,
allow users cancel a running script,
allow users undo the changes made to the project by a script,
figure out the logistics of distributing the python bindings,
prepare documentation and examples for the python bindings,
and most importantly, stress test both features ;)
Thanks for reading. Till next time.
Subscribe to my newsletter
Read articles from Israel Galadima directly inside your inbox. Subscribe to the newsletter, and don't miss out.
Written by