Insert data and chart from Excel into Powerpoint automatically using Python
 Black Screen Academy
It is common to run weekly analysis and put figures and charts from this analysis into Powerpoint. I used to have such task once or twice a week as a data analyst. It is repetitive and definitely can use the help of Python to automate this process. This tutorial describes the steps you can take to automate the process of inserting data (text, table and chart) into Powerpoint from Excel.

Step 1: Prepare your Powerpoint template

Do you know that these two boxes are actually call placeholders? Microsoft explains it so:
In PowerPoint, a placeholder is a pre-formatted container on a slide for content (text, graphics, or video). The pre-set formatting makes it easier to format slides consistently.
We will first add placeholders to our powerpoint. These placeholders are going to house our data from Excel later on. Steps are different for windows and mac but you can refer to the steps explained by Microsoft here.
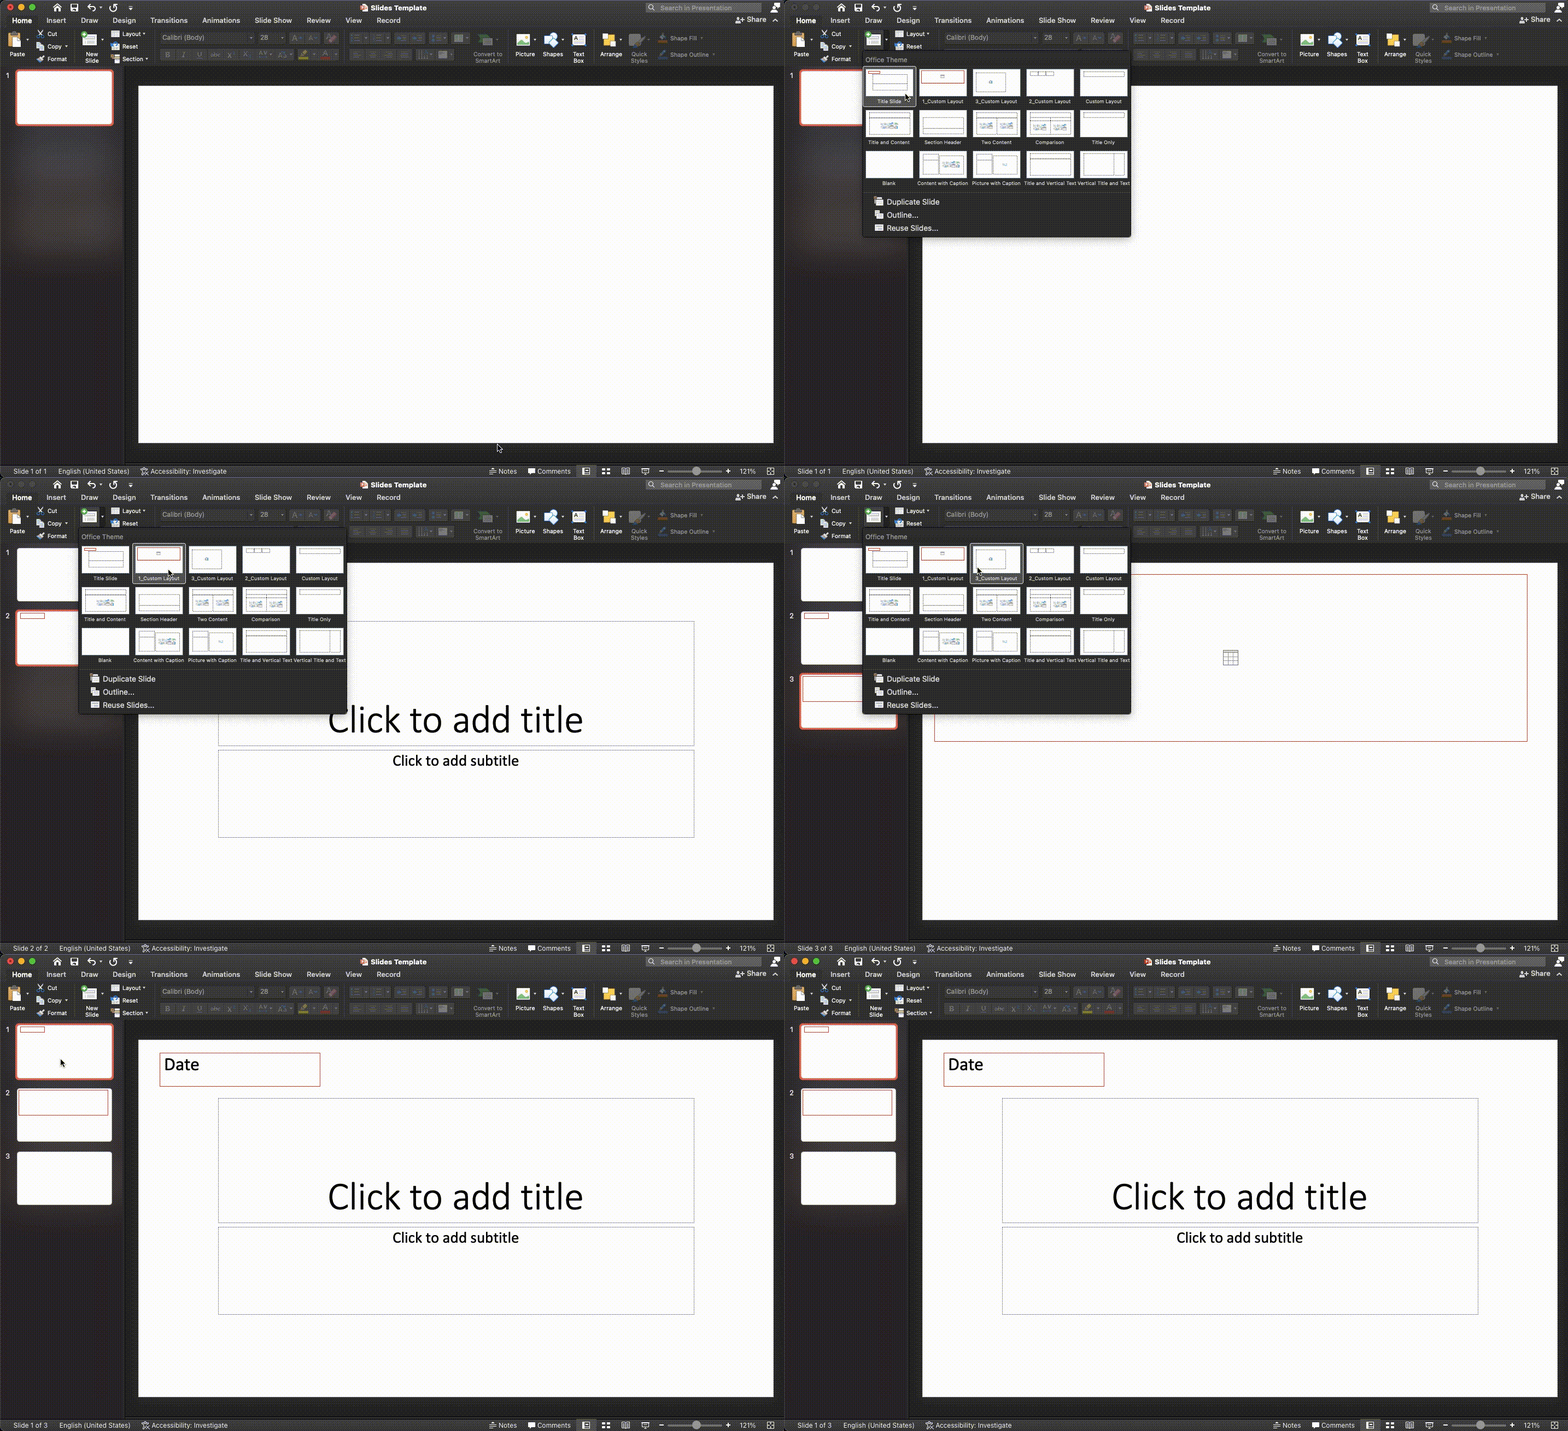
There are different type of placeholders so choose accordingly! I have created 3 different layout with different type of placeholders each:
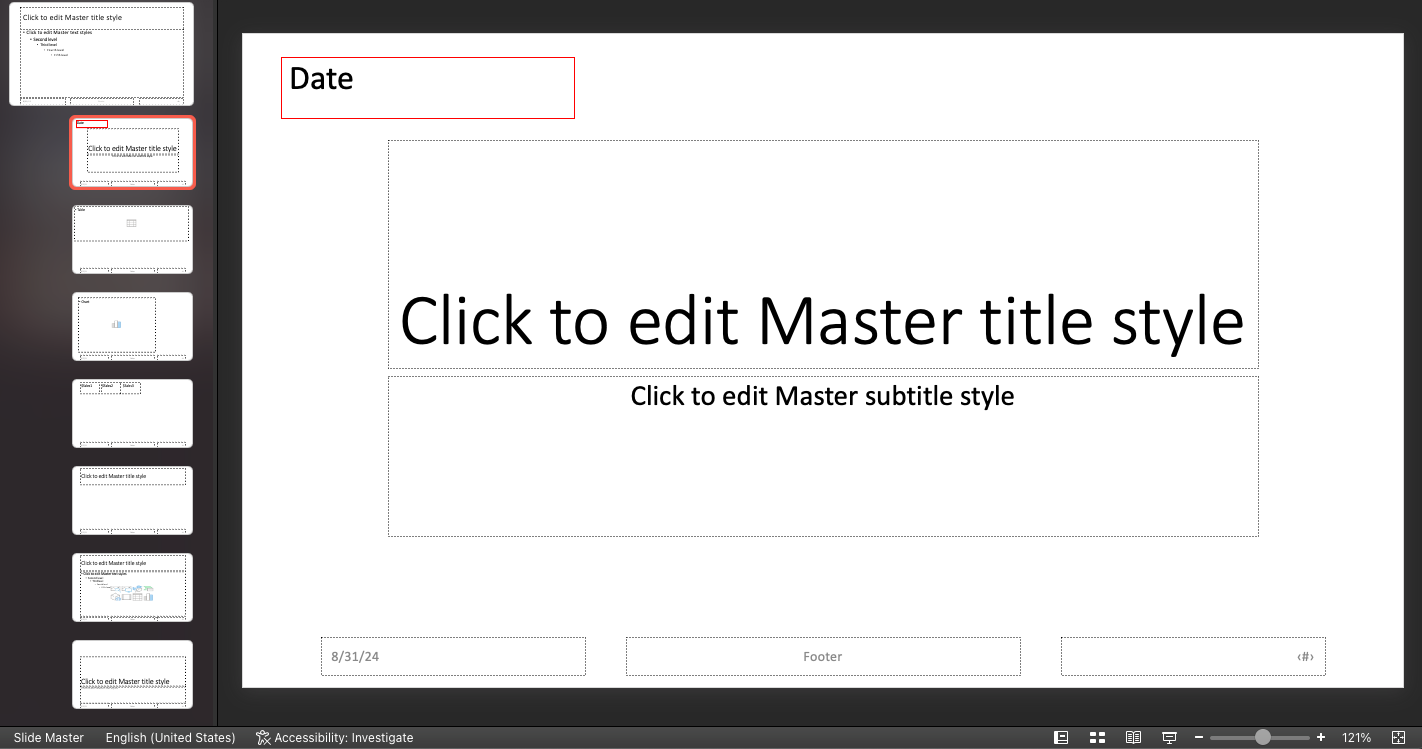
Text placeholder
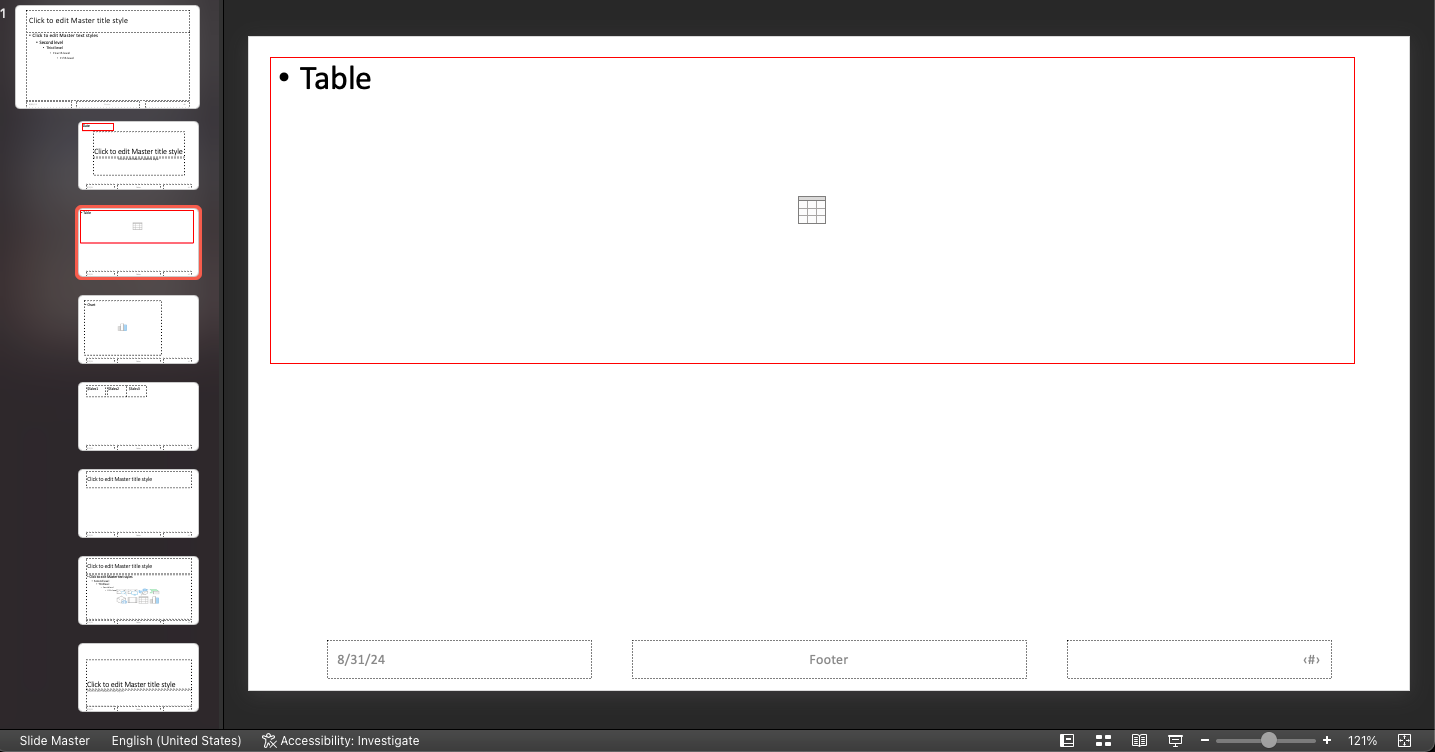
Table placeholder
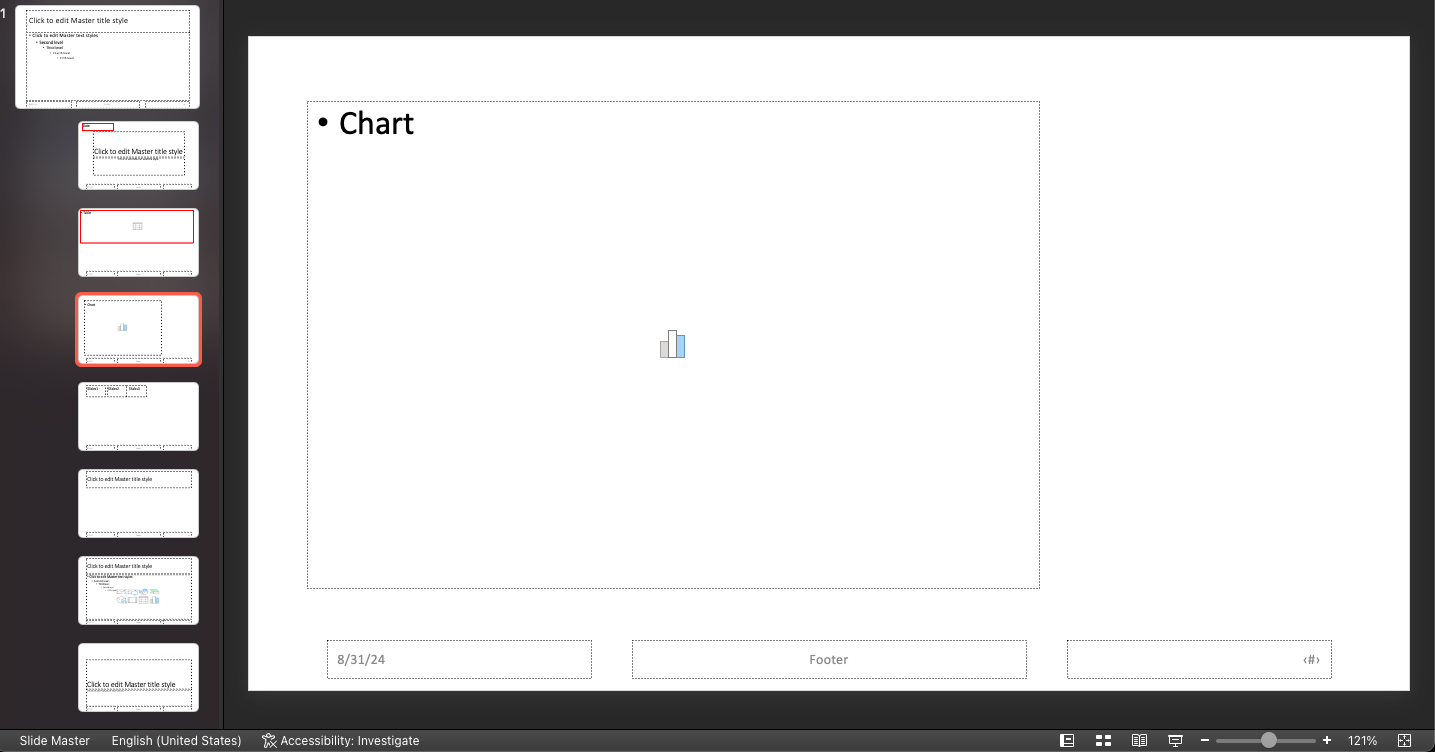
Chart placeholder
After creating these slides layout with custom placeholders, you can see these new layout when we create new slide:
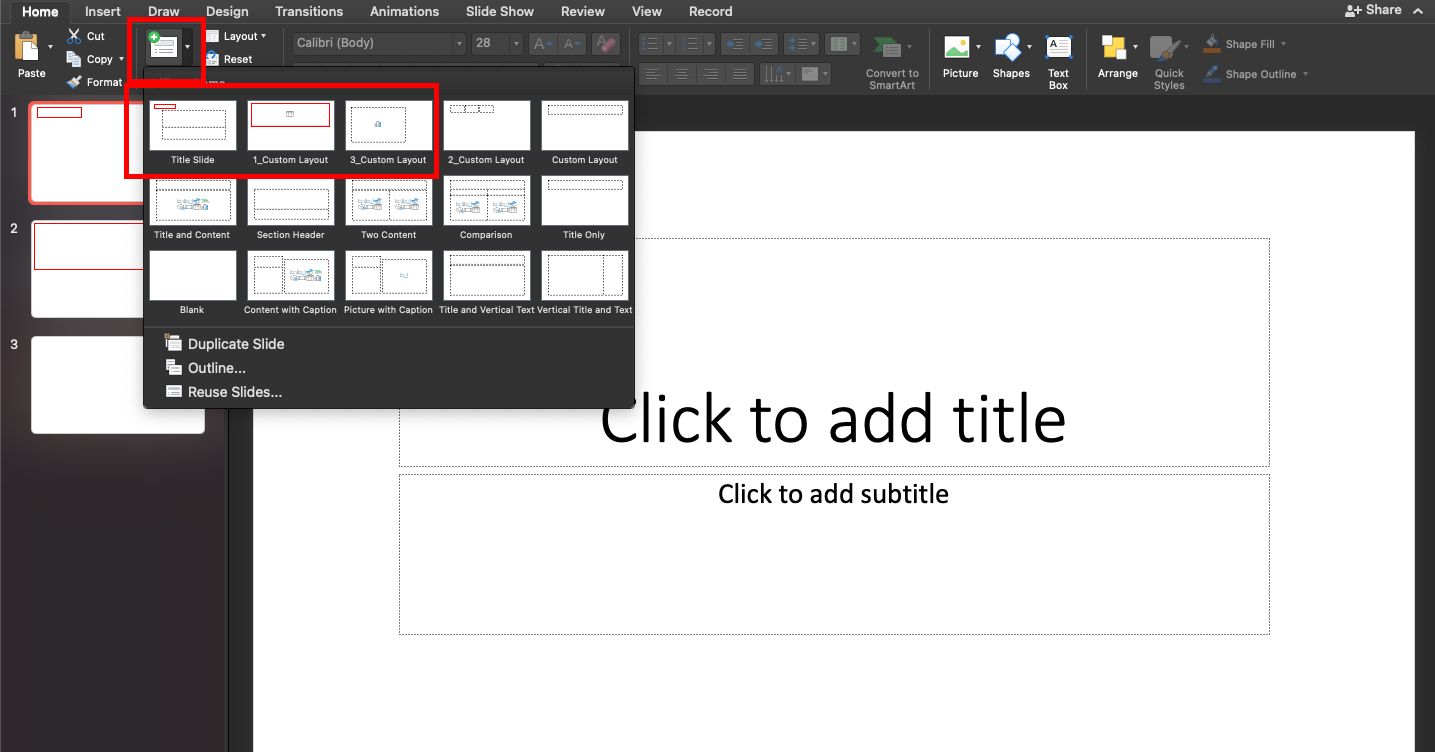
Insert 3 slides with the new layout and save it as Slides Template.pptx
Step 2: Ready your Excel
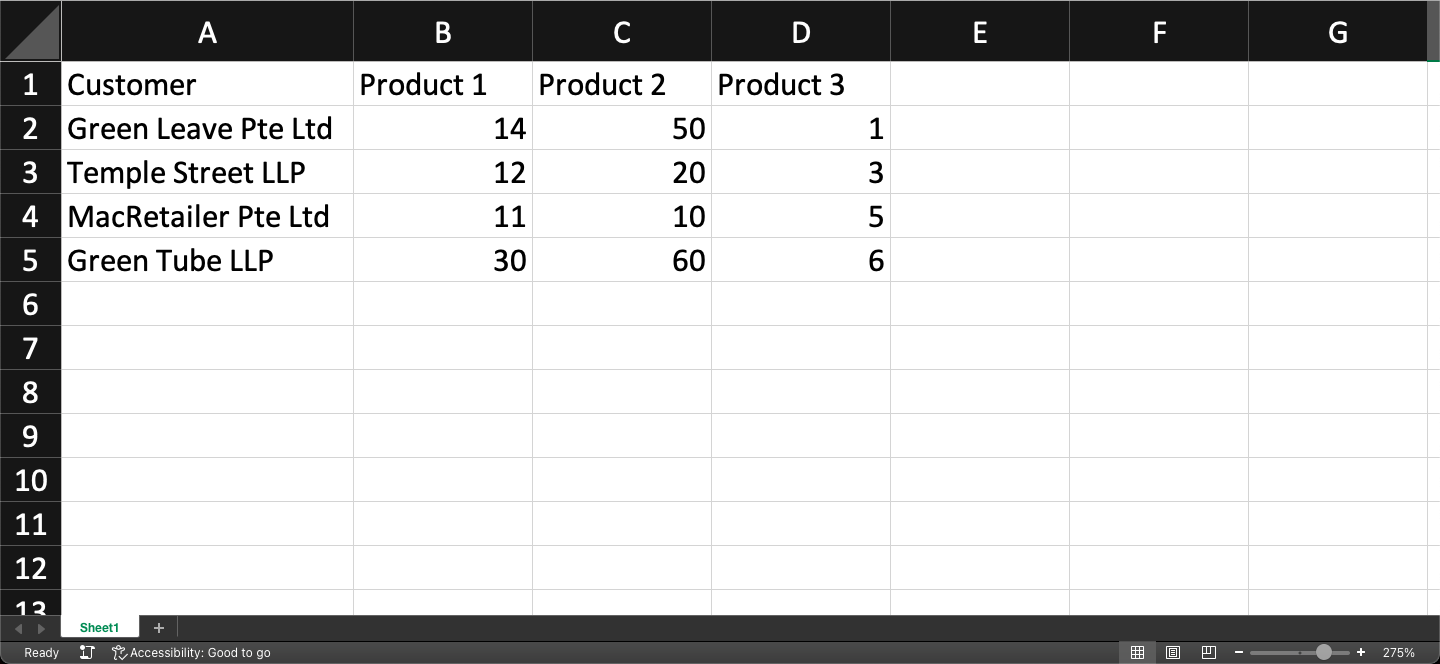
Our dummy excel contains sales data by different customers. Save it as dummy.xlsx
Step 3: Download pandas and python-pptx
The main libraries we are using are:
python-pptx: Controls powerpoint and add data
pandas: Read our excel to extract data
pip install python-pptx
pip install pandas
Step 4: Find the idx of our placeholders
Powerpoint assigns an idx to each of our placeholders created earlier. python-pptx describes this in its docs:
The most reliable way to access a known placeholder is by its
idxvalue. Theidxvalue of a placeholder is the integer key of the slide layout placeholder it inherits properties from. As such, it remains stable throughout the life of the slide and will be the same for any slide created using that layout.
This is a simple function to find out our placeholders' idx
def print_placeholders(prs: Presentation):
    "Print placeholders idx and name in each slide"
    for (idx, slide) in enumerate(prs.slides):
        for shape in slide.placeholders:
            print(f"Slide {idx + 1} - Idx {shape.placeholder_format.idx} - {shape.name}")
We first import the library and our powerpoint. Pass our powerpoint to print_placeholders to determine the idx of our placeholders:
from pptx import Presentation
prs = Presentation('Slides Template.pptx')
print_placeholders(prs)

The results correspond with the placeholders we created earlier. Note that the slide can also contain other placeholders as seen in slide 1. What we need is our idx - i.e. idx 13 in slide 1, idx 13 in slide 2 and idx 13 in slide 3.
Step 5: Adding data
This is a quick summary of the data we are going to add and the function we will use:
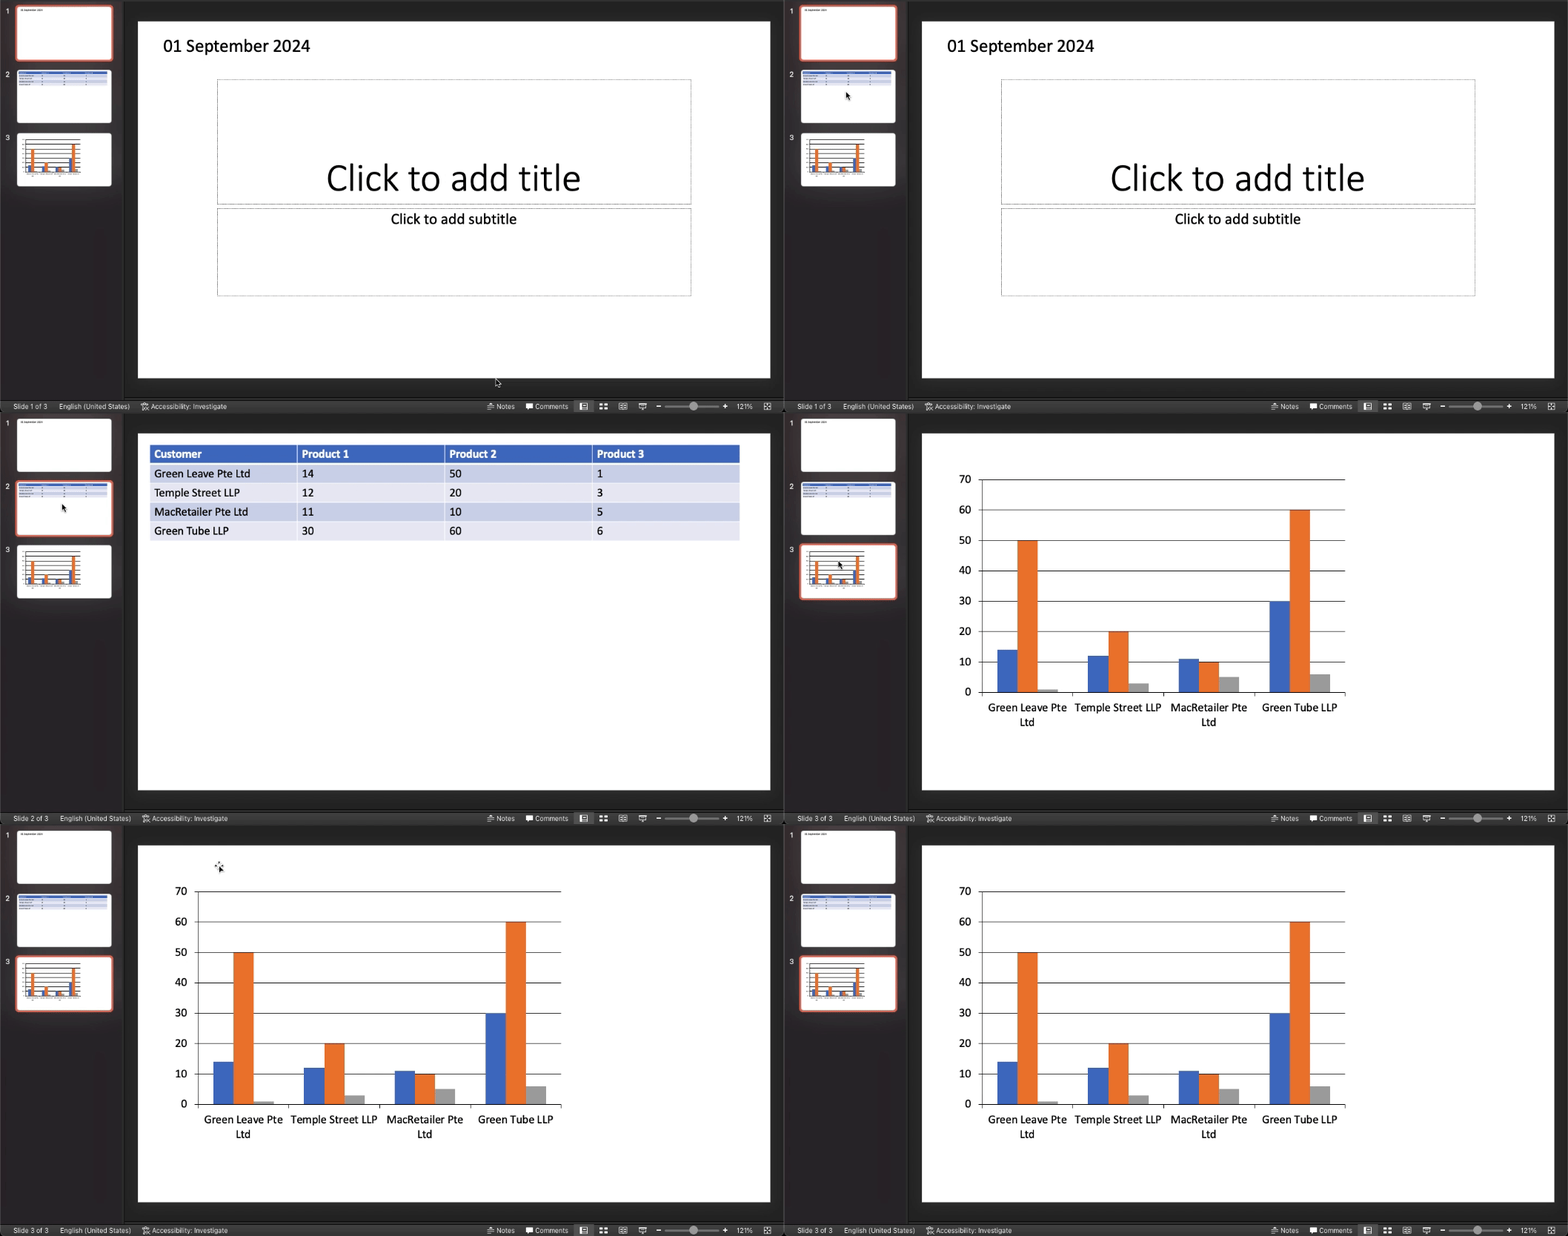
Slide 1: Add date of presentation to placeholder
idx 13usingchange_date()Slide 2: Add table to placeholder
idx 13usingadd_table()Slide 3: Add bar chart to placeholder
idx 13usingadd_chart_chart()
from pptx.util import Cm
from pptx.enum.chart import XL_CHART_TYPE
from pptx.chart.data import ChartData
from pptx.shapes import placeholder
from datetime import datetime


def change_date(placeholder: placeholder):
    "Print date of presentation in first slide"
    placeholder.text = datetime.today().strftime("%d %B %Y")


def add_table(placeholder: placeholder, df: pd.DataFrame):
    shape = placeholder.insert_table(rows=df.shape[0]+1, cols = df.shape[1])
    table = shape.table

    # add header
    df = pd.concat([df.columns.to_frame().transpose(), df]).reset_index(drop=True)

    # write to placeholder
    for rowIndex, row in df.iterrows():
        for colIndex, col in enumerate(row):
            table.cell(rowIndex,colIndex).text = str(col)

def add_bar_chart(placeholder: placeholder ,df: pd.DataFrame):
    chart_data = ChartData()

    categories = df.Customer.unique().tolist()
    chart_data.categories = categories
    chart_data.add_series('Product 1', df['Product 1'].tolist())
    chart_data.add_series('Product 2', df['Product 2'].tolist())
    chart_data.add_series('Product 3', df['Product 3'].tolist())

    x, y, cx, cy = Cm(0), Cm(0), Cm(30), Cm(8)
    placeholder.insert_chart(XL_CHART_TYPE.COLUMN_CLUSTERED, chart_data)
Not sure if I should explain the functions but the article is getting long! Comment below if you need any clarifications. Finally, we can run our functions and save it as Slides edited.pptx:
import pandas as pd

tbl = pd.read_excel("dummy.xlsx")

prs = Presentation('Slides Template.pptx')
change_date(prs.slides[0].placeholders[13])
add_table(prs.slides[1].placeholders[13], tbl)
add_bar_chart(prs.slides[2].placeholders[13], tbl)
prs.save('Slides edited.pptx')
This is how our automated slides look like:
Conclusion
With the help of python-pptx, we can automate our powerpoint slides. I created placeholder in a powerpoint and inserted data into these placeholders with the library. Hopefully this can help you automate your regularly reports!
Subscribe to my newsletter
Read articles from Black Screen Academy directly inside your inbox. Subscribe to the newsletter, and don't miss out.
Written by

Black Screen Academy
Black Screen Academy
We love Python so much that we decided to teach that in Singapore! You don't need to learn Python for a career switch. You can learn it to automate your work, perform data analysis more effectively or simply for your own interest. Unlike other schools or bootcamps, our class size is small to focus on each student. Each lesson is short for a more comfortable pacing. Sign up today and hope to see you in class soon!