Day 1 of 30 Days SOC Analyst Challenge
 Tarun Sai
Hello everyone, I am starting the 30-day MyDFIR SOC Analyst Challenge by steven. If you are interested in cybersecurity, especially in Blue Teaming, you're missing out. Steven created this challenge to help aspiring SOC analysts obtain the practical experience in 30 days.
Being curious as always, I enlisted myself into this challenge and will share my experiences here.
Day 1 - Creating a Logic Diagram - Draw.io
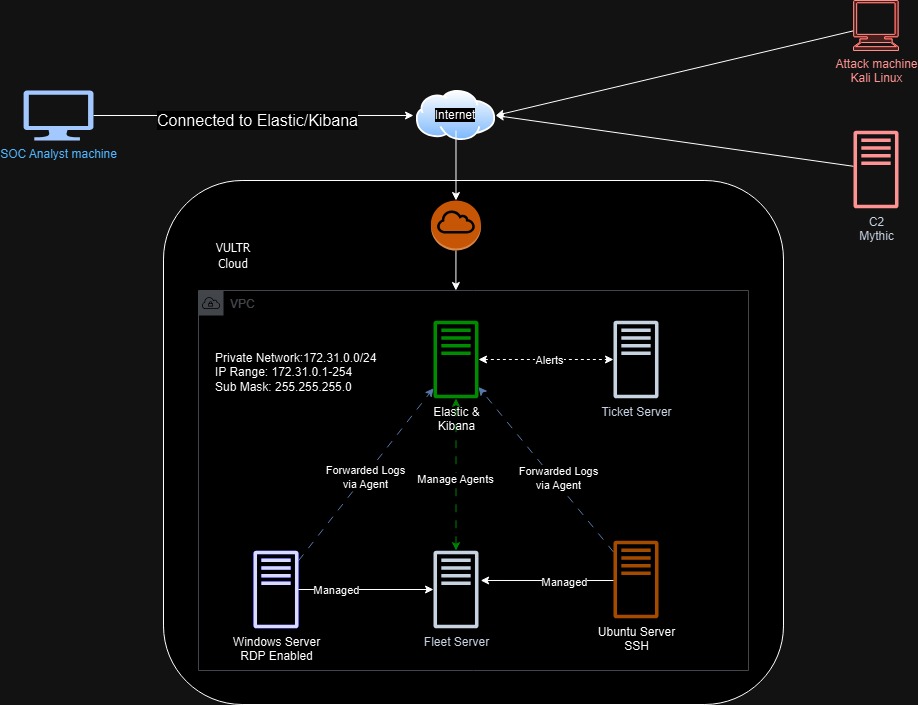
We will be using draw.io to create out logical diagram, it is pretty easy to search for images, drag-and-drop them and create connections between them.
I have also added text boxes to indicate purpose of each server and what data will be shared between them.
For this challenge, we will be using the following resources.
Elastic and Kibana
Fleet Server
Windows Server with RDP enabled (RDP attacks are cool, I mean dangerous)
Ubuntu Server with SSH enabled (OpenSSH is originally from OpenBSD)
OS Tickets server
C2 using Mythic (I am trying to learn how C2 works using Cobalt Strike with a Book)
We are building 6 servers using VULTR as cloud provider, $300 free credit, so why not? (Sorry Azure, you've been a good partner for almost a year). These 6 servers are in a VPC in VULTR Cloud (Not sure if I should call it VULTR or VULTR Cloud).
Now, let's see why we use each of these servers.
Elastic and Kibana
Elasticsearch is a search engine, It is one of the most popular database systems.
Kibana is an open-source data visualization and exploration tool used for log and time-series analytics.
Using these two, we are trying to setup a SIEM (Security Information and Event Management) tool, which helps us to analyze logs and events on the Windows and Ubuntu machines based on this challenge.
Fleet Server
Fleet is a component of Elastic that connects Elastic Agents to Fleet. According to Elastic docs, Elastic Agent is a single, unified way to add monitoring for logs, metrics, and other types of data to a host.
So, using Elastic agents with Fleet, we are sending the logs from the sources to Elastic and Kibana, which further provides us an interface and tools to search, visualize and analyze the log data.
Windows Server with RDP enabled
Windows server is being used to collect logs from a windows based machine. Usually RDP attacks are one of the most common attacks seen on windows based machines and it is interesting to analyze the logs from it.
PS: When I was learning and messing around Azure, I found this interesting video from Josh Madakor, where he sets up and uses Azure Sentinel and RDP attack logs to showcase check the source geographic info and point them in a World Heatmap.
Ubuntu Server with SSH enabled
This ubuntu machine is used to analyze logs obtained from a Linux machine. We can ssh into this machine, install new packages or tools, remove any packages, run scripts and create multiple process. All these will be logged, and we can analyze the same in Elastic.
osTicket Server
osTicket is a popular open-source web-based ticketing application, we are using this to create and manage the alert using a ticketing system. Usually in organizations regardless of the size, there will be some way of managing alerts and incidents, usually using some sort of ticketing software (Ex: Jira, Azure Boards)
C2 using Mythic
C2 is short form of Command-and-Control server, this is usually used by attackers to communicate with infected hosts, exfiltrate data or perform other malicious actions from the infected hosts. Learn more about C2 here.
Mythic is a multiplayer, command and control platform for red teaming operations. It is designed to facilitate a plug-n-play architecture.
Conclusion
After setting up each of the server and adding their information, we create the connections between them. The following points are to be noted.
Elastic and Kibana server manage Elastic Agents via Fleet server.
Fleet is used to manage both Windows and Ubuntu server, through them the logs are forwarded to Elastic and Kibana server.
Elastic and Kibana server manage alerts and generates tickets by communicating with osTicket server.
Through an internet gateway, the VPC in VULTR cloud communicates to the internet.
SOC Analyst machine (through Elastic Web GUI), Attacker machine and C2 server are communicating to these servers via Internet.
Based on the video here, we have successfully created a logical diagram using draw.io

Subscribe to my newsletter
Read articles from Tarun Sai directly inside your inbox. Subscribe to the newsletter, and don't miss out.
Written by

Tarun Sai
Tarun Sai
Hi, I'm Tarun, Cybersecurity Analyst | Grad Student in Cybersecurity Operations at UAlbany. I post content on Linux, Network Security, Web Application Security.