Observability simplified : A First Timer’s Guide to System Health
 Metta Surendhar
Hey folks!
Ever wondered how tech giants keep their systems running smoothly even when handling millions of users? Or maybe you're curious about how you can ensure your own projects are rock solid? The answer lies in a little magic called Observability—and today, we’re going to dive right into it!
What’s the Buzz About Observability?
Imagine you’re debugging your code without any tools—no console logs, no debuggers, nothing but the code itself. Frustrating, right? Now, scale that up to managing an entire application or a complex system. That’s where observability comes in—it’s like having a comprehensive debugger for your entire system.
Observability allows you to understand what's happening inside your applications by analyzing the data they generate. With observability, you can identify and resolve issues before they escalate, optimize performance, and ensure everything runs smoothly.
Observability vs. Monitoring: What’s the Difference?
You might think, “Isn’t observability just a fancy term for monitoring?” Not quite. While both are critical for system reliability, they serve different purposes:
Monitoring is like setting up health checks on your system. It watches specific metrics or logs and alerts you when something goes wrong, like high CPU usage or a failed API request.
Observability goes beyond that—it’s about understanding why things are happening. Think of it like having the ability to step through the running code of your system in real-time, understanding each decision and interaction. It’s not just knowing something went wrong but also how and why it happened.
In essence, monitoring tells you when there's an issue, while observability helps you understand the root cause.
The Three Pillars of Observability

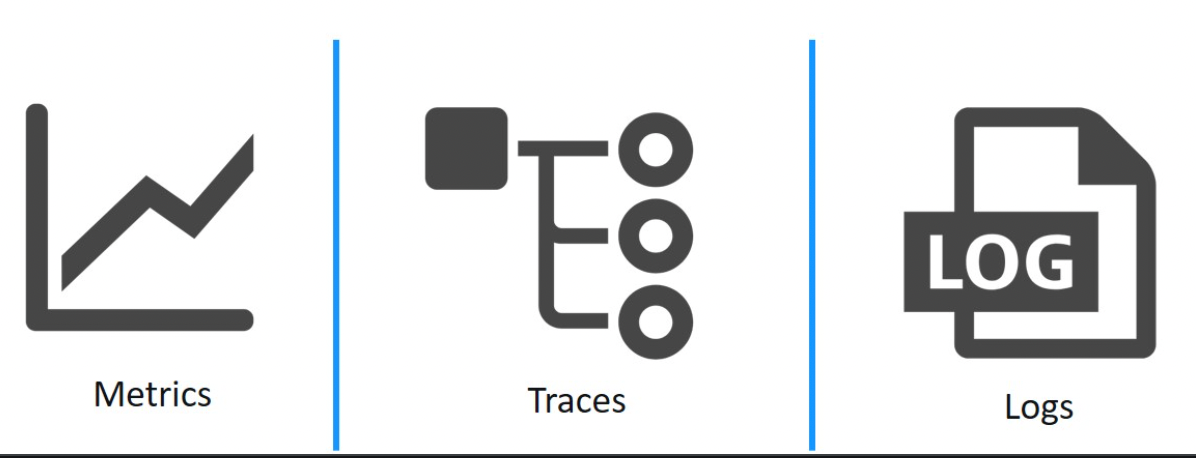
Observability works by collecting and analyzing the three types of telemetry data—logs, metrics, and traces. To fully understand observability, it’s essential to grasp the three main types of telemetry data:
Logs :
Logs are the detailed records of what’s happening inside your system. They capture events, errors, and other critical information.
For developers, logs are like the print statements in your code—they help you trace the flow of execution and understand what happened when an issue occurred.
It help you understand what actions were taken at specific times. They’re invaluable for troubleshooting specific issues, like why a server crashed or why a user experienced an error.
Metrics :
Metrics are numerical data that represent the performance and health of your system. They include things like CPU usage, memory consumption, request latency, and error rates.
It give you a quick snapshot of your system’s overall state. Think of them as the performance stats of your application, similar to how you’d monitor frame rates in a video game to ensure smooth performance.
They’re crucial for setting up alerts that notify you when something goes wrong, like a sudden spike in latency or a drop in request rates.
Traces :
Traces follow the path of a request as it moves through various services in your system. They help you visualize how different parts of your application interact and where bottlenecks or errors might occur.
They are like following a breadcrumb trail through your code, seeing exactly where each function call leads and how it impacts the system.
This is especially important in microservices architectures, where understanding the interaction between services is key to diagnosing performance issues.
By combining these data types, observability tools can offer a holistic view of your system’s health and behavior, allowing you to identify and fix problems faster.
Why Should You Care About Observability?

So, why all the fuss about observability? Here’s why it matters:
Proactive Problem-Solving:
Observability lets you catch issues before your users do.
Instead of waiting for an error report, you can detect and resolve problems early, ensuring a smoother user experience and less downtime.
Optimized Performance:
By keeping an eye on metrics and traces, you can identify inefficiencies and optimize your system to run faster and more efficiently.
This is crucial whether you're running a small application or a large-scale distributed system.
Enhanced Collaboration:
Observability data acts as a common language for your team.
Developers, DevOps engineers, and SREs can all work from the same data, making it easier to collaborate on solving problems and improving the system.
Getting Started with Observability

Ready to bring observability into your projects? Here’s how to get started:
Choose Your Tools:
Tools like Grafana, Prometheus, and Loki are great for getting your observability stack up and running.
Each specializes in different aspects—metrics, logs, and traces—so you can tailor your setup to your needs.
Set Up Monitoring:
Start small by setting up monitoring for your most critical systems.
Track basic metrics like CPU, memory, and disk usage to understand your system’s normal behavior.
Implement Alerts:
Alerts are your early warning system.
Set up thresholds for your metrics so you’ll be notified the moment something goes off the rails.
Explore and Experiment:
Observability is a vast field, and there’s always more to learn.
Experiment with different tools and techniques to find what works best for your systems.
My Journey into Observability

In my work, I had the opportunity to explore and implement observability using various tools. I extracted metrics from Windows and Linux logs through the Cribl TCP source, processed them in Cribl Stream, and then used Prometheus to store and visualize the data on Grafana dashboard panels.
I also set up alerts for key metrics like CPU, disk, and memory using Grafana Alertmanager and Mimir, ensuring that any critical issues were immediately flagged. Additionally, I utilized silences in Grafana to manage and suppress alerts during maintenance windows or non-critical periods.
Why You Should Start Today
Whether you’re managing a large-scale system or just starting out with a small project, observability is key to ensuring reliability and performance. It’s like having superpowers for your code—powers that let you see inside your systems and make sure everything’s running just the way it should.
Stay Tuned for More!
I’m excited to share more about observability in my upcoming posts, where we’ll dive deeper into specific tools and techniques. Whether you’re a beginner or a seasoned pro, there’s always more to learn, so stay tuned!
Subscribe to my newsletter
Read articles from Metta Surendhar directly inside your inbox. Subscribe to the newsletter, and don't miss out.
Written by

Metta Surendhar
Metta Surendhar
Interned as a Platform Engineer specializing in Observability and Gen AI, passionate about open-source contributions and real-world solutions. Currently pursuing an MSc in Integrated IT at CEG (2024-26), SAASCEG'24, CTF'24. I'm exploring LLMs, Haystack, Retrieval-Augmented Generation (RAG), and Gen AI, focusing on building conversational AI bots. Diving into new tools to enhance chatbot performance and interaction quality!