Other Visualization Tools: Streamlit
 ALBERT KENYI APAZA CCALLE
Introduction
In the realm of data visualization, Streamlit has emerged as a powerful and user-friendly tool for creating interactive web applications. Designed to facilitate rapid prototyping and deployment of data-centric applications, Streamlit simplifies the process of building and sharing interactive dashboards. This article will guide you through the essentials of Streamlit, including installation, configuration, and basic usage.
Streamlit
Streamlit is an open-source framework for building data applications in Python. It is widely appreciated for its ease of use and efficiency, allowing users to turn data scripts into shareable web apps with minimal effort. The key features of Streamlit include:
Simplicity: Write Python scripts that are directly converted into interactive web applications.
Flexibility: Easily integrate with popular data libraries like Pandas, NumPy, and Matplotlib.
Interactivity: Build interactive widgets such as sliders, buttons, and charts to explore data dynamically.
Requirements
To get started with Streamlit, you'll need to fulfill the following requirements:
1. Install Python
Streamlit runs on Python, so you'll need to have Python installed on your system. You can download the latest version of Python from the official Python website. Follow the installation instructions appropriate for your operating system.
2. Add Python Script Path
After installing Python, it's essential to ensure that the Python script path is added to your system's PATH environment variable. This allows you to run Python commands from the command line.
For Windows:
Find the Python Installation Path: This is typically located in
C:\Users\<YourUsername>\AppData\Local\Programs\Python\PythonXX, whereXXis the version number.Add Python to PATH:
Right-click on
This PCorComputeron your desktop and selectProperties.Click on
Advanced system settingsand then on theEnvironment Variablesbutton.In the
System variablessection, find thePathvariable, select it, and clickEdit.Add the Python installation path and the
Scriptssubfolder path (e.g.,C:\Users\<YourUsername>\AppData\Local\Programs\Python\PythonXX\Scripts) to the list of paths.
Verify Installation: Open Command Prompt and run
python --versionandpip --versionto ensure Python and Pip are correctly set up.
3. Install Streamlit
Once Python is installed and configured, you can install Streamlit using Pip. Open Command Prompt (or Terminal on macOS/Linux) and execute the following command:
pip install streamlit
Getting Started with Streamlit
With Streamlit installed, you can start building your first web application. Here’s a basic example:
Create a Python Script: Create a new Python file, for example,
app.py.Write Your Streamlit Code:
import streamlit as st
import pandas as pd
import numpy as np

# Title of the application
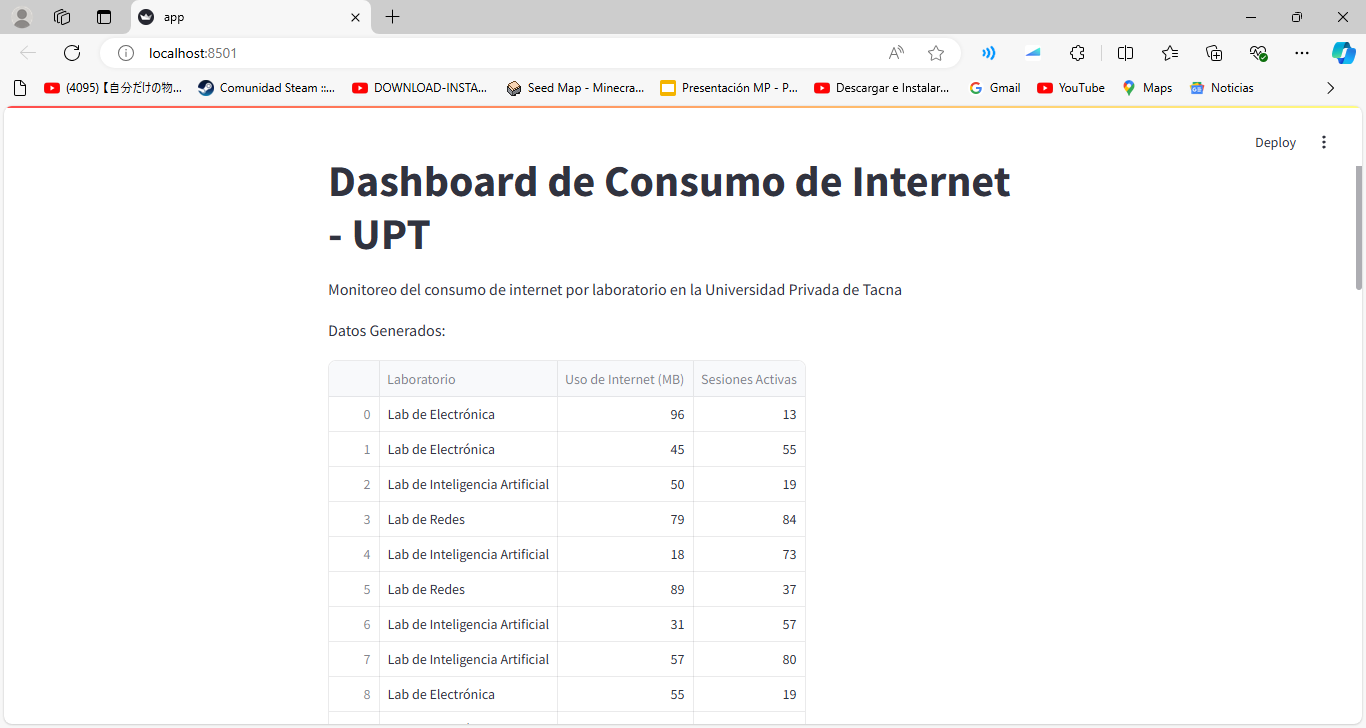
st.title('Dashboard de Consumo de Internet - UPT')

# Subtitle
st.write("Monitoreo del consumo de internet por laboratorio
             en la Universidad Privada de Tacna")

# Generate example data for internet consumption
data = pd.DataFrame(
    # Generate random data between 10 and 100
    np.random.randint(10, 100, size=(100, 3)),
    columns=['Laboratorio', 'Uso de Internet (MB)', 'Sesiones Activas']
)

# Add creative names for laboratories
laboratorios = ['Lab de Redes', 'Lab de Software', 'Lab de Electrónica',
                                        'Lab de Inteligencia Artificial']
data['Laboratorio'] = np.random.choice(laboratorios, size=100)

# Display the complete data table
st.write("Datos Generados:")
st.dataframe(data)

# Add a slider to filter data by internet usage
valor_seleccionado = st.slider('Selecciona el uso mínimo de internet (MB)
                                               para filtrar:', 10, 100, 50)
st.write(f'Uso mínimo de internet seleccionado: {valor_seleccionado} MB')

# Filter the data based on the selected value
data_filtrada = data[data['Uso de Internet (MB)'] >= valor_seleccionado]

# Display the filtered data table
st.write("Datos Filtrados por Consumo de Internet:")
st.dataframe(data_filtrada)

# Create a line chart with filtered data
st.line_chart(data_filtrada.set_index('Laboratorio'))

# Create a bar chart with filtered data
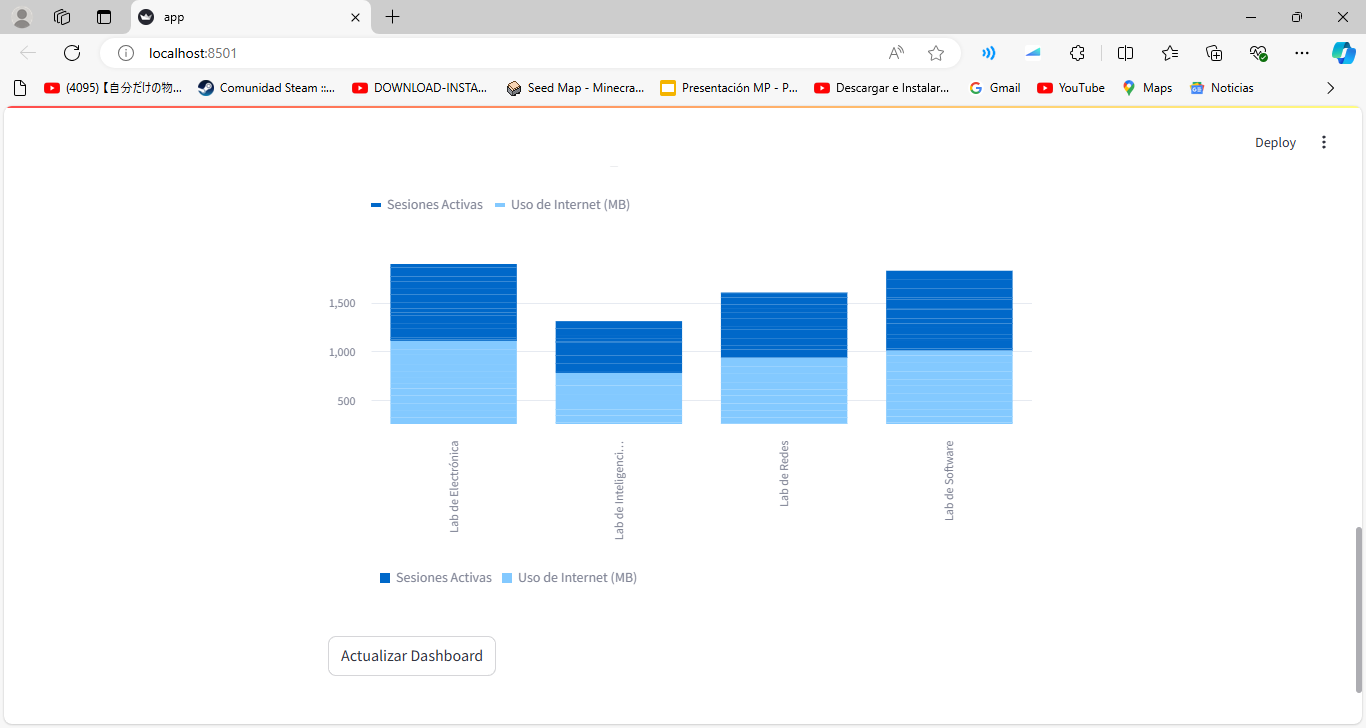
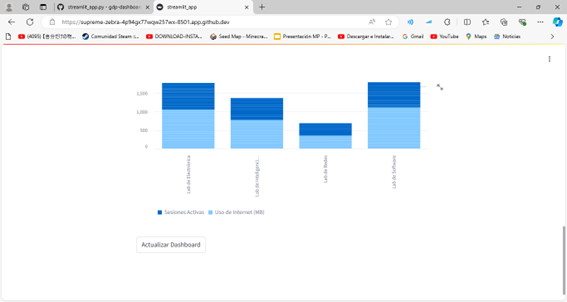
st.bar_chart(data_filtrada.set_index('Laboratorio'))

# Add a button
if st.button('Actualizar Dashboard'):
    st.write('¡Datos actualizados!')
- Run Your Streamlit App:
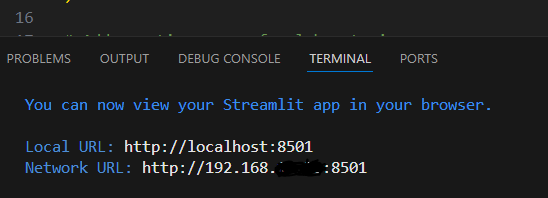
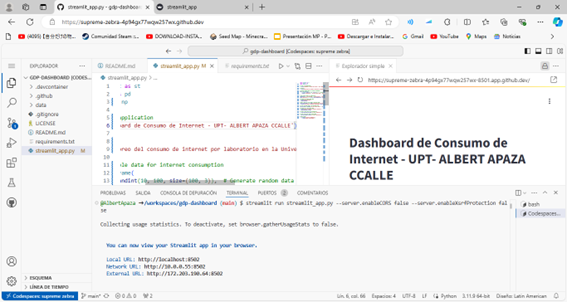
In Command Prompt (or Terminal), navigate to the directory containing your app.py file and run:
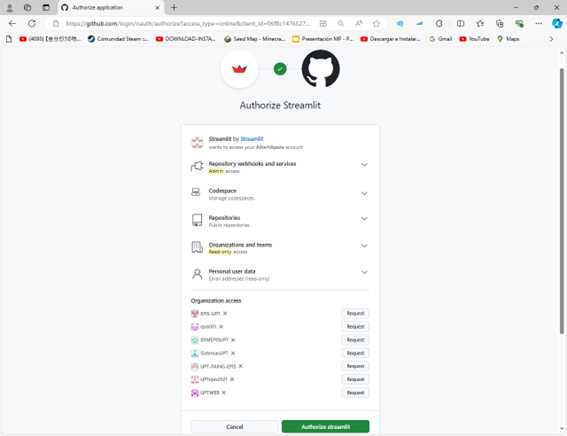
Deployed cloud service
DEMO DASHBOARD
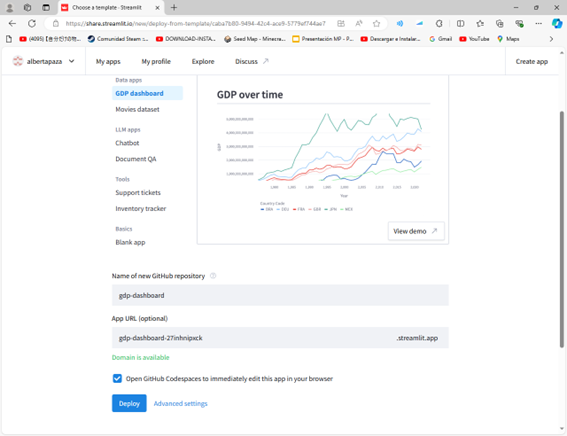
SUPREME ZEBRA CODE DASHBOARD
DEPLOYED
Conclusion
Streamlit is a powerful and user-friendly tool for creating interactive data visualizations quickly and efficiently. It simplifies the process of converting Python scripts into dynamic dashboards, making it ideal for data scientists and analysts. With its integration capabilities and straightforward syntax, Streamlit enables you to present complex data in an accessible and engaging way.
Subscribe to my newsletter
Read articles from ALBERT KENYI APAZA CCALLE directly inside your inbox. Subscribe to the newsletter, and don't miss out.
Written by
