Data Cleaning in Pandas: Handling Missing Categorical Data
 Ojo Timilehin
Table of contents
Introduction
Data cleaning is one of the most crucial aspects of the Machine learning lifecycle. It involves fixing erroneous, corrupted, duplicate, or incomplete data. It has been said that data scientists spend about 50%- 70% of their total project time cleaning the data before analysis or machine learning modeling.
This is because the data you acquire for your analysis project could be better as it contains errors such as duplicates, missing values, inconsistent format, outliers, inconsistent units of measurement, etc.
Missing data is one of the issues that plague raw data, if not addressed, it can skew data analysis results. Handling the missing data will improve the quality of the data, ensuring accurate and reliable results from the analysis or modeling.

In this article, you will learn how to handle missing data related to categorical variables under the following headings.
Table of Contents
Data cleaning
What are missing data?
Types of missing data
Why you should handle missing data
How missing data are represented
Pandas function to identify missing data
Handling Missing Categorical data
Mode
Drop
Unknown
Classification prediction
Machine learning Algorithm that supports missing data
Conclusion
What are missing data?
Missing data is when values or data points are missing from a dataset where information is expected. Data may be missing due to various reasons such as:
Software errors or equipment failure during data collection,
Lost data due to storage issues or mishandling
Participants failed to answer certain questions in questionnaire surveys or forms, etc.
Types of Missing Data
There are three (3) categories of missing data based on the relationship between the missing data and observed data:
1. Missing Completely at Random (MCAR)
When data is MCAR, it shows there is no relationship between the missing data and the observed data. The missing data does not follow a specific pattern or distribution.
Simply put, in MCAR, the probability of a data point being missing is:
Independent of the observed data
Independent of the missing data
Random and unpredictable.
Examples include:
- Missing data due to a system or equipment failure
A participant randomly forgets to answer a question in a questionnaire.
2. Missing at Random (MAR)
When data is MAR, there is a relationship between the missing data and observed data. This means that the reason for a data point MAR can be explained by the observed data in other variables.
In MAR, the probability of a data point being missing is:
Related to observed data
Independent of the missing data
Predictable by the observed data
Examples include:
- Customers who are more dissatisfied with a product are less likely to leave feedback.
Single females are less likely to report their age compared to married or partnered females.
3. Missing Not At Random (MNAR)
The missing data might be classified as MNAR if it does not fit into the MCAR or MAR categories. When a data point is MNAR, it means the missing data is related to itself. The reason for its missingness can be explained by the value itself.
Simply put, in MNAR, the probability of a data point being missing is:
Dependent on the missing data
Not dependent on the observed data
Not random
Examples include:
- Respondents with extreme views are more likely to refuse to answer certain questions.
Understanding the type of missing data will help your approach to handling it during analysis.
Why you should handle missing data
Missing data may lead to biased, inaccurate, and misleading results in the Exploratory Data Analysis
Handling missing data maximizes the use of the available data for analysis and predictive modeling.
Quality data ensures the reproducibility of the analysis
Most ML algorithms fail during modeling in the presence of missing data
How missing data are represented
In a Pandas DataFrame, depending on the data type and source of collection, missing data can be represented in a variety of ways.
1. NaN (Not a Number)
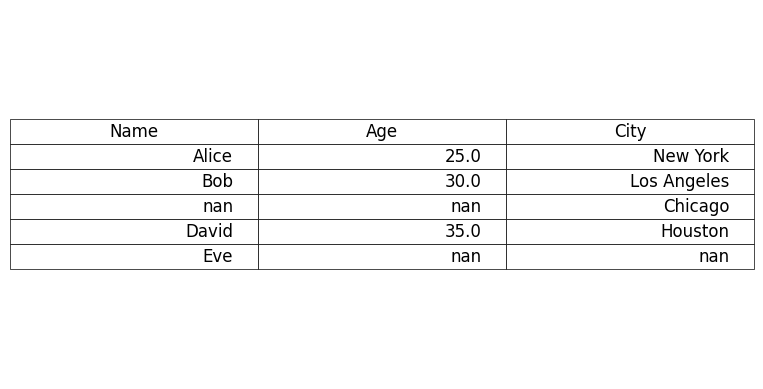
Especially for a numeric data type, NaN is the most common way missing data are represented.

Fig 1: Missing data represented with NaNs
2. None
A Python object that is often used for missing data, especially for string or mixed data types.
3. Placeholders ('-', '?', 'missing')
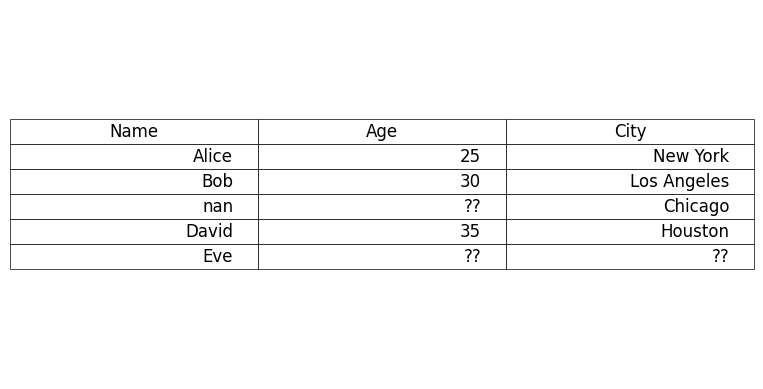
Missing values, sometimes, can be represented by a placeholder string or character. These placeholders might not be detected by Pandas isnull() methods.

Fig 2: Missing data represented with '??' placeholder
4. Empty Strings ('')
For string columns, missing data can be represented with empty strings.
Note: Every other representation of missing data aside from NaN and None must be manually converted to NaN for it to be detected and analyzed by Pandas’ methods and function.
Pandas Methods to Detect Missing Data in a DataFrame
The Pandas library provides several methods for detecting missing values in a dataframe which can be used alone or combined with other methods.
1. isnull() / isna()
# Detecting missing values
df.isnull()
df.isna()
isnull() or isna() returns a DataFrame with a True for missing data or False if otherwise for each cell
2. notnull() / notna()
# detecting missing values
df.notnull()
df.notna()
notnull() / notna() functions opposite the aforementioned methods. They return a DataFrame with ‘True’ for cells that are observed and ‘False’ for cells that are missing.
3. isnull().sum()
# count null values in each column or row
df.isnull().sum(axis = 0) # column
df.isnull().sum(axis = 1) # row
isnull() and sum() are combined to count the number of null values in each row or column and get the sum.
4. isna().values().any()
df.isna().values().any()
isna().values().any() check if there are any missing data anywhere in the DataFrame
5. info()
# quick summary of the DataFrame
df.info()
info() returns three columns of ‘Column Names’, ‘Not-Null Count’, and ‘Data Type’. It gives the count of non-null values for each column.
You can run the code below to detect missing data that are represented with custom placeholders
# list of possible placeholders
placeholders = ('-999', '-', '?', 'missing')
# detect placeholders in the DataFrame
mask = df.isin(placeholders)
# display rows containing placeholders
rows_with_placeholders = df[mask.any(axis = 1)]
print(rows_with_placeholders)
Handling Missing Categorical data
Several techniques can be used to handle missing categorical data during data cleaning. We will examine a few of them in this section with their usage in Python.
For practical illustration, we will be using the Adult Income dataset available on Kaggle or through fetchopenml in sklearn.datasets
from sklearn.datasets import fetch_openml
# Fetch the Adult Income Dataset
adult_data = fetch_openml(name = 'adult', version = 2, as_frame = True)
# Extract the dataset and target
df = adult_data.frame # Display the first 5 rows df.head()
fetch_openml from sklearn.datasets fetches the Adult Income Dataset from OpenML. The as_frame=True arguments return the data as a Pandas DataFrame.
Check for Missing Data
# count the missing data
df.isnull().sum()
This counts the missing data in the DataFrame and returns the column’s names and the corresponding sum of missing data. The workclass, occupation, and native-country have 2799, 2809, and 857 total missing data respectively.
1. Mode
/This technique replaces the missing data with the most occurring class of the categorical variable. This technique can be tricky because it can skew the class distributions if there are a huge number of missing values in the dataset.
# imputation by mode technique
mode_technique = df.fillna(df.mode().iloc[0])
This code takes the most occurring class of each column and fills the missing data with it.
2. Drop
This is a quick and basic technique. It involves deleting the rows from the dataset with missing data. Dropping missing data can also be done along the y-axis (column-wise). This will mean removing an entire column (feature). This is only appropriate if the column contains a large proportion (more than 70%) of missing data which may not impact the analysis.
However, dropping missing data can lead to the loss of important information in the dataset, and also reduce the number of observations and features available for analysis and modeling.
# dropping missing data
df_dropped_rows = df.dropna() # row wise
df_dropped_columns = df.dropna(axis = 1) # column wise
- dropna() removes all rows that contain at least one missing data dropna(axis = 1) removes all columns that contain at least one missing data.
3. Unknown
Another technique to handle missing categorical data is to replace them with the label ‘Unknown’. It treats the missing data as a separate category.
Instead of dropping missing data which can lead to loss of information or replacing them with the most frequent class, which can lead to skewness and bias, replacing missing data with ‘Unknown’ helps retain all original data points.
It maintains data integrity and also avoids making assumptions about the missing data.
# Add "Unknown" to the categories of each categorical column
for col in df.select_dtypes(include = ['category']):
    df[col] = df[col].cat.add_categories("Unknown")

# Fill the missing data with "Unknown"
Unknown_technique = df.fillna("Unknown")
This creates a valid “Unknown” category in the categorical columns, and then replaces any categorical missing data with “Unknown”.
4. Multiple Imputation by Chained Equation (MICE)
This is an advanced technique for dealing with missing data. It is a statistical technique that handles missing data by prediction using an ML algorithm. Each feature with missing data in the dataset is modeled as a function of other features with observed data in the dataset, i.e. each feature with missing data is set as the target, and the other features with observed data are used as predictors in imputing the missing data.
This process is repeated iteratively for each feature with missing data until the imputation is complete.
MICE can be implemented in Python using the IterativeImputer from the sklearn library.
import pandas as pd
import numpy as np
# To enable IterativeImputer
from sklearn.experimental import enable_iterative_imputer
from sklearn.impute import IterativeImputer
- Import Pandas, Numpy, and Sklearn library needed for the implementation
# Convert categorical variables to numerical codes for MICE
categorical_cols = df.select_dtypes(include=['category']).columns
df_encoded = df.copy()

# Convert categorical columns to category codes
for col in categorical_cols:
    df_encoded[col] = df_encoded[col].astype('category').cat.codes
- Convert categorical variables into numerical codes, since IterativeImputer works on numerical data
# Initialize MICE
Imputerimputer = IterativeImputer(random_state=42, max_iter=10)
# Apply MICE Imputer to the DataFrame
df_imputed = pd.DataFrame(imputer.fit_transform(df_encoded), columns=df.columns)
- Instantiate an IterativeImputer object, and apply the fit_transform method on the dataset. It imputes the missing data
# Convert the imputed numerical columns back to the original categorical form
for col in categorical_cols:
    df_imputed[col] = pd.cut(df_imputed[col],
    bins=len(df[col].astype('category').cat.categories),
    labels=df[col].astype('category').cat.categories)
- Convert the numerical codes back to the original categorical labels after imputation.
# Check for missing values after imputation
print("\nMissing values after:")
print(df_imputed.isnull().sum())

# Display a snippet of the imputed DataFrame
print("\nImputed DataFrame (first 5 rows):")
print(df_imputed.head())
- Verify the missing data has been imputed.
5. Machine Learning Algorithm that supports missing data
Some Machine Learning Algorithms internally handle missing data without external imputation. These ML algorithms include
Decision Tree
Random Forest
Extreme Gradient Boosting
LightGBM
CatBoost
Naives Bayes Classifier
These ML algorithms are robust to missing data and can be used when data completeness is an issue.
Conclusion
Data cleaning is an essential aspect of the data analysis/science pipeline which can make or mar the results for data-driven decision making. There are various techniques to handle missing categorical data which is informed by the type of the missing data.
In handling missing data, there is no one-size-fits-all approach, therefore each technique must be used as the problem data demands to ensure accurate and reliable results.
Subscribe to my newsletter
Read articles from Ojo Timilehin directly inside your inbox. Subscribe to the newsletter, and don't miss out.
Written by

Ojo Timilehin
Ojo Timilehin
I am a data scientist who loves building AI products that drive business success and productivity. I am currently on the lookout for internship opportunities. I am ready for collaboration anytime.