Step By Step Guide to Deploying Elastic and Kibana on VULTR Clou
 Tarun Sai
For day 2 we focused on understanding the benefits of using ELK stack.
Elasticsearch is a database primarily used to store various types of logs, enabling users to search through the data. It utilizes a query language called ESQL and employs RESTful APIs and JSON for interaction and data retrieval.
Logstash acts as a pipeline, collecting telemetry data from sources like Beats or Elastic Agent. It then processes, filters, and transfers this data into Elasticsearch. Logstash allows for customization by filtering logs based on specific criteria and parsing fields within logs to extract and map values to field names.
Kibana provides a web console to interact with logs stored in Elasticsearch. It offers features like Kibana Lens for visualizations, a Discover tab for querying logs using ESQL, machine learning capabilities for anomaly detection, Elastic Maps for geospatial data, and more.
Day 3: Deploying instances in VULTR Cloud
I must say after using Azure for almost a year, I was expecting a little trouble finding the options in the new VULTR cloud, but to my surprise, the UI of VULTR cloud is really good, it is clean and intuitive. The minimalistic approach, with the use of just three colors, really enhances the clarity of the application flow.
VPC Setup
It is important for us to consider the VPC network to be in same network region as our virtual machines should be. For me I live in New York, so I chose New Jersey region, and gave the network address as mentioned in logical diagram in Day 1.
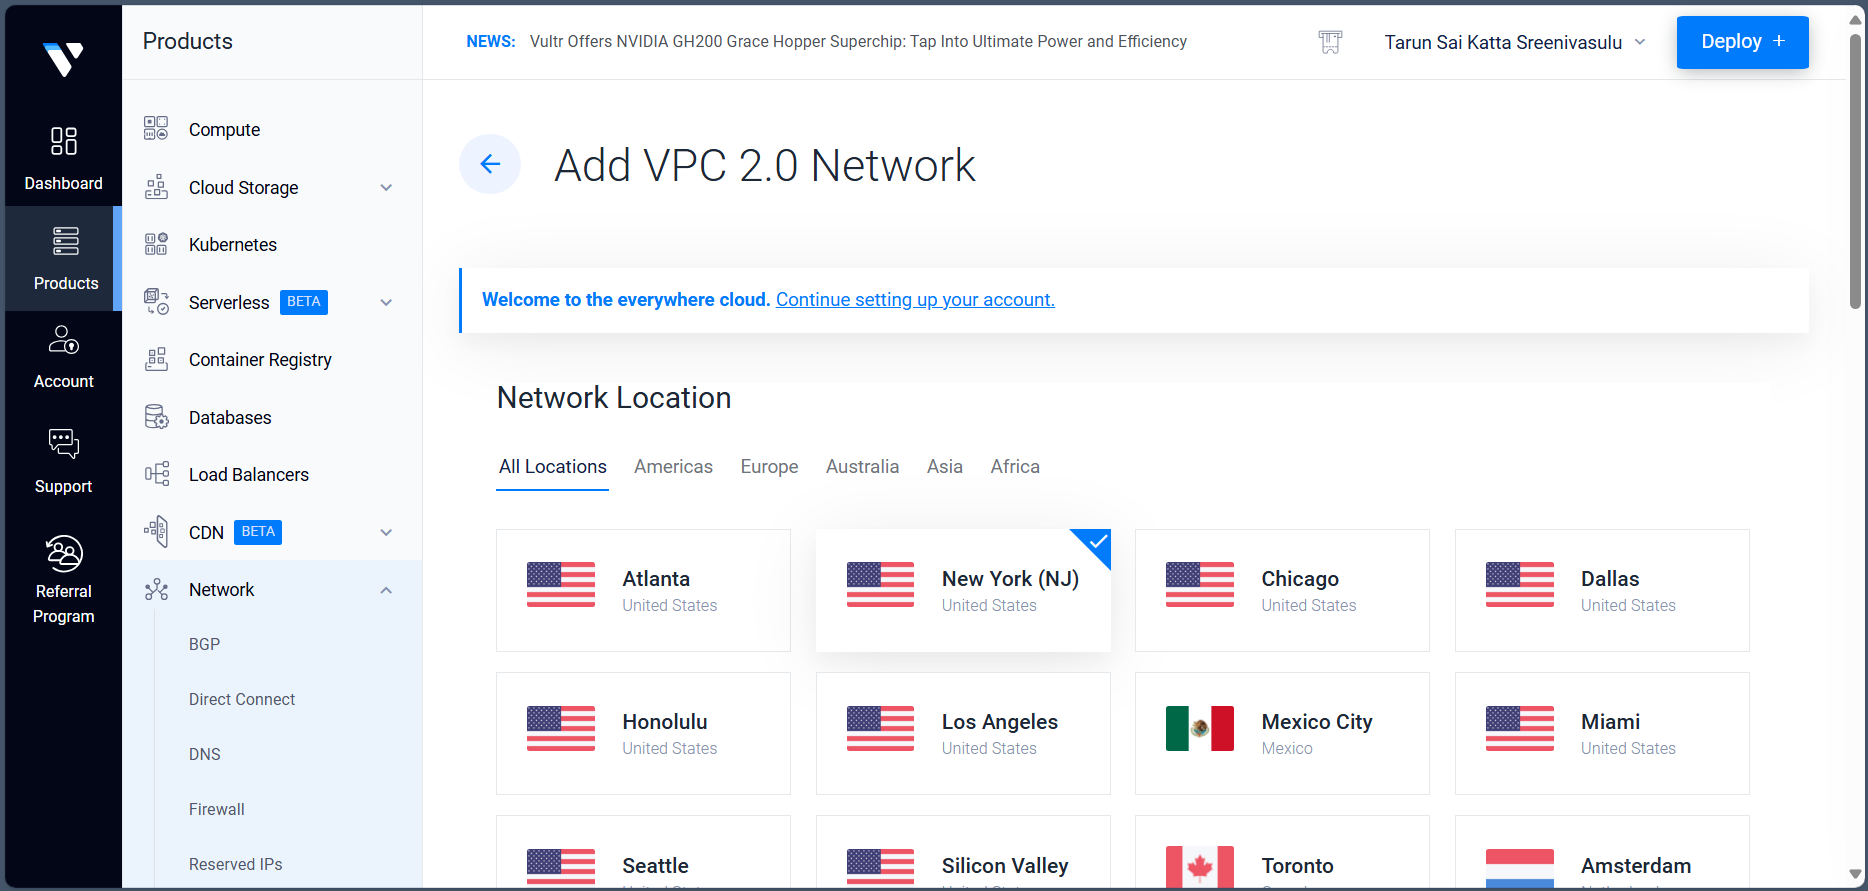

Creating instance for Elasticsearch
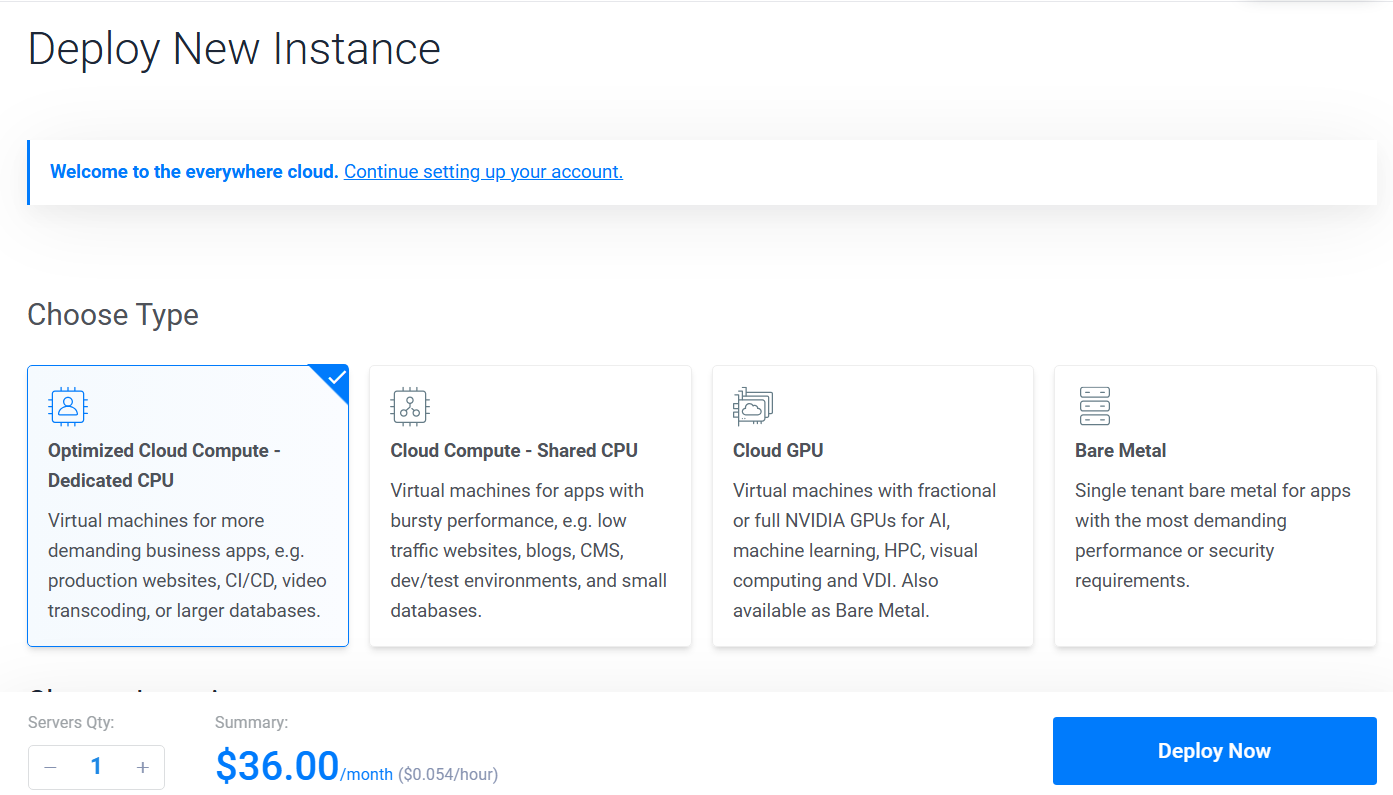
Now, I must say, that Deploy button in VULTR has been whispering me to create an instance, so here I am selecting an Ubuntu 22.04 LTS instance with 4 CPU's, 16 GB memory and 80 GB NVMe with 6 TB bandwidth. Thanks to those $300 credits, I am unstoppable now.
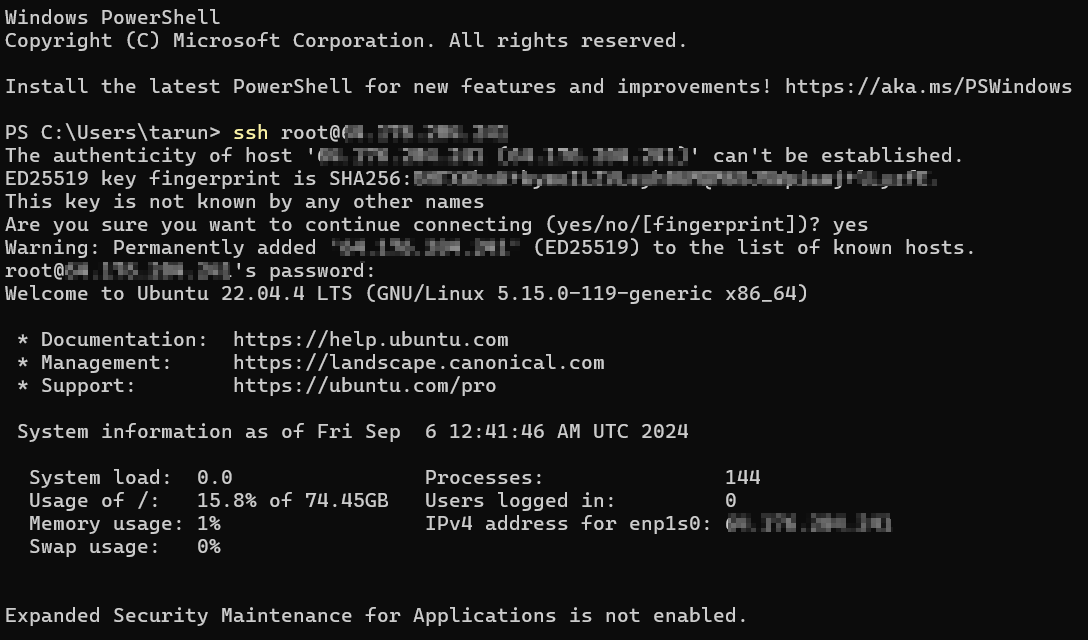
After deploying, the instance overview tab has credentials for initial login, using that I SSH into my instance through my Windows Terminal app. I personally like the terminal app with my font and size.

Installing Elasticsearch
I had previously worked on my personal project where I tried setting up ELK stack in my home-lab using VirtualBox. In case if you are worried about the cost with cloud, you can just deploy the elastic in cloud and manage the other servers in your personal device, just make sure you've configured the network properly to maintain secure communication.
Now that we have logged into our instance, like every sane IT person, the first thing I am going to do is update and upgrade my packages.
sudo apt update && upgrade -y
After upgrading all the packages, let us now install Elasticsearch. Fire up your browser of choice on your personal host machine, search for "Download Elasticsearch". You will land here.
Now select the configuration of your host machine, for me it is amd64 bit architecture. copy the link of the download button and wget the file.

Now, install elasticsearch using dpkg, hit tab to autocomplete the filename.
dpkg -i elasticsearch-8.15.1-amd64.deb
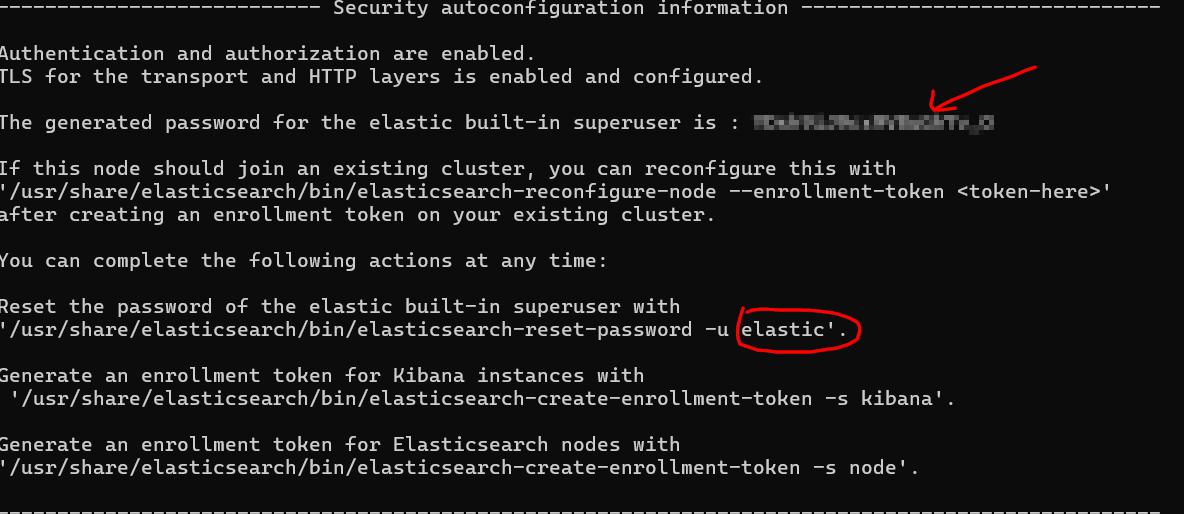
Watch out for the auto generated password for the elastic user. Yes, during installation, it creates a default user by name "elastic". If you forgot to copy it, you could reset passwords using the binary in elasticsearch bin directory as shown in screenshot below.
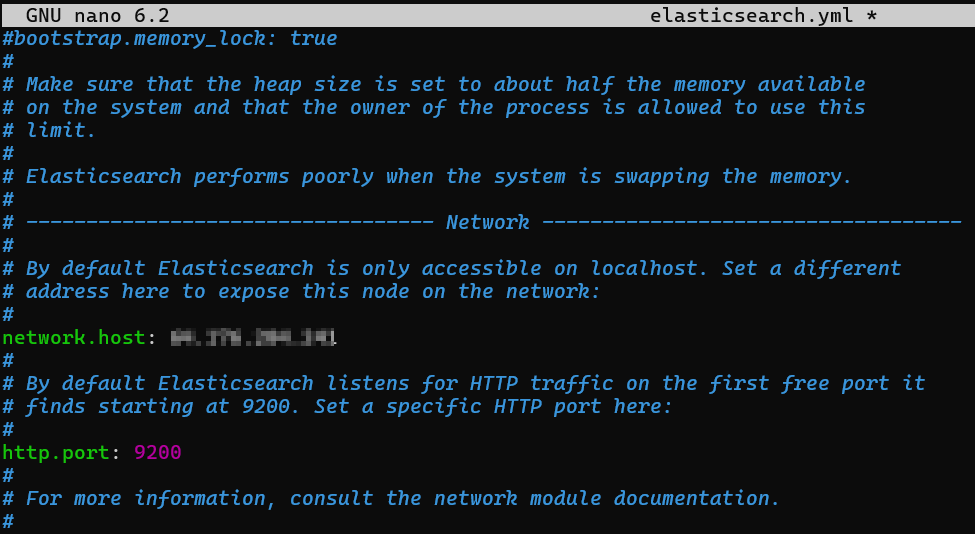
Now, head over to /etc/elasticsearch/ and open elasticsearch.yml file using your favorite text editor, just make sure you know how to exit it.
In order to access elasticsearch, I have entered by Public IP address and removed comments. I know you're worried about others accessing this instance, Got you covered with a Firewall.
Go to the instance Settings-> Firewall -> Manage.
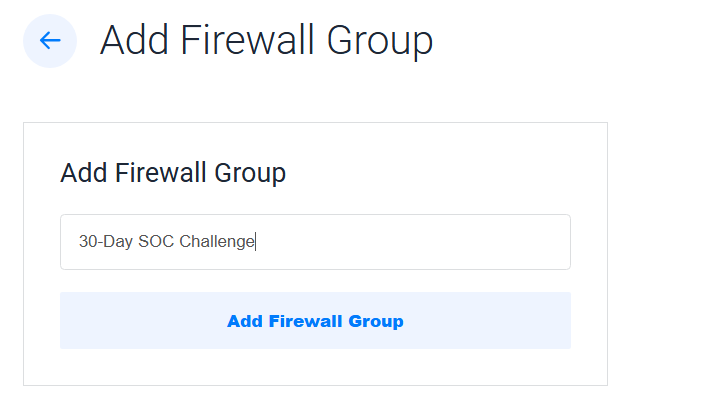
Add Firewall group and give it a name of your choice.
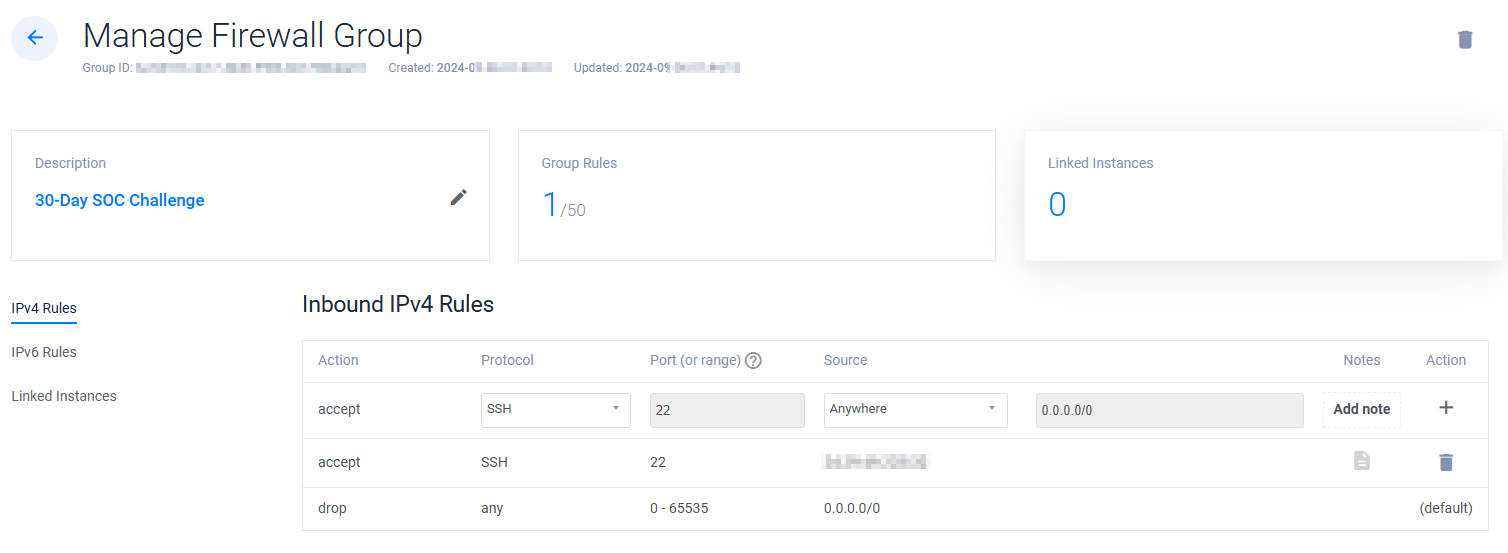
Here, I have added my windows host network address to the sources to maintain SSH access into the machine.
Finally, we enable and start elasticsearch using systemctl.
systemctl daemon-reload
systemctl enable elasticsearch.service
systemctl start elasticsearch.service
Give it a minute to start the service, you can always check the status to ensure it is active or not using
systemctl status elasticsearch.service

Perfectly active and running without any challenges.
Day 4 - Installing Kibana
Just like how we copied the elasticsearch download URL, copy the URL for Kibana after selecting your architecture. You can download Kibana here.
wget https://artifacts.elastic.co/downloads/kibana/kibana-8.15.1-amd64.deb

Now, using dpkg, we can install kibana.
dpkg -i kibana-8.15.1-amd64.deb

We need to make some changes to configuration file similar to elasticsearch.
Go to /etc/kibana/kibana.yml. Kibana runs on the default port of 5601, just remove the comment ('#') before server.port:5601
Also, the server.host has localhost as its default value, change it to your public IP of Ubuntu instance.
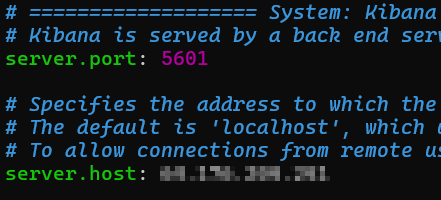
Now, exit and save the changes. To enable and start kibana service, let us use systemctl.
systemctl daemon-reload
systemctl enable kibana.service
systemctl start kibana.service
To check the status of kibana service, let us use
systemctl status kibana.service

Perfectly active and running. Before using Kibana, we need to generate an Elasticsearch enrollment token to use Kibana.
Go to /usr/share/elasticsearch/bin/ and run ./elasticsearch-create-enrollment-token
./elasticsearch-create-enrollment-token --scope kibana
Copy the token for future use.
Now, when I try to access kibana dashboard through my browser in original host machine, I see the request timed out. This happens due to the VULTR firewall and Ubuntu default firewall blocking the traffic towards port 5601. To solve this, do the following
allow all TCP traffic from My IP in VULTR Firewall settings to all ports.
allow the incoming traffic on port 5601 (using ufw or iptables).
I used ufw and added rule using ufw allow 5601 and we are good to go.
Logging into Kibana in Browser
Using http on your public IP and port 5601, we can access Kibana Web GUI.
http://<public_IP>:5601
Using the default user - elastic and password created during the installation, we try to login and provide the enrollment token created by elasticsearch.
Now to our surprise we see it asks for verification code. Don't worry, it is not in your Authenticator app, but it within the ubuntu machine. Go to /usr/share/kibana/bin to see all the binaries installed by kibana. run the kibana-verification-code binary to get the verification code.

After successfully logging in, feel free to explore the Elastic and Kibana platform on your own.
Now, when I checked on Alerts, we see that an API integration is required. We have to add the xpack.encryptedSavedObjects.encryptionKey setting to kibana.yml file.

We can generate these encryption keys using the binaries in Kibana directory. Go to /usr/share/kibana/bin and run kibana-encryption-keys and copy the generated encryption keys.
Now using kibana-keystore, add each of the encryption keys using the following commands.

Now, we are all set with Elasticsearch and Kibana installation.
Thank you for reading all the way through the blog, if you have any queries add them in the comments.
Subscribe to my newsletter
Read articles from Tarun Sai directly inside your inbox. Subscribe to the newsletter, and don't miss out.
Written by

Tarun Sai
Tarun Sai
Hi, I'm Tarun, Cybersecurity Analyst | Grad Student in Cybersecurity Operations at UAlbany. I post content on Linux, Network Security, Web Application Security.