Introduction to CesiumJS: Bringing 3D Geospatial Data to the Web
 NITYOM TIKHE
In a world where location-based data is becoming increasingly critical, technologies like CesiumJS have emerged to revolutionize how we interact with maps, terrain, and 3D models on the web. Whether it's for urban planning, environmental modeling, or space exploration, CesiumJS is a powerful tool that allows developers to build dynamic, interactive 3D globes and map applications with high precision.
In this blog, we’ll explore what CesiumJS is, its features, use cases, and why it has become a go-to solution for developers working with 3D geospatial data.
What is CesiumJS?
CesiumJS is an open-source JavaScript library designed to create and visualize 3D globes, maps, and geospatial data in the browser. Originally developed by Analytical Graphics, Inc. (AGI), CesiumJS is now widely adopted in industries ranging from urban development to aerospace, providing real-time, accurate 3D rendering of terrain, buildings, and even space objects.
At its core, CesiumJS allows developers to create immersive 3D environments on the web, utilizing WebGL for hardware-accelerated graphics. It supports large datasets, enabling detailed and dynamic visualization of real-world geospatial data.
Key Features of CesiumJS
1. 3D Globes and Maps
CesiumJS allows developers to create highly interactive 3D globes that display terrain, imagery, and vector data. The globe can be rotated, zoomed, and tilted for a detailed examination of any part of the world.
2. Time-Dynamic Visualization
One of the standout features of CesiumJS is its ability to visualize data over time. For example, developers can animate satellite orbits or traffic patterns over days or years, providing a deeper understanding of how data changes dynamically.
3. Geospatial Data Support
CesiumJS supports multiple formats of geospatial data, including 3D tiles, KML, GeoJSON, and CZML (Cesium's custom format for time-dynamic data). This flexibility makes it a versatile tool for working with a wide range of data types.
4. High Precision Terrain and Imagery
CesiumJS comes with access to high-resolution terrain datasets and satellite imagery that can be layered onto the globe, giving users detailed views of landscapes. Custom imagery layers can also be added, enhancing visualization for specialized applications.
5. 3D Models and Buildings
Beyond terrain and imagery, CesiumJS supports loading and visualizing 3D models in formats like glTF, allowing for the rendering of buildings, vehicles, and even spacecraft.
6. Performance and Scalability
CesiumJS uses techniques like Level of Detail (LOD) rendering to ensure that performance remains smooth, even when dealing with massive datasets. LOD ensures that only the data relevant to the user’s current view is rendered, reducing resource consumption.
Common Use Cases for CesiumJS
The versatility of CesiumJS allows it to be used in a variety of fields, offering unique benefits for industries relying on geospatial data. Here are some common use cases:
1. Urban Planning and Smart Cities
Urban planners use CesiumJS to visualize city models, including buildings, transportation systems, and land use. By overlaying real-time data like traffic flows or environmental metrics, planners can gain insights into infrastructure needs and the impact of development projects.
2. Aerospace and Satellite Tracking
CesiumJS is widely used to track satellites and space objects. It can display the real-time position of satellites in orbit, allowing users to animate satellite paths and predict future positions based on historical data.
3. Environmental and Disaster Management
With CesiumJS, organizations can monitor and visualize environmental changes over time. From tracking deforestation to modeling the spread of wildfires or floods, CesiumJS provides dynamic tools for environmental management and disaster preparedness.
4. Military and Defense
CesiumJS is employed in military simulations and operational planning. It allows for the visualization of troop movements, terrain analysis, and mission planning in 3D, offering a high level of spatial awareness.
5. Telecommunications
CesiumJS can be used to visualize and optimize the placement of telecommunications infrastructure like cell towers. By overlaying 3D models of urban environments, planners can assess the best locations for coverage and signal strength.
Getting Started with CesiumJS
To get started with CesiumJS, you first need to include it in your project. Here’s a quick setup guide:
Install CesiumJS:
You can install CesiumJS via npm:npm install cesiumSet Up Your App:
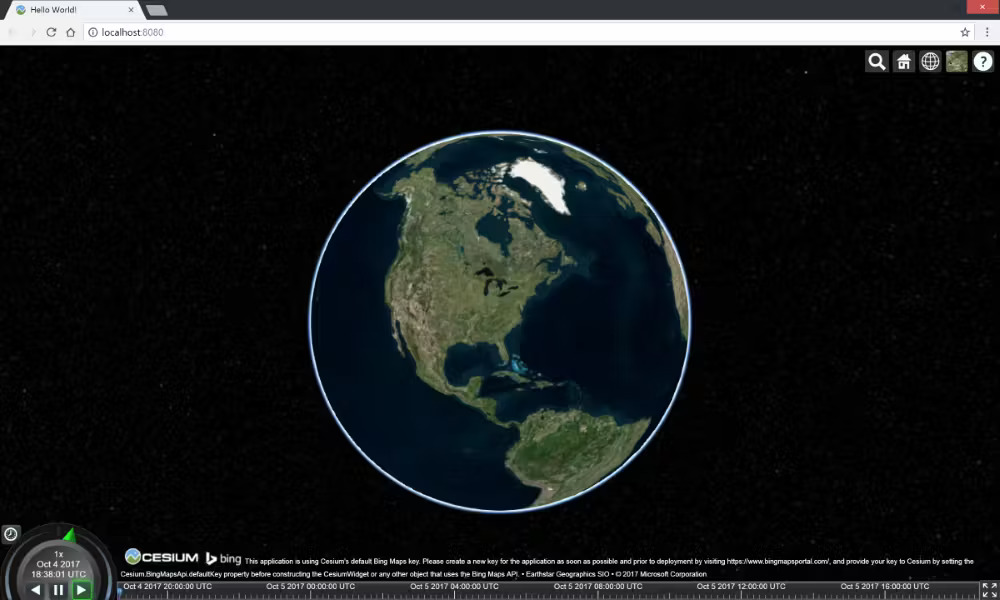
After installing CesiumJS, set up a basic HTML page and include the following code to create a simple 3D globe:htmlCopy code<!DOCTYPE html> <html lang="en"> <head> <meta charset="UTF-8"> <meta name="viewport" content="width=device-width, initial-scale=1.0"> <title>Cesium Globe</title> <script src="node_modules/cesium/Build/Cesium/Cesium.js"></script> <link href="node_modules/cesium/Build/Cesium/Widgets/widgets.css" rel="stylesheet"> <style> #cesiumContainer { width: 100%; height: 100vh; margin: 0; padding: 0; overflow: hidden; } </style> </head> <body> <div id="cesiumContainer"></div> <script> Cesium.Ion.defaultAccessToken = 'your-cesium-ion-access-token-here'; const viewer = new Cesium.Viewer('cesiumContainer', { terrainProvider: Cesium.createWorldTerrain() }); viewer.scene.globe.enableLighting = true; </script> </body> </html>Add Geospatial Data:
Once the globe is set up, you can start adding custom data like satellite imagery, 3D models, or vector data to visualize specific locations or objects.Output :

Why Choose CesiumJS?
CesiumJS is a robust and flexible solution for any developer working with geospatial data. Its ability to handle massive datasets, render in real-time, and visualize data in 3D sets it apart from other web-based mapping tools. It’s an excellent choice for building immersive, data-driven applications that need precision, scalability, and high performance.
Whether you're visualizing satellite orbits, monitoring environmental changes, or modeling entire cities, CesiumJS provides the tools you need to bring your geospatial data to life.
Conclusion
CesiumJS is transforming how we visualize and interact with 3D geospatial data on the web. Its extensive features, scalability, and versatility make it ideal for a wide range of applications, from urban planning to aerospace and beyond. If you’re looking to develop cutting-edge web applications that involve 3D mapping and real-time data, CesiumJS is a technology worth exploring.
Subscribe to my newsletter
Read articles from NITYOM TIKHE directly inside your inbox. Subscribe to the newsletter, and don't miss out.
Written by

NITYOM TIKHE
NITYOM TIKHE
I am a dedicated Frontend Engineer with a strong focus on building responsive and innovative web applications. Proficient in React, Vite, and Framer Motion, I specialize in creating dynamic user experiences. With a background in both web development and algorithmic problem-solving, I bring technical expertise and creativity to every project. Let's connect and collaborate on exciting tech ventures!